Saturday, January 23, 2010

Welcome Back to Financial Thunderdome.....Two Man Enter, One Man Leave, Two Man Enter, One Man Leave....

For those of you who don't know what I'm talking about when I mention "Thunderdome", check out this 8 minute clip of the classic movie "Mad Max Beyond Thunderdome". The financial markets appeared to have formed major tops and have now reversed in a huge and power wave [3] or C. If correct, it's about to get crazy ugly and nasty. Watch the clip and you'll see the parrallel between Thunderdome and what we're about to enter in the financial markets....


Okay, enough silliness, let's get down to business. The market is breaking down at numerous levels. So many that I'm not going to discuss them all here, but will illustrate the ones I feel most significant. First, let's take a look at the weekly S&P cash index wave count to get a clue as to the bigger picture, and where we're at right now as I see it:


As you can see, with last week's decline it has created the wave Z of [2] or B top. Meaning that a huge and monstrous wave [3] or C is at its very early stages right now. Both 3rd and C waves are very powerful and deliberate waves, so it's of little importance at the current time which one we've started. But the above chart should give you an idea of the magnitude of the decline we're about to embark on. So now let's look at an S&P daily chart that shows up close what happened this week:


This week's decline took us to about the same levels we were at on October 14, 2009. So in just 3 days, the S&P knocked out 3 months of progress! That's amazing, and is just another sign that the trend has changed from up to down. What's also signficant about this chart is that we easily broke right through 1115, which was the upper channel that held the market for several weeks, and even broke and closed beneath the important 1100 level as well. This is huge. It shows that a lot of folks are throwing in the towel who would have normally offered some kind of resistance at these levels. With that said, we still have the all important 1082 level that has really given the bears problems the past few months. Remember my chart from a few weeks ago citing key levels to be broken (click here for chart). So, will the S&P break and close beneath this level to basically put a nail in the coffin for the bullish case? To help us with this answer, let's look at how the short term wave count is unfolding right now with the 15min chart below:


As you can see I modified my 15min chart S&P count to the much more aggressively bearish counts I had on the Nasdaq and Russell. Friday's continuation and acceleration of the downtrend has forced me to alter my count this way. It appears that a series of 1s and 2s have unfolded which when complete, should lead us to some sideways down action as we get a series of 4s and 5s unfolding which should happen next week. With this count on track, it seems like it should be no problem at all for the S&P to break and close beneath 1082 some day next week. In my view, that will leave little doubt at all that a major top is in and the big daddy wave [3] or C decline is underway that should last many months. So, now let's look at the RSI momentum indicator on the weekly S&P chart:


Here you'll notice that the RSI momentum trendline that has held this market up the past 10 months has been significantly broken. Now this isn't an hourly or even daily chart, it's a weekly chart. So this is a very reliable indicator that the market's momentum has now turned south. The only thing I see as a potential warning sign to the bearish case is that we had a decline nearly identical to this one a few weeks ago as you can see in blue circles on the chart. Last time it led to the market reversing the downtrend and rallying to new highs. A red candlestick to new lows next week will negate this similarity. Now let's look at the RSI divergences on the weekly chart:


Take a look at what the RSI did leading into the March 2009 low. The S&P made a new low, but the RSI did not. This bullish divergence eventually led to the 10 month 72% rally we've just encountered. Now look at the recent behavior of the RSI and S&P. We now have the exact opposite occuring. The S&P grinded out a new high while the RSI did not. This bearish divergence was confirmed with a turn and close lower this week. This is signficant on a weekly chart, and combined with the other plethera of evidence suggesting a top is in, it adds even more importance to this indicator. The last divergence led a 72% move in the market, will this current divergence do the same to the downside? or more? Lastly, let's look at the VIX real quick:
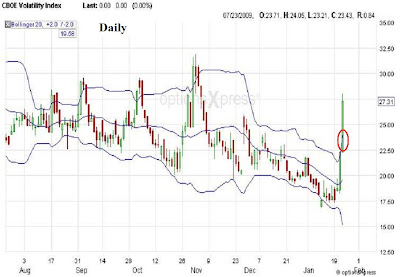


The VIX did the 2nd option I mentioned in last week's post (click here for entire post) in that the market kept falling lower and the VIX kept surging higher, forbidding it to fall and close beneath the upper bollinger band (red circle) which would trigger a buy signal. This is due to the huge amount of fear and put buying sparked from enormous complacency in the market's rally up to this point. Once the VIX does close beneath that bollinger band, it will signal that the short term decline will likely end very soon and the market will rally. I expect this to happen when the first large wave 2 is ready to get underway. But that hasn't happened yet, and the wave structure suggests the market will subdivide lower next week to break new ground to the downside.

As for the AUD/USD and the GBP/USD, the pairs should work themselves lower to at least one more new low. The stops remain the same as recent updates with the GBP/USD stop at 1.6295 and the AUD/USD stop at 0.9285.


See you all next week!

PLEASE NOTE: THIS IS JUST AN ANALYSIS BLOG AND IN NO WAY GUARANTEES OR IMPLIES ANY PROFIT OR GAIN. THE DATA HERE IS MERELY AN EXPRESSED OPINION. TRADE AT YOUR OWN RISK.

Friday, January 22, 2010

Secondary Indices/Sectors Showing Much More Bearish Potential


One reason I don't want to get too cute in trying to get long, or take a lot of profits off the table right now, is because other sectors and indices show alternate wave counts that are extremely bearish in the short term. These can also be translated well over to the Dow and S&P as well, especially because the slope of my proposed waves 2 and 4 are quite different. Notice in my S&P chart (click here for chart) that the wave 2 is long and wide while the wave 4 is short and narrow. This may mean that it's actually a series of 1s and 2s, like what I have labeled in the Russell 2000, Nasdaq Comp., and XLF (financial sector) in the attached charts.

I need the market to play out some more here to get a better idea of which counts are correct, but all the top counts I have right now point to lower levels overall, with this week's highs remaining intact for a while.


PLEASE NOTE: THIS IS JUST AN ANALYSIS BLOG AND IN NO WAY GUARANTEES OR IMPLIES ANY PROFIT OR GAIN. THE DATA HERE IS MERELY AN EXPRESSED OPINION. TRADE AT YOUR OWN RISK.

I'm Lowering Stop on the GBP/USD; Stock Market Dropped in 5


I just wanted to make known that I lowered my stop on the GBP/USD short trade from 1.6470 to 1.6295, making me risk only 60 pips now. The wave count possibly has this pair in a wave 3 right now as you can see from the attached chart, so the 1.6295 level should not be exceeded any time soon. If this pair does not tank hard in the coming days, I will exit the position; hopefully at a profit.

On another note: the stock market shot to beneath yesterday's lows this morning, completing a nice 5 wave decline off the highs. This is just more evidence to support that a significant top is in, and perhapst THE top. However, with 5 waves down possibly completed right now, it's possible a sharp snap back rally can ensue any time. But this week's highs sould hold though. I do not want to get cute and try to play the long side here as the evidence strongly suggests there has been a major trend change at this point. The wave count can easily morph into a series of waves 1s and 2s leading us to a wave 3 of 3, or even that this 5th wave becomes extended. Both scenarios would have this market accelerate lower. The trend is down, so I'm aligning myself with that trend only.

More later...

PLEASE NOTE: THIS IS JUST AN ANALYSIS BLOG AND IN NO WAY GUARANTEES OR IMPLIES ANY PROFIT OR GAIN. THE DATA HERE IS MERELY AN EXPRESSED OPINION. TRADE AT YOUR OWN RISK.

Thursday, January 21, 2010

Stock Market on Track with Recent Projections; Look for 5th Wave to New Lows Soon


The stock market finally had some continuation and acceleration after an initial sell off. We haven't had that in a while. However this only leaves us with a 3 wave drop as you can see from the attached S&P chart. So we need to see at least a new low beneath today's in order to call the count complete for the short term, and to add further evidence that a major top is in. The VIX spiked big today creating a set up for a short term buy signal. Once the index closes beneath the upper bollinger band on a daily basis, the actual buy signal will be issued. So this sets up a couple scenarios for the bears:

1) the market will tank again tomorrow to new lows, completing the 5 wave drop from the highs earlier this week, and then reverse in a strong wave (ii) rally either late tomorrow or early next week causing the VIX to close beneath the bollinger band issuing a buy signal, and allowing for some more corrective rallying in the following days;

or

2) the market will just continue to fall off a cliff, causing the VIX to spike higher and higher to where it doesn't close back underneath the bollinger band for a long time.

The bad situation for the bears would be if the market does not make a new low and rallies enough to drop the VIX to close beneath the top bollinger band, leaving a 3 wave decline in the S&P and a short term buy signal issued. So tomorrow might prove to be quite important.

I see the S&P in a wave iv now, or just completed, and we're heading down in a wave v at the moment; or we'll have a pop rally early tomorrow morning to complete wave iv which will then quickly reverse to beneath today's lows. If the market pops in the morning, it can only be a wave iv by the count I have here if the market stays beneath the wave i low at 1129.25. So if the market does not break beneath today's lows and then rallies above 1129.25, then my count is wrong, and if the market rallies above 1141.58 then it will leave a 3 wave drop in the S&P and probably mean that new highs for the year are coming soon.


PLEASE NOTE: THIS IS JUST AN ANALYSIS BLOG AND IN NO WAY GUARANTEES OR IMPLIES ANY PROFIT OR GAIN. THE DATA HERE IS MERELY AN EXPRESSED OPINION. TRADE AT YOUR OWN RISK.

Market Continued, and Accelerated, this Week's Downtrend; The Bearish case is off to a Good Start


So today the stock market finally showed some continuation to the selling pressure from the day prior, and has accelerated that trend, unlike previous fakeout sell offs we've had in the past. It will be interesting to see the market action into the close though; about an hour from now. I'm looking for a strong close in the S&P cash index below the 1131.39 level I cited in a previous post (click here for chart). A strong close beneath that level today would strongly suggest that a significant top is in.

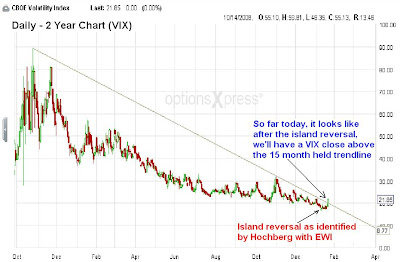
One thing I wanted to point out is that after Steve Hochberg with EWI pointed out the bullish island reversal in the VIX a few days ago, the "fear index" has been pushing higher and has really surged today; so much so that it's piercing through a 15 month descending trendline held since the October 2008 collapse. If the VIX closes above this trendline as shown on my attached chart, and holds it in the coming days, this indicator combined with the island reversal would suggest that the VIX is going to soar higher, and therefore stocks should tank lower.

My AUD/USD and GBP/USD sell stop orders executed so I'm now short both pairs with very wide stops. It's my goal to exit this trade if they don't act like I think they should, or I'll at least significantly lower my stops as soon as possible. Since my risk is so wide here, I'll little patience in holding on to these pairs for a long time if they don't perform. As you can see on my wave counts for these pairs, it seems they're completing 5 wave drops. Now this can morph into an extended 5th wave, or subdivide into various fractals leading the pairs lower, so I don't want to lower my stops now. I plan to let stocks show their hand a little more at the close here and see how these currencies react in the coming days and then take action to reduce risk.

I should have more later on the stock market after the close.


PLEASE NOTE: THIS IS JUST AN ANALYSIS BLOG AND IN NO WAY GUARANTEES OR IMPLIES ANY PROFIT OR GAIN. THE DATA HERE IS MERELY AN EXPRESSED OPINION. TRADE AT YOUR OWN RISK.

Wednesday, January 20, 2010

AUD/USD and GBP/USD Currency Trades


Just wanted to let everyone know that I'm currently flat on currencies, but just put in two orders to get short the AUD/USD and the GBP/USD if they break beneath today's lows. My thinking is that I want to get long the US dollar, and I usually do that by shorting the EUR/USD. And seeing as that it's possible that the EUR/USD is about to tank hard along with equities in an extended 5th wave, or even possibly a 3rd wave, I want to make sure I'm long the US dollar in some way. But the EUR/USD pair has fallen too much at this point to jump in right now. But by looking at the the GBP/USD and the AUD/USD, it's evident that they have not fallen nearly as much as the EUR/USD so perhaps there's a good trading opportunity there because risk is well defined and not as wide as that of the EUR/USD.

I don't want to enter short these pairs right now because of the late day strength we had in the pairs and the stock market; it may mean that another rally phase is underway. So I just decided to get short if weakness continues because it may accelerate aggressively soon. So I put sell stop orders in for the AUD/USD at 0.9060 and for the GBP/USD at 1.6235. My stops are listed in the attached charts, and I will look to lower those stops as soon as I can if my orders execute.

A Top is in...


What an exciting week this has turned out to be in the markets. The S&P cash index made a new high by .04 points according to OptionsXpress, but the S&P futures fell short of a new high by .50 points according to OptionsXpress. Like I've said many times before, and as many of you know, the market will do everything it can to shake you out before it forms a major top and reverses. The Dow made a new high, but the Nasdaq Composite and Nasdaq 100 failed to do so. We also have break-away gaps from the major indices at this morning's open while all the major indices broke last week's lows. The Dow has been making new highs the past several days while other indices, especially the Nasdaq Composite, has failed to do so. This type of action, along with the break-away gaps this morning, are signs of a severe exhaustion in the uptrend. Although it appears that a major top is in, we've seen this market do crazy things to shake out the weaker hands, so I'd like to see the S&P close beneath last week's lows at 1131.39 today in order to confirm that a major top is in. Continuation and acceleration of this downtrend will strengthen the case that THE top is in of wave C of Z of [2] or [B].

Adding more pressure to equities is the collapse in precious metals today with silver down well over 4%, as well as weakness in the EUR/USD (US dollar strength). As you can see from the attached chart, the long term EUR/USD trend is now officially down as last night the the pair made a new low completing its 5 wave drop from the November highs. The pair should be at the beginning of a multi-month decline which means the US dollar will be on a multi-month advance. This will bring about tremendous pressure on the stock market and precious metals and other commodities, which also lends itself to the projection for a top in equities as well.

Many of you subscribe to and follow Bob Prechter and Elliott Wave International's newsletters, educational materials, and forecasts. I don't want to reveal any proprietary information they have for their paid subscribers, but they have been nailing this wave count and technical analysis for a long time now. And although they certainly are not perfect, no one is, they have been excellent giving average traders like myself a significant advantage in the market. I'm not just saying that because I'm an EWI affiliate, I'm saying that because credit is due where it's deserved.


PLEASE NOTE: THIS IS JUST AN ANALYSIS BLOG AND IN NO WAY GUARANTEES OR IMPLIES ANY PROFIT OR GAIN. THE DATA HERE IS MERELY AN EXPRESSED OPINION. TRADE AT YOUR OWN RISK.

Tuesday, January 19, 2010

Make or Break Time for the Bears; Risk/Reward Favors the Short Side


Just a quick note this morning; the markets have surged higher this morning sharply, bringing the major indices close to last week's highs, however none have exceeded those highs. The S&P is only 6 points from doing so, so it brings about a great risk/reward opportunity for the bears here whether to establish a short position or just add to it. I would place a stop at 1151 or higher. The possible profits of catching a major top here and risking only 6 S&P points is quite significant so I would think it's worth taking. A break above 1151 would get the index marching towards the 1200 level.

The EUR/USD has declined in 5 waves on the hourly charts but has not made a new daily low beneath 1.4217 yet, but I believe it will do so quite soon. Although the EUR/USD is tanking hard, the AUD/USD and GBP/USD have remained quite buoyant and have not followed the EUR/USD. Although the EUR/USD just completed 5 waves down, it may be the finishing 5th wave of a multi-month impulse decline starting in November, and the risk of sharp snap back rally in a wave 2 is too great at this point. Currencies are a bit "dicey" right now and not exactly clear where exactly we are in the wave count so I remain on the sidelines in the currency market right now.


PLEASE NOTE: THIS IS JUST AN ANALYSIS BLOG AND IN NO WAY GUARANTEES OR IMPLIES ANY PROFIT OR GAIN. THE DATA HERE IS MERELY AN EXPRESSED OPINION. TRADE AT YOUR OWN RISK.

StatCounter