Friday, August 19, 2011

Risk of Stock Reversal Increasing


I'm not too interested in reading the internals today since it was an options expiration day which can skew these numbers a bit.  However, considering the fact that there's usually heavy volume on option expiration day, the fact that there were only 1.5 billion shares traded lends itself to a Minor wave 5 outlook that is finishing up most likely.

And make sure you keep the bigger picture in mind and what it might mean for your long term portfolio:
See Prechter's "FREE FALL TERRITORY" Chart for Yourself


The more conservative way of counting the subwaves of Minor wave 5 is above.  I have 5 Minute waves almost complete which will wrap up Minor wave 5 very soon in the process.  I know that these waves are small for Minute waves relative to the prior Minute waves in this decline, but 5th waves often unfold imperfectly from what I've seen, so I'm planning for the most conservative scenario, which is above. 

I've removed most of my short positions to reduce risk.  The market has moved in my favor big enough and fast enough to warrant some profit taking at these levels.  Sure, Minor wave 5 can turn into an extended 5th wave and cascade downward to significantly lower levels.  But at this point that would just be a guess since there's no evidence to support that here, and the risk of a very large Intermediate wave (2) starting at any moment is great.  So the risk/reward for the bears here is not appealing to me.  So I took profits today.

Download Robert Prechter’s free report. - offer expires August 22nd


The other more aggressively bearish outlook is posted above.  In a perfect EWP world, and a world that I wasn't trying to reduce risk on my short positions, this count would be my top choice.  The count shows only a Minuette 5 waves completing here for Minute wave ((i)).  Meaning that after a corrective Minute wave ((ii)) rally, the market will continue much lower to complete all of Minor wave 5.  The possibility that this count may be in play is the reason why I kept a very small short position in place still.  If the structure clears up in the future to make this count a high probability, and the opportunity arises, I might attempt to re-enter on the short side if I can keep risk tight.  But for now, this count is only in the back of my mind as I try to reduce risk in preparation for a big Intermediate wave (2) rally.

SAVE 57% with this LIMITED-TIME OFFER: See what we see next for the markets now via this instant-access discount subscription offer.


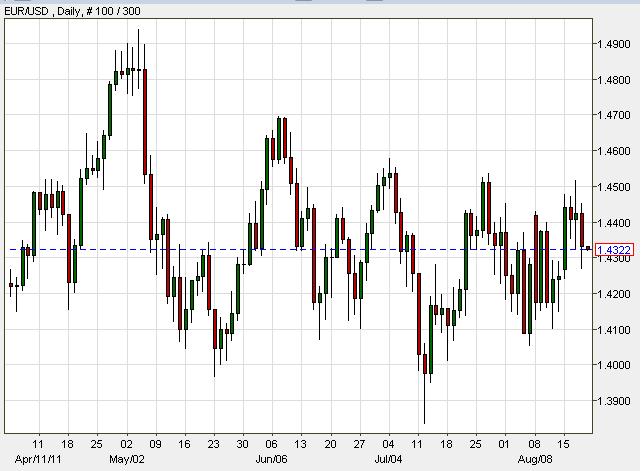
The euro arguably completed a 5 waves down with a sharp corrective rally today.  I didn't label the chart because I don't want it to be misinterpreted that I actually buy into the view that this proposed 5 wave decline is the start of a new downtrend, because I don't.  The daily chart of the euro shows what is clearly a corrective downward move by EWP standards, meaning the next big move is up.  Aside from the series of lower highs in place that keep me from getting long for now, the euro does look overall bullish to me here.  Stocks have sold off drastically the past few weeks yet the euro has held firmly still, partly because gold has been in a blowoff top - or vice versa.  So I don't see how the euro will all of a sudden tumble at the tail end of Intermediate wave (1) in stocks.  Most likely the euro is waiting for Intermediate wave (2) in stocks for it to start declining, or it's going to rally with stocks' Intermediate wave (2), then decline hard with stocks' Intermediate wave (3).  There are too many "ifs" and question marks here for me.  So I'm standing aside for now.

Learn Elliott Wave Principle


PLEASE NOTE: THIS IS JUST AN ANALYSIS BLOG AND IN NO WAY GUARANTEES OR IMPLIES ANY PROFIT OR GAIN. THE DATA HERE IS MERELY AN EXPRESSED OPINION. TRADE AT YOUR OWN RISK.

Thursday, August 18, 2011

Stocks' Wave 5 Down Underway; Euro a Mess


Simply put, the reversal signs I noted in yesterday's post were indeed the kickoff to Minor wave 5 down.  New lows are just around the corner.  Internals today were a blood bath as you might have imagined.  97.3% of NYSE volume was to the downside and almost all S&P stocks were down on the day.  But volume was not nearly as large as it was in the previous down move.  Today we saw only 1.6 billion shares traded instead of the 2.5 billion area we saw before.  This further gives us evidence that a 5th wave is underway since EWP states that 5th waves are often accompanied with diverging momentum relative to the previous 3rd wave at the same degree.  So the previous 3rd wave at the same degree had volume in the 2.5 billion range, and now the 5th wave is in the 1.5 billion range.  Typical behavior of 3rd and 5th waves which helps strengthen the top wave count.

Download Robert Prechter’s free report. - offer expires August 22nd


Speaking of wave counts, let's get some posted.  Normally I just like to get to the bottom line and not get too tied up with the details that really aren't relavent at that moment.  The bottom line was that a 3rd, 4th and 5th wave have been on our plates and the focus should be on that current up/down movement, not what the bigger picture wave counts might be which will onlly cloud the issue.  In general, up until now, all the wave counts virtually would result in the same up/down movements, so I just focused on that fact.  But now that we're entering a time where the wave count options will start to separate from each other, I want to post the counts I'm tracking closely to get a better idea of where to look in the future.

Above is the preferred count I'm tracking now.  It's a little different than what I've been posting the past few days because Minor waves 1 and 2 have move back one wave.  The internal strength of Minor wave 3 compared to the current Minor wave 5 make this count the most viable in my view.  New lows in the major indices should be just around the corner, but once those lows are achieved, perhaps in only some of the indices, there will be a very sharp and long Intermediate wave (2) rally.  I would not want to be caught holding short during that rally so I'm choosing to begin the exit of my short positions now.  I'll then reshort as the big Intermediate wave (2) rally gets underway as long as it has the characteristics of a countertrend rally (corrective).

And make sure you keep the bigger picture in mind and what it might mean for your long term portfolio:
See Prechter's "FREE FALL TERRITORY" Chart for Yourself


In a perfect world, this count would be preferred. The reason is because Minor wave 3 should subdivide into a little nicer 5 wave move, giving it the "right look" in EWP's guidelines.  But we don't live in a perfect world, and the market rarely gives us perfect EWP form.  In my opinion, the move down has been so great and the profits so large that ignoring the first count I posted and trading based on this count would just be greedy.  Even if this count here is correct, the market is going to make one more low anyway and getting out at that point to avoid being caught short in Intermediate wave 2's monster rally is well worth it in my view.  Trading is all about risk/reward in my view, not trying to squeeze out every last drop of profits out every move even when a larger countermove is imminent.

SAVE 57% with this LIMITED-TIME OFFER: See what we see next for the markets now via this instant-access discount subscription offer.


Lastly, there is a less bearish option as seen above.  Instead of an impulsive decline downward as I counted in the two above charts, here we have an Intermediate (A)(B)(C) decline that will end with a new low soon.  Wave Cs are 3rd waves and are equally destructive according to EWP, so we can't say the past few weeks of heavy selling can only be a wave 3.  It can also be a C wave.  This count will keep me honest on the next big rally phase.  I have to make sure that I analyze the rally carefully in order to determine if it's characteristic of a new bull run, or if it's just part of a correction.  Making that determination will be key in placing big bets on the next big move the market makes.

I know this is a lot to digest and can be a bit confusing to those not EWP savvy.  This is why I usually just focus on the bottom line and don't get too tangled in the details.  The bottom line though for the short term is that regardless of which count is correct, notice that in the short term all the counts agree that the markets are headed to new lows soon and will rally soon after that.  From there we can better determine which of the above counts we should eliminate depending on the size, structure and strength of the impending rally.

Learn Elliott Wave Principle


The euro is a mess and according to EWP, this is clearly a correction within a larger bullish move.  The euro's failure to collapse with stocks also strengthens the thesis that this is just a correction within a larger bull move.  The problem is that it can't make a new swing high on a daily basis, making it hard to get long right now.  But overall, I think that it's currently in a 4th or B wave within a larger upward correction.  Once the 5th or C wave rally is complete, which will probably be in conjunction with stocks' Intermediate wave (2) rally, then the euro should fall hard along with stocks' Intermediate wave (3).  But right now, I'm avoiding trading the euro.

PLEASE NOTE: THIS IS JUST AN ANALYSIS BLOG AND IN NO WAY GUARANTEES OR IMPLIES ANY PROFIT OR GAIN. THE DATA HERE IS MERELY AN EXPRESSED OPINION. TRADE AT YOUR OWN RISK.

Wednesday, August 17, 2011

Today's Reversal Looks Appealing


I'm looking for Minor wave 5 to get underway to continue shorting with the larger trend. Today's reversal is a good initial sign that perhaps Minor wave 5 has started. But an S&P key level needs to be broken first.

Download Robert Prechter’s free report. - offer expires August 22nd


Today the market put in a nice reversal that sets up the possibility Minor wave 5 is now underway.  The Dow, S&P and Nasdaq 100 all made new highs today while the Composite lagged.  Tech is also leading the charge lower right now which shows that some risk aversion has returned.  Also, notice that the S&P's new high was not confirmed by the RSI.  Overall, the new highs made today were very weak and the reversal that just happened make it ripe for Minor wave 5 to get underway.  But I don't want to jump the gun early, I still want to see if the S&P cash index breaks to a new low beneath 1180.53, then I think it's a good risk/reward trade to be short here with a stop just above today's high.

Learn Elliott Wave Principle


PLEASE NOTE: THIS IS JUST AN ANALYSIS BLOG AND IN NO WAY GUARANTEES OR IMPLIES ANY PROFIT OR GAIN. THE DATA HERE IS MERELY AN EXPRESSED OPINION. TRADE AT YOUR OWN RISK.

Monday, August 15, 2011

Stocks Continue 4th Wave; Euro Trying to Breakout to the Upside

One last time, in case you missed it:
Prechter Discusses Market Forecasts on CNBC Closing Bell

We invite you to watch the interview below. Then download Robert Prechter’s free report that uses an 84-year study of stock market values to help you prepare for and understand today’s critical market juncture.


Download Robert Prechter’s Free Report To Discover How You Can Prepare For Today’s Critical Market Juncture


While we're sure you're reading countless articles and analysis about the market's recent volatility, if you're not reading what EWI's subscribers read, you're missing the valuable, prescient perspective contained in each issue of Robert Prechter's market letter, The Elliott Wave Theorist.
Access Robert Prechter’s free report and read in-depth analysis -- including an 84-year study of stock values -- that will help you prepare for and understand today's critical market juncture.

Download Robert Prechter's Free Report.


MONDAY'S POST


Internals today show a countertrend rally.  Volume continued to contract today as the NYSE only hit 1.1 billion shares whichs is about half of what we've been seeing the past couple weeks.  The price move was big, but internally it's hollow, suggesting this rally is countertrend. I'd continue shorting rallies.....this surge the past few days should be completely erased in fast order pretty soon.  If a bottom for the year was put in last week, there'd be a lot more volume on the rallying the past few days, in my opinion.


It's just a waiting game for the bears in my view.  Stocks look strong as they shrug off bad news and rally on mild good news.  The market is clearly relieving its oversold condition from the past few weeks of heavy selling.  Right now the S&P is in a good and typical reversal zone for 4th waves.  Fibonacci retracement levels of 38% - 50% of the prior move tend to be good areas for reversals to happen.  The problem is that there is virtually no evidence that there is a reversal, or that one is coming.  The market is is full bull mode at the moment.  The daily RSI has come out of significan oversold territory, and another day or two of up closes should prime it to get ready for another downturn.   

So although there's no evidence of a top in place, I'm watching the S&P's 1200-1223 area for signs of a reversal so I can add to my shorts.

Learn Elliott Wave Principle


For continuity purposes I'm posting the follow up to last Thursday's short term chart forecast.  According to this count, Minor wave 4 is coming to an end.  I still feel we need some more up/down movement that's weak internals, i.e. low volume with dragging momentum.  I wouldn't doubt if today starts that pattern, but it will probably continue at least another day or two before reversing sharply lower.


The euro has made a new swing high and is trying to breakout to the upside.  It has yet to take apart the series of swing highs laid before it though.  Breaking above 1.4600 would probably point to a sharper move higher in the coming days.  I'm now neutral the euro.


PLEASE NOTE: THIS IS JUST AN ANALYSIS BLOG AND IN NO WAY GUARANTEES OR IMPLIES ANY PROFIT OR GAIN. THE DATA HERE IS MERELY AN EXPRESSED OPINION. TRADE AT YOUR OWN RISK.

StatCounter