Thursday, March 10, 2011

1 Count Down, 2 Left; Euro is Bearish


The breakout I mentioned yesterday sure came true today as an across the board bloodbath took place right from the jump this morning. Headlines in some major financial media outlets said that poor US data was the reason for the slide, but I noticed the US futures were down big early last night, well before that data came out. Wavers didn’t need a crystal ball to predict this breakout, they just need to count the triangle and play the sharp move that was imminent. The breakout to the downside today broke through my key level of 1294.26 by just a hair which eliminates the bullish scenario calling the recent action a 4th wave triangle. Now there are only two scenarios left, both of them are listed below.

As for the internals, as one would think, they were very bearish today. There were 2,037 more decliners than advancers on the NYSE, and 447 more advancers on the S&P. 89.6% of total volume on the NYSE was to the downside, and total volume surged today compared to yesterday coming in at 1.15 billion shares compared to yesterday’s 870 million shares. So the market was solidly bearish and the momentum is in the bears’ corner right now. But the past several months this hasn’t led to much follow-through from the bears. The bears come in for a day or two and then the bulls easily takeover and push the market to new highs. So again we’re left with a test of the bears’ will. Knowing the preferred wave counts will help us determine what to look for to see if the bears have what it takes to control this market over indefinitely.


Above is the Minuette wave (b) triangle I listed yesterday. This is far from an ideal triangle so it makes this a big shaky as far as probability. The 5 wave decline we see is Minuette wave (c), and might have a little more downside movement tomorrow before it bottoms, most likely completing Minute wave ((iv)), then rallying to new highs to complete Minor wave 5 of Intermediate wave (C) of Primary wave ((2)).

Learn Elliott Wave Principle


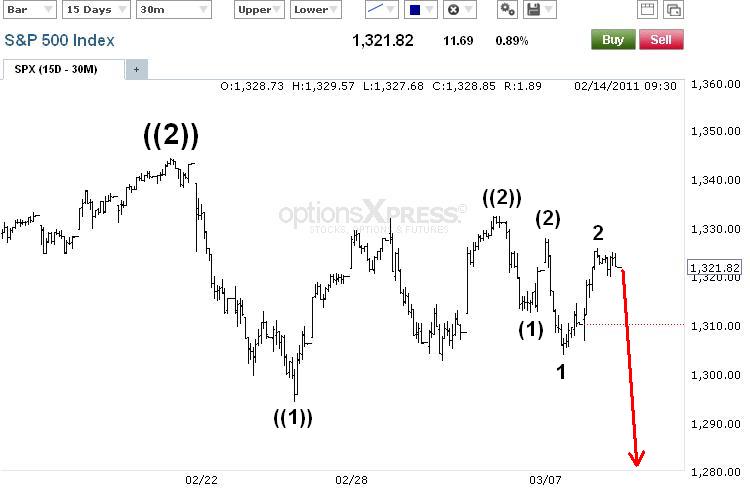
This next count is very aggressively bearish, but much like the triangle count listed above, this count here is not perfect either. Submicro wave (2) is shorter than Miniscule wave 2 which is one degree smaller. This is not typical for impulsive waves, so it makes this count a bit questionable. However the market doesn’t unfold perfectly, and this count does not violate any EWP rules so it still remains a possibility. Under this count, stocks are at the beginning of a major downtrend that will take the S&P down at least 50-100 points from current levels. If correct, there should be heavy selling in the next few days since this is a 3rd wave at 3 different degrees of trend.

Big Advantages of Trading with the Wave Principle


The euro’s upward correction last night was very weak, much weaker than expected, and it fell hard into today’s close making fresh new lows along the way. This could mean that the new downtrend starting is very strong where upward corrections will be short, and shots lower will be steep. I’m seeing a few 5 wave moves to the downside so that keeps me bearish.


PLEASE NOTE: THIS IS JUST AN ANALYSIS BLOG AND IN NO WAY GUARANTEES OR IMPLIES ANY PROFIT OR GAIN. THE DATA HERE IS MERELY AN EXPRESSED OPINION. TRADE AT YOUR OWN RISK.

Wednesday, March 9, 2011

Stocks About to Explode, Play the Breakout; Euro Dropped in 5 Waves


The market did nothing today as far as price action goes as it continued to consolidate in a tighter and tighter range, typical of a triangle pattern.  Volume also continues to decline as the range in price gets tighter, also typical triangle behavior.  Other than that, nothing of note to report.  The price action and internals suggest a triangle is finishing up and will result in a sharp breakout.


Above is the 4th wave triangle I talked about yesterday.  This scenario now seems more likely after today's very tight range on light volume.  It's certainly not the perfect triangle, but more subdivisions in the coming hours/days may make us adjust the labels a bit.  But the end result will be the same, i.e. a sharp thrust to higher to a new high on the year.  Adhere to the levels I mentioned in yesterday's post for my opinions on guidance to trade with.

Learn Elliott Wave Principle


EWP states that triangles only occur in 4th, B and X waves.  Since I've already discussed the 4th wave, and the X wave is almost impossible here, I thought I'd show the B wave triangle.  Here we'll see a sharp thrust lower for wave ((c)) which will probably end the downward correction and lead to new rally highs eventually.   I'm unsure how this fits into the bigger wave count so I'm not considering it yet.  But it is something to be mindful as we move forward, just in case we get a sharp downward move, those of us waiting for a big 3rd wave here should keep this count in mind in order to keep us honest while trading.


Again, the 1-2, 1-2, 1-2 count is still on the table but less likely.  We should soon get a sharp thrust in either direction and it will help us eliminate one of the above counts.  But the tightening action of price and volume suggest a big breakout either up or down is about to occur, so being setup to take advantage of a sharp move in either direction seems wise here.  Option players might want to think about a "straddle" here.


The euro followed my forecast yesterday for one more new low to give us a nice 5 wave decline from the high.  So far my gut instinct has paid off and now we have solid EWP evidence a top is in.  I'm a seller on rallies as long as 1.4035 remains intact.

PLEASE NOTE: THIS IS JUST AN ANALYSIS BLOG AND IN NO WAY GUARANTEES OR IMPLIES ANY PROFIT OR GAIN. THE DATA HERE IS MERELY AN EXPRESSED OPINION. TRADE AT YOUR OWN RISK.

Tuesday, March 8, 2011

Stocks: To Triangle, or Not to Triangle; Euro Almost Completing 5 Waves Down


Internally the market was very bullish today in and of itself, however volume was very light and it did not match the bears’ intensity to the downside yesterday. Today the NYSE had 1,526 more advancers than decliners while yesterday had 1,608 more decliners than advancers. Today’s S&P advancers over decliners were about the same as yesterday’s so that’s a neutral result. Volume on the NYSE’s down-day yesterday was 1.03 billion shares while today’s up-day was only 987 million shares. Also, price today did not recover all losses from yesterday. So the bears held on to slight advantage by the skin of their teeth.


The aggressively bearish count above is not looking good from a probability standpoint. There are just too many wave 1s and 2s in place. From my experience, when I start counting a lot of 1 and 2 waves at various degrees it’s because I’m going against the trend, and trying to justify choppy price action with 1 and 2 waves. Although the above count is sound as far as EWP is concerned, it seems a bit unlikely. Only a very aggressive shot lower tomorrow, while not breaking above 1327.68 in the morning, would move this count up in probability.

Learn Elliott Wave Principle


The above count suggests a triangle is underway, and it would definitely explain the very choppy sideways nature of this market lately. Without breaking out to a new low or new high for about two weeks now, it makes this count more likely. A break below 1302.58 would put this count in severe jeopardy, while a break below 1294.34, or break above 1332.28, would completely eliminate it.

So to give you the bottom line, in order to take a position short term we need to know what the possibilities are, and I listed the top ones above. Staying within the levels I mentioned the triangle requires means that a very sharp shot higher to new highs on the year will be on the way once the triangle is completely. Of course, we’d like to get long with a stop just below 1302.58 or 1294.34 (depending on risk tolerance) in anticipation for the shot higher. However a break below 1302.58, and especially 1294.34, would eliminate the triangle and make the more aggressively bearish count more likely and therefore suggest a short position is preferred.

Big Advantages of Trading with the Wave Principle


The euro continued to fall last night as I would have wanted it to after taking a bit of a gamble on a short term short trade once I saw some subtle topping behavior yesterday. Even though we only have 3 waves down so far from the high, we only need one more new low to make the decline 5 waves. Doing so would be solid evidence that a top was in place and that we should favor the short side indefinitely. A break above 1.3956 before making a new low would cause some overlap and make this count invalid.


PLEASE NOTE: THIS IS JUST AN ANALYSIS BLOG AND IN NO WAY GUARANTEES OR IMPLIES ANY PROFIT OR GAIN. THE DATA HERE IS MERELY AN EXPRESSED OPINION. TRADE AT YOUR OWN RISK.


Monday, March 7, 2011

Bears Showing up for a Fight; Euro Shorting Opportunity for Aggressive Bears


I'm very short on time but am posting this since some significant developments occurred today. 

Internals were very bearish again today, and on a Monday no-less, which has traditionally been owned by the bulls.  The internals weakness along with some small 5 wave counts on the smaller timeframes and the breaking down of 1312 at today's close make it an interesting play for the bears here.


1312 was taken out today at the close, erasing that big bullish surge last week and triggering a short position on my part.  Under this count above, a series of 1s and 2s are unfolding and should soon give way to a wave 3 at several degrees which essentially means a sharp almost straight line down.  As long as 1327.68 remains intact, I feel comfortable being short here, a break below 1294.26 will make me extremely comfortable.

Learn Elliott Wave Principle


The alternate wave count that I'd like to see eliminated very quickly is the bullish triangle scenario above.  Under this interpretation we'll see more up-down action for a net sideways move that will result in a sharp thrust higher to new highs on the year.  A break below 1294.26 will negate this triangle and get me even more short this market.

EURO

As for the euro, today's reversal looks nice but didnt' really break any key levels or support.  But the action in the AUD/USD and GBP/USD on the other hand, looks very bearish.  I took an aggressive stance and shorted the euro on today's weakness against the recent highs.  With stocks looking poised to possibly fall hard and the euro overbought, I thought I'd take a shot.  But right now this is more of a calculated gamble with a very small position rather than calling a solid top and putting in a big long term position.


PLEASE NOTE: THIS IS JUST AN ANALYSIS BLOG AND IN NO WAY GUARANTEES OR IMPLIES ANY PROFIT OR GAIN. THE DATA HERE IS MERELY AN EXPRESSED OPINION. TRADE AT YOUR OWN RISK.

Sunday, March 6, 2011

Waiting for the Breakout in Stocks; Euro Still in Bull Mode


Thursday I said that the bears needed to get to work Friday if they wanted any chance to take over this market in the short/medium term.  They did in fact make an attempt and pushed the market down hard but failed to match the internal intensity the bulls had the day before, and failed to convincingly erase the bulls' gains or take out a key level.  So although the bears made a valiant attempt to roar back, so far it has failed to result in anything to convince me that they've taken back control of this market.

I want to see the 1312 level taken out and closed beneath in order for me to get short again.  That's the breakout level from Thursday that started the surprise bullish run up to a new high.  If the bears can get a close beneath 1312 it will tell me that the run higher was just a correction and that all that bullish momentum behind it was erased and that it was a failed push higher.  That would indeed get me bearish and short again.

However, if the 1332.28 level is taken out to the upside then that might get me bullish and long this market for a very short term trade.  The bears have failed to convincingly reclaim this market, and the bulls have really taken the reins and pushed this market higher so a new high above 1332.28 will erase all doubt in the uptrend in my view and get me long for the short term.

Learn Elliott Wave Principle


The euro keeps pushing higher and I see no evidence of a topping process occuring.  So the euro's uptrend remains well intact.  One thing to be aware of is that the 4hr RSI is at a level that has previously marked tops as you can see from my chart above.  This doesn't mean that the euro will top right now though.  All it means is that it's starting to get a little overbought, and longs should be cautious and alert here.  Since the larger trend is still down in my view, I'm simply waiting for signs of a top to get short.

Breaking News Bulletin: News Is NOT the Main Driver of Stock Market Trends


PLEASE NOTE: THIS IS JUST AN ANALYSIS BLOG AND IN NO WAY GUARANTEES OR IMPLIES ANY PROFIT OR GAIN. THE DATA HERE IS MERELY AN EXPRESSED OPINION. TRADE AT YOUR OWN RISK.

StatCounter