Friday, February 5, 2010

Market Snaps Back Late in the Day; GBP/USD Short Tracking Well


Please note that I updated my long term S&P chart to the current cash index count on the right hand side of this blog.

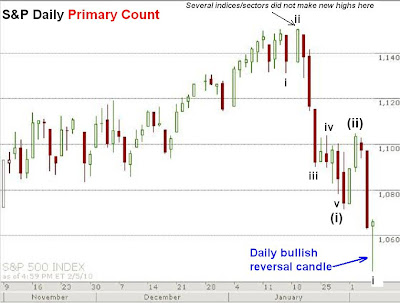
The market tanked mid-trading day and all the CNBC folks were talking about "capitulation" today, and making it a buying opportunity. I knew that probably meant that a bottom would not occur. A bottom should occur when everyone's paranoid and panicking, not when eveyone's calling a botttom. But I think that because of the steep selloff, and the quick gains the bears have made in the past several days, the shorts didn't want to hold their positions into the weekend so they covered them at the end of the day. Regardless, the rally was a small victory for the bulls. The move created a big daily reversal candlestick, reclaimed the Dow 10,000 level, the high risk Nasdaqs and XLF outperformed to the upside, and the rally late in the day unfolded in 5 waves. All-in-all, a small short term bullish victory. However I don't want to read too much into a late Friday rally, and I definitely don't want to get too cute if we're in fact in a wave (iii) decline right now in trying to pick bottoms. This market should be wild and violent throughout this major decline phase, leaving surprises constantly for everyone, although the surprises at this point should result in heavy declines. Again, despite today's late day bullish action, I remain extremely medium term bearish as I believe we're in a massive wave [3] or C decline. The short term ups and downs are of little consequence to me at this point. It's merely something I'm watching and following for the purpose of mentally preparing me for what may lie ahead, and the only change in position I'll take is to add to my short positions if a substantial rally occurs.


Looking at the short term 5min chart above you can see that the late day rally traced out a nice 5 wave rally. This means the short term trend is now up. Following a brief wave b decline, we'll get a powerful wave c up which should complete wave ii of (iii). Seeing as that this is a wave (iii) we're in right now, corrections should be very quick, and may surprise us as they may not unfold as perfectly as we'd like. So as I said before, I don't want to get too cute and take any positions based on this, I'm merely using this as something to follow and mentally prepare for. My expectation is for heavy selling with quick sharp rallies for the foreseeable future.


The XLF financial ETF also rallied in 5 waves, and much stronger percentage-wise, than the major indices, but could not recapture the $14 level today. As long as this ETF closes beneath $14, it leaves it vulnerable to a decline to $13 in a hurry, then probably much much further.


The GBP/USD short trade is tracking very nicely. With a short entry at 1.6235, and the stop sitting comfortably at a 305 pip profit at 1.5930, this trade is in great shape as it's acheived almost a 600 pip profit as of closing today, and has locked in a guaranteed 305 pip profit so far. If my above wave count is correct, this pair should be headed much lower in the coming days/weeks, with very little upward retracement. I remain firmly bearish on this pair and bullish on the US dollar.


PLEASE NOTE: THIS IS JUST AN ANALYSIS BLOG AND IN NO WAY GUARANTEES OR IMPLIES ANY PROFIT OR GAIN. THE DATA HERE IS MERELY AN EXPRESSED OPINION. TRADE AT YOUR OWN RISK.

EUR/USD: Often, Basic Elliott Wave Analysis Is All You Need

Watch this classic video from Elliott Wave International's Chief Currency Strategist, Jim Martens, to see how useful the basics of Elliott wave analysis can be. Jim explains how the same basic pattern that R.N. Elliott discovered back in the 1930s is often all you need to make informed market forecasts.


Then access Jim Marten's intraday and end-of-day Forex forecasts, completely free from Elliott Wave International. The independent market forecasting firm is offering free access (a $199 value) through February 10. Get your free Forex forecasts now.


Don't stop here! Get Jim Marten's intraday and end-of-day Forex forecasts FREE through February 10. Get your free Forex forecasts.


Thursday, February 4, 2010

Wave (iii) is Underway; GBP/USD Short Well on Track for More Profits


The stock market has broken down on various levels signaling that wave (ii) completed a flat correction yesterday, and now wave (iii) is underway. It would be possible that today's decline might be a B wave of a flat, if perhaps you moved waves iii and v over one wave, and that a sharp wave C rally would ensue soon. But I highly doubt this because of the massive force of the decline and the internal breakdown today which is in line with a 3rd wave, not a B wave. Momentum and internals in a B wave should be relatively flat or even, but today was decisively strong to the downside, strongly suggesting today's decline is in fact a 3rd wave.

Notice on the S&P chart attached that the market is unfolding very nicely in 5 wave drops and 3 wave rallies at various degrees, which is what the bears want to see. The S&P closed well below the previous low set last week, and is now breaking away from several trendlines that offered support in the past. Also as you can see on my chart that today's decline traced out a nice 5 wave drop as well, just adding to the evidence that a modest wave (ii) rally is complete and now wave (iii) is underway. If correct, this market should be moving down in a hurry, and it's possible there will be little-to-no let up in the process.


The attached data show the "internals" I sometimes mention. As you can see, today's data is extremely bearish, and in line with a wave 3, which aligns perfectly with what we were expecting at this time in a wave (iii). Today's NYSE stocks had 10.44 stocks close down for every 1 stock that closed up, 97% of total volume today was to the downside, and only 11 out of 498 stocks in the S&P closed up. This is some of the most astonishingly bearish stats I've seen in a very long time.


One more note on the market breakdown today is the action in the XLF, the financial sector ETF. Today the ETF closed beneath a very important $14 level I've mentioned in the past. This has been holding up the ETF since September of 2009. It has now broken down. It should get to the next level of support at $13 in a hurry, and whether it bounces hard there or treats it like a speed bump will give us a clue how powerful this downtrend in fact really is. The XLF led the stock market going up, and it should now lead going down. The XLF has a high possibility of outpacing other indices to the downside in the coming months.

With the dollar surging, it puts a ton of pressure on all commodities, such as gold (down 4.26% today) and silver (down 6.36% today), and the XLF sector breaking down, will all add to the downside pressure on equities. The stock market is extremely short term and medium term bearish at this point.


The short GBP/USD trade is tracking nicely now as I sit on a very nice profit here. I've adjusted the wave count to make it look more proportioned, but whether we follow my last count or this count, they both point to a wave 3 down and heavy selling. I want to preserve profits and lower my stop to the 1.5930 level which will lock in an additional 145 pip profit, locking in a total of 305 pips profit on the entire trade (see original trade setup by clicking here). I hope to lower my stop again in the near future.


PLEASE NOTE: THIS IS JUST AN ANALYSIS BLOG AND IN NO WAY GUARANTEES OR IMPLIES ANY PROFIT OR GAIN. THE DATA HERE IS MERELY AN EXPRESSED OPINION. TRADE AT YOUR OWN RISK.

Wednesday, February 3, 2010

S&P Close to a Top; GBP/USD Poised to Tank Hard


I know my current S&P cash count is controversial because wave ii exceeds the start of wave i which is a violation of EWP rules. However I analyze the S&P because I feel it gives a great picture of the overall stock market. So I use the S&P to illustrate the market as a whole. Well the market as a whole doesn't agree with the S&P cash this time because the S&P futures, NYSE, Nasdaq Composite, DJ Wilshire 5000 and the XLF did not make new highs with the S&P and Dow cash indices where I'm placing wave ii. So far, I think the "best look" to satisfy EWP guidelines for the entire stock market is the count I have placed above for the S&P cash index. This may change as the wave structure unfolds, but as of right now I view this count to represent the market as a whole.

With that said, today's lack of follow through on the wave C rally is encouraging for the bears as it shows this corrective rally does not have much conviction or strength behind it, so far. This can obviously change in one day, but as of right now, the rally is quite weak. C waves should be strong and powerful and should be like Monday and Tuesday's rallies most of the way through. Today's stall may just be a very small 4th wave within wave C, which means a slight new high will be made tomorrow to probably around the 1110 area at the 50% fibo level before topping and reversing. Or, today marked the high and tomorrow will be a very strong and powerful wave (iii). In support of this is the fact that most of the currency majors (GBP, AUD, EUR, CHF, CAD) opposite the dollar appear poised to tank hard, which means US dollar strength. US dollar strength should result in a strong stock market decline. This would coincide well to the stock market topping today, or after a slight burst tomorrow. So I'm on the lookout for a top and reversal any time.

My stance remains the same on the stock market in that if the market can get to the 1116 area then I will add to my shorts. If it doesn't make it there, then I'm happy with my current positions. So my only strategy right now is to sell into strength, and nothing else. Don't forget, Friday is the non-farm payroll report so late Thursday or all day Friday may bring about some extra volatility.


The GBP/USD's strong decline that lead to a break beneath 1.5902 today confirms that the rise from 1.5850 was a 3 wave move, which is a correction. It also means that there's a high probability that the 1.6069 high of the 3 wave rally will remain intact for some time, at least until 1.5850 is broken. Judging by the behavior in this pair, along with that in the AUD/USD, EUR/USD and the other majors, it appears these pairs are trading very heavy and weak, implying that the US dollar may be ready to break out hard to the upside. A dollar surge higher will cause the GBP/USD to fall hard. I'm ready for it. My stop in the GBP/USD remains at 1.6075 locking in a 160 pip profit at the moment.


PLEASE NOTE: THIS IS JUST AN ANALYSIS BLOG AND IN NO WAY GUARANTEES OR IMPLIES ANY PROFIT OR GAIN. THE DATA HERE IS MERELY AN EXPRESSED OPINION. TRADE AT YOUR OWN RISK.

GBP/USD Trade Update


The GBP/USD rallied in a clear 3 waves from the 1.5850 low. I originally labeled this rally as a 4th wave, but it's become quite long and extended in both price and time to have EWP's "right look". It hasn't violated any EWP rules so it's still possible, but I want to explore other possibilities as well. It's possible that the decline is a series of waves 1 and 2, I have them labeled as 1-2 and (1)-(2). This would be extremely bearish for the pair and lead to a strong unrelenting decline for several days at least.

With the clear 3 wave rally from 1.5850, and sharp reversal this morning, I feel comfortable lowering my stop again to lock in more profits. I lowered my stop from 1.6115 to 1.6075. If that level is broken, then most likely a larger correction is underway and I want out of the position anyway. By lowering my stop another 40 pips, it will lock in a total of 160 pips of profit at this time since my entry point as 1.6235.

The same holds true for the AUD/USD trade if anyone got on it as it rallied to the .8900 level I mentioned yesterday. A stop above the .8926 high would be in order in my opinion. I'm only going to continue to track the GBP/USD trade though, unless there's demand to track the AUD/USD trade all the way through as well.

As for the stock market, the rally is faultering a bit this morning, but so far it looks corrective. The next wave down would be a wave (iii), and it should be unmistakable when it gets underway. So a steady and slow grind lower does not get my attention to calling a top just yet. I'm still looking at the S&P 1116 area for good resistance and a chance to add to my short positions.

More on the stock market later as the price action unfolds.


PLEASE NOTE: THIS IS JUST AN ANALYSIS BLOG AND IN NO WAY GUARANTEES OR IMPLIES ANY PROFIT OR GAIN. THE DATA HERE IS MERELY AN EXPRESSED OPINION. TRADE AT YOUR OWN RISK.

Tuesday, February 2, 2010

Market Correction Underway; AUD/USD Short Trade May Be Coming


The market surged higher today suggesting a longer break from the downtrend is underway. This should not break above this year's highs. What I'm doing is looking for potential reversal points for the next wave down, which would be a wave (iii), and even more powerful and faster than wave (i), which will be impressive. If I get a good risk/reward and highly probably opportunity to add to my shorts, I'll do it. Right now I'm looking at the wave structure and that 3 wave drop to a new low I mentioned yesterday stands out. The 3 wave structure suggests it was counter trend. But it made a new low. So I'm labeling it as a "flat" correction. In this particular case, EWP states that flat corrections are ABC affairs where wave B exceeds the extreme of the most recent wave 5, then moves in a wave C to finish off the correction. Right now we are in that small wave C up. Normally in flat corrections, the C wave will rally to just above the wave A extreme before topping and reversing. This level is at 1096.45. Another potential reversal point is the previous 4th wave at 1100.22. Above that is the fibonacci 38.2% retracement at 1105.74.

With that said, even though I'm projecting a "flat" correction which means that wave C should not exceed wave A too much, I do see an open chart gap below 1116.10. This is also right next to the 50% fibonacci retracement level as well. This would probably mean that this wave (ii) rally was not a "flat", but something else. Wave 2s tend to be sharp and deep affairs, and a rally to or above 50% retracement is likely. Seeing as that an open chart gap is there makes this level even more appealing. If the market has enough strength to get to that level, I'll add to my short positions.

So initial resistance is at:

1096.45
1100.22
1105.74
1116.10

One other thing to note is that the higher risk Nasdaqs and the Russell 2000 small cap index have been outpacing the S&P and Dow to the downside, and underperforming them to the upside, especially yesterday and so far today as the Nasdaqs are almost negative as I write. The higher risk indices are lagging so far, suggesting again that risk appettite is fading and that the larger trend is now down for the foreseeable future. With the VIX at such low levels with this type of behavior, it sets up a huge and long sustained move to the downside which fits well with the wave [3] or C projection for the long term.


My GBP/USD position has now become vulnerable with the rally in equities and dollar weakness. My stop remains the same at 1.6115 which locks in a 125 pip profit. I do see a possible short trade coming in the AUD/USD. Last night it dropped sharply lower to a new low, but has since found a bid and rallied higher. As a momentum trade, if it rallies close to .8900 and shows signs of topping, I'll enter a small short position with a stop just above .8926.


PLEASE NOTE: THIS IS JUST AN ANALYSIS BLOG AND IN NO WAY GUARANTEES OR IMPLIES ANY PROFIT OR GAIN. THE DATA HERE IS MERELY AN EXPRESSED OPINION. TRADE AT YOUR OWN RISK.

Monday, February 1, 2010

GBP/USD Trade Update


With a possible decent sized stock market rally underway I want to prepare for US dollar weakness, which would lead to GBP/USD strength. Looking at the count in the attached 4hr GBP/USD chart, it shows that I can lower my stop to the extreme of wave i. If the count is correct, then 1.6110 cannot be exceeded before a new low is acheived. Because of this, I'm lowering my stop to 1.6115, down from 1.6185.

My entry for this trade was 1.6235, so by lowering my stop to 1.6115 I will lock in 120 pip profit for now.

(click here for original post for trade setup)


PLEASE NOTE: THIS IS JUST AN ANALYSIS BLOG AND IN NO WAY GUARANTEES OR IMPLIES ANY PROFIT OR GAIN. THE DATA HERE IS MERELY AN EXPRESSED OPINION. TRADE AT YOUR OWN RISK.

Market in Major Downtrend, but Short Term Bounce May be Underway


The market rallied hard out of the gate this morning and kept in line with the "bullish Mondays" behavior of the past several months. However, after the first surge in the first hour or so of trading, the market had little follow through until the last 5 minutes of the trading day, suggesting not too many folks are stampeding in to buy stocks so far. Also of note, the Nasdaqs and Russell lagged the rally today, suggesting risk appettite is still subdued. But oddly enough the VIX dropped a whopping 8% today, suggesting fear was sucked out of the market. Despite all the glaring warning signs out there, the VIX is telling us that investors are still incredibly complacent, and that this market has a long way to go on the downside before fear, and any meaningful bottom, enters the market.

As I showed over the weekend, some indices and sectors sport 5 wave drops, which means at any time we can be in for a sharp bounce. However, the trend is so strongly down at this point, I only want to be in a position to add to my short positions on signficant rallies, not play the long side. Any surprises should result in declines. With that said, looking at the S&P 5min chart, it shows a clear 3 wave drop to a new low Friday which was confirmed today when the index rallied above 1088. With 3 waves down, it means that it was countertrend, and that the current short term trend is now up. This makes it highly probable that at least 1096 will be broken before a top forms and we see more heavy selling to new lows. But I just want to emphasize that suggesting further rallying is just a guess at this point and to mentally prepare myself for further upside right now. I'm not changing any of my short positions at all at this point.

The bottom line is that the market is in a heavy downtrend and my only change in strategy would be on a sharp rally where I'd just add to my short positions. The short term structure leaves the possibility that a short term rally above at least 1096 in the S&P might be underway right now so I'm mentally prepared for that and further upside.

No change in my GBP/USD position. My stop remains at 1.6185.

PLEASE NOTE: THIS IS JUST AN ANALYSIS BLOG AND IN NO WAY GUARANTEES OR IMPLIES ANY PROFIT OR GAIN. THE DATA HERE IS MERELY AN EXPRESSED OPINION. TRADE AT YOUR OWN RISK.

StatCounter