Please note that I updated my long term S&P chart to the current cash index count on the right hand side of this blog.
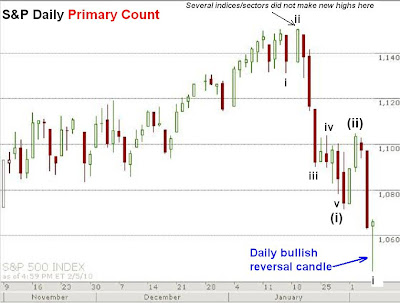
The market tanked mid-trading day and all the CNBC folks were talking about "capitulation" today, and making it a buying opportunity. I knew that probably meant that a bottom would not occur. A bottom should occur when everyone's paranoid and panicking, not when eveyone's calling a botttom. But I think that because of the steep selloff, and the quick gains the bears have made in the past several days, the shorts didn't want to hold their positions into the weekend so they covered them at the end of the day. Regardless, the rally was a small victory for the bulls. The move created a big daily reversal candlestick, reclaimed the Dow 10,000 level, the high risk Nasdaqs and XLF outperformed to the upside, and the rally late in the day unfolded in 5 waves. All-in-all, a small short term bullish victory. However I don't want to read too much into a late Friday rally, and I definitely don't want to get too cute if we're in fact in a wave (iii) decline right now in trying to pick bottoms. This market should be wild and violent throughout this major decline phase, leaving surprises constantly for everyone, although the surprises at this point should result in heavy declines. Again, despite today's late day bullish action, I remain extremely medium term bearish as I believe we're in a massive wave [3] or C decline. The short term ups and downs are of little consequence to me at this point. It's merely something I'm watching and following for the purpose of mentally preparing me for what may lie ahead, and the only change in position I'll take is to add to my short positions if a substantial rally occurs.

Looking at the short term 5min chart above you can see that the late day rally traced out a nice 5 wave rally. This means the short term trend is now up. Following a brief wave b decline, we'll get a powerful wave c up which should complete wave ii of (iii). Seeing as that this is a wave (iii) we're in right now, corrections should be very quick, and may surprise us as they may not unfold as perfectly as we'd like. So as I said before, I don't want to get too cute and take any positions based on this, I'm merely using this as something to follow and mentally prepare for. My expectation is for heavy selling with quick sharp rallies for the foreseeable future.

The XLF financial ETF also rallied in 5 waves, and much stronger percentage-wise, than the major indices, but could not recapture the $14 level today. As long as this ETF closes beneath $14, it leaves it vulnerable to a decline to $13 in a hurry, then probably much much further.

The GBP/USD short trade is tracking very nicely. With a short entry at 1.6235, and the stop sitting comfortably at a 305 pip profit at 1.5930, this trade is in great shape as it's acheived almost a 600 pip profit as of closing today, and has locked in a guaranteed 305 pip profit so far. If my above wave count is correct, this pair should be headed much lower in the coming days/weeks, with very little upward retracement. I remain firmly bearish on this pair and bullish on the US dollar.
PLEASE NOTE: THIS IS JUST AN ANALYSIS BLOG AND IN NO WAY GUARANTEES OR IMPLIES ANY PROFIT OR GAIN. THE DATA HERE IS MERELY AN EXPRESSED OPINION. TRADE AT YOUR OWN RISK.
No comments:
Post a Comment