Thursday, April 7, 2016

Elliott Wave Options Signals - Closing KORS Put Spread at 31% Profit

Elliott Wave Options Signals - KORS

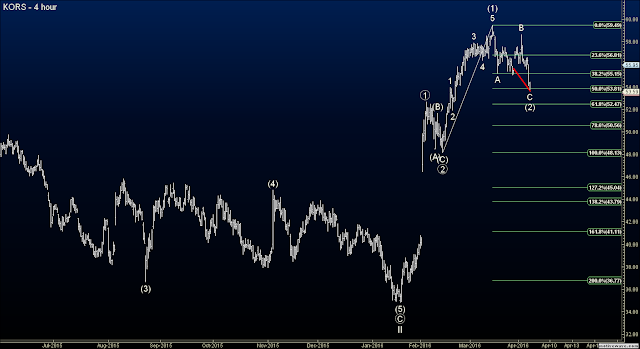
Michael Kors (KORS) had a sharp reversal after wave B completed and is now in a Minor wave C of (2).  Overall the trend in this stock is bullish so I don't want to get greedy here.  With over 4% down today, and reacing 50% Fibonacci retracement of wave (1), I'm more than happy to take a 31% profit and walk away.  Here was the trade:

Entered Put Spread at $1.65 and just closed it at $2.16.


HERE IS THE ORIGINAL TRADE SETUP:


Elliott Wave Option Signals - KORS Short

KORS has formed a short term too that should see the retailer drop to at least the $51.50 - $51.75 area before resuming its uptrend.  I placed a put spread in for this trade and here are the details:

Sell May 50 Put
Buy May 55.5 Put
Limit price of $1.65 per contract

Please support the blog and like this post :-)


PLEASE NOTE: THIS IS AN ELLIOTT WAVE BLOG EXPRESSING AN OPINION AND IN NO WAY GUARANTEES OR IMPLIES ANY PROFIT OR GAIN. TRADE AT YOUR OWN RISK.
Elliott Wave Options Signals - Closing ANF at a 27% Profit in Just a Couple of Days

ANF has declined significantly this morning and into my target zone.  It did not reach the full potential I see it reaching but it is close enough that with option positions I don't want to waste a good sharp move like this so I'm taking profits.  

I bought the put spread at $1.31 and just sold it for $1.66 for a 27% profit in just a couple days.

HERE IS THE ORIGINAL TRADE SETUP:

Elliott Wave Options Signals - ANF Put Spread

I went short Abercrombie and Fitch two days ago and it has paid off so far.  Although it has sold off two days in a row so far, I still expect a few more percentage points decline to the $29.20 area of the 38% Fibonacci retracement of wave 1.  Here is my trade from two days ago:

Buy to Open ANF May 20  27/30 Put Vertical @ $1.31

Please support the blog and like this post :-)


PLEASE NOTE: THIS IS AN ELLIOTT WAVE BLOG EXPRESSING AN OPINION AND IN NO WAY GUARANTEES OR IMPLIES ANY PROFIT OR GAIN. TRADE AT YOUR OWN RISK.

Elliott Wave Option Signals - Edison Intl. (EIX) Put Spread

Elliott Wave Option Signals - Edison Intl.

Edison International (EIX) is showing signs of a weak wave ((v)) of 5 of (3) and is now undergoing a pullback to the $66.72-$68.89 area.  This is the 23% and 38% Fibonacci retracement levels and is also the area of the previous fourth wave, wave ((iv)), so it's a good area to look to exit this short trade.  Here is my trade:

Buy to Open EIX May 20  65/72 Put Vertical @$2.74

Please support the blog and like this post :-)


PLEASE NOTE: THIS IS AN ELLIOTT WAVE BLOG EXPRESSING AN OPINION AND IN NO WAY GUARANTEES OR IMPLIES ANY PROFIT OR GAIN. TRADE AT YOUR OWN RISK.

Elliott Wave Futures Signals - S&P ES

Elliott Wave Futures Signals - S&P ES

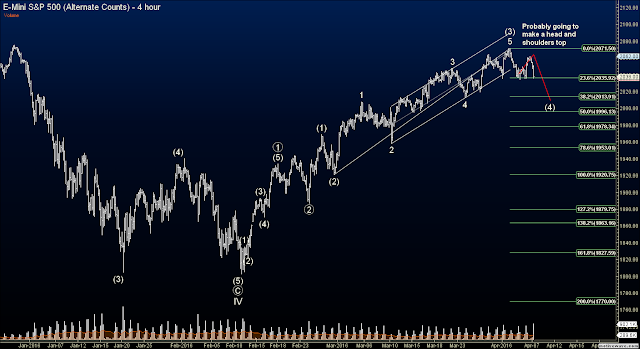
The stock market has played out as expected as the topping head and shoulders pattern is on the verge of being confirmed with a move below 2035.  The internal strength of the market has been weak for some time as my proprietary indicators shot off a high volume of sell signals with just a handful of bullish signals.  I've already cashed in on some of those bearish positions and will be looking to add more bearish stock positions as the opportunities arise.  For now, I see the S&P futures declining in wave (4) to the 1996-2014 area.  From there I will assess any bullish potential that may arise.

Please support the blog and like this post :-)


PLEASE NOTE: THIS IS AN ELLIOTT WAVE BLOG EXPRESSING AN OPINION AND IN NO WAY GUARANTEES OR IMPLIES ANY PROFIT OR GAIN. TRADE AT YOUR OWN RISK.

Elliott Wave Options Signals - Exelon Corp. (EXC) Put Spread

Elliott Wave Options Signals - Exelon Corp.

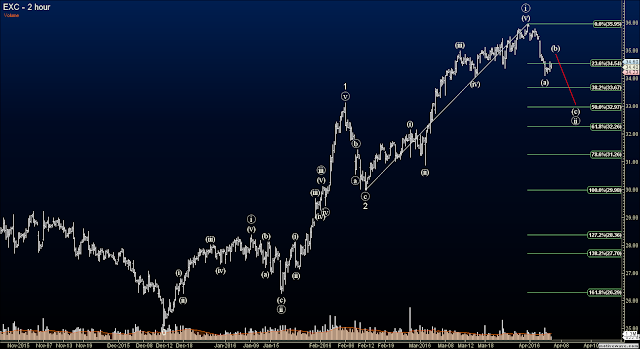
Exelon Corp. shows a very weak pattern for wave (v) of ((i)) which is similar to an ending diagonal.  This type of pattern shows a tiring of the current trend and often results in a sharp reversal.  We see the start of that strong reversal with a clean five wave decline in wave (a), and it is now in a wave (b) rally phase before a sharp impulsive move lower gets underway for wave (c) of ((iii)).  Here was my trade from two days ago:

Buy to Open EXC May 20  32/35 Put Vertical @ $1.08.

Please support the blog and like this post :-)


PLEASE NOTE: THIS IS AN ELLIOTT WAVE BLOG EXPRESSING AN OPINION AND IN NO WAY GUARANTEES OR IMPLIES ANY PROFIT OR GAIN. TRADE AT YOUR OWN RISK.

Elliott Wave Options Signals - ANF Put Spread

Elliott Wave Options Signals - ANF Put Spread

I went short Abercrombie and Fitch two days ago and it has paid off so far.  Although it has sold off two days in a row so far, I still expect a few more percentage points decline to the $29.20 area of the 38% Fibonacci retracement of wave 1.  Here is my trade from two days ago:

Buy to Open ANF May 20  27/30 Put Vertical @ $1.31

Please support the blog and like this post :-)


PLEASE NOTE: THIS IS AN ELLIOTT WAVE BLOG EXPRESSING AN OPINION AND IN NO WAY GUARANTEES OR IMPLIES ANY PROFIT OR GAIN. TRADE AT YOUR OWN RISK.

Elliott Wave Options Signals - Harmony Gold Mining (HMY) Put

Elliott Wave Options Signals - Harmony Gold Mining

Harmony Gold Mining (HMY) has reached buying capitulation as you can see from the sharp volume spike at the wave (1) high.  This thing has been on fire but as stalled significantly the past few weeks and triggered a bearish signal on my proprietary indicators.  The wave (2) correction is unfolding as a W-X-Y combination correction so I expect a move lower toward my target area of $2.80 - $3.00 quite over the next couple weeks.  Here is the trade I put on yesterday....it is trading at a better price now with a big gap up this morning but I expect that gap to be filled with a move downward quite soon.  I don't like any of the put spread options so I'm going with a small position on a straight put only:

Buy to Opoen HMY May 20  4 Put @ $0.64.

Please support the blog and like this post :-)


PLEASE NOTE: THIS IS AN ELLIOTT WAVE BLOG EXPRESSING AN OPINION AND IN NO WAY GUARANTEES OR IMPLIES ANY PROFIT OR GAIN. TRADE AT YOUR OWN RISK.


Elliott Wave Options Signals - T (AT&T) Put Spread

Elliott Wave Options Signals - AT&T

AT&T has a nice head and shoulders topping formation as you can see the left shoulder as wave (iii), the head at (v) of ((iii)), and the right shoulder at (b).  Now wave (c) of ((iv)) is underway and has hit the 23% Fibonacci level at $38.23, but it still has more selling to do.  I'm projecting  a drop to at least the 38% Fibonacci level at $37.31 for now.  Here is what I traded it at yesterday:

Buy to Open T May 20  27/39 Put Vertical at $0.72


Please support the blog and like this post :-)


PLEASE NOTE: THIS IS AN ELLIOTT WAVE BLOG EXPRESSING AN OPINION AND IN NO WAY GUARANTEES OR IMPLIES ANY PROFIT OR GAIN. TRADE AT YOUR OWN RISK.

Elliott Wave Options Signals - Closed VZ Put Spread at 35% Profit in One Day

Elliott Wave Options Signals - Closed VZ Put Spread

Well I didn't even have the chance to post the trade setup before this bad boy plummeted to near my target area.  I mentioned that I went short in a quick post, but I did not detail the chart or trade.  I still anticipate it falling further to $51.40 but when trading options I do not want to waste a sharp move in my direction that comes this close to my target.  So I closed the position at a 35% profit.  Here was the trade:

Buy to Open VZ May 20  50/55 Put Vertical @ $1.88, then sold today at $2.53

Please support the blog and like this post :-)


PLEASE NOTE: THIS IS AN ELLIOTT WAVE BLOG EXPRESSING AN OPINION AND IN NO WAY GUARANTEES OR IMPLIES ANY PROFIT OR GAIN. TRADE AT YOUR OWN RISK.
Elliott Wave Option Signals - Closed SBH Put Diagonal at 28% Profit


Elliott Wave Option Signals - Closed SBH Put Diagonal

Sally Beauty Holdings, Inc. gapped down big today towards my target.  It's close enough for me to take advantage of the big sharp drop and close my position at a nice 28% profit.  I bought the put diagonal for $2.58 and just sold it for $3.30.

HERE IS THE ORIGINAL TRADE CALL:


Elliott Wave Options Signal - SBH Put Diagonal

Sally Beauty Holdings, Inc. (SBH) has an ugly rally formation here.  After a long rally from around $22, it has pushed up in a large 3 wave move that is finishing off with ending diagonal.  This stock is ready to fall off a cliff.  Although I expect a sharp move, the most viable option strategy on this stock is a long put diagonal.  This is fine with me anyway because this stock can float and chop higher for a few more days or even a week or two before it declines.  Here is my trade:

Buy to Open SBH May 20/Jun 17 30/35 Put Diagonal @ $258

Please support the blog and like this post :-)


PLEASE NOTE: THIS IS AN ELLIOTT WAVE BLOG EXPRESSING AN OPINION AND IN NO WAY GUARANTEES OR IMPLIES ANY PROFIT OR GAIN. TRADE AT YOUR OWN RISK.
Wednesday, April 6, 2016

Elliott Wave Futures Signals - ES Forming H and H as Projected

Elliott Wave Futures Signals - ES Forming H and H as Projected

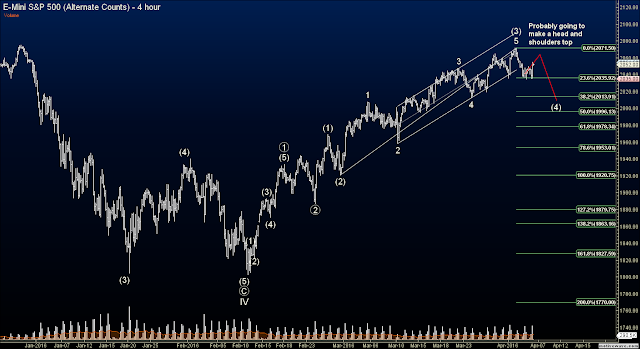
The S&P rallied today in what looks like a right shoulder in a head and shoulders topping pattern which I have see as a 4th wave correction in wave (4).  Prices should stay below 2071.50 and eventually make their way the 1996-2014.

Please support the blog and like this post :-)


PLEASE NOTE: THIS IS AN ELLIOTT WAVE BLOG EXPRESSING AN OPINION AND IN NO WAY GUARANTEES OR IMPLIES ANY PROFIT OR GAIN. TRADE AT YOUR OWN RISK.

Elliott Wave Options Signals - VZ, T, HMY, ANF, EXC

I hit short option strategies in the stocks listed in the title.  Lots of bearish signals and counts hit late yesterday and also today but I haven't had time to post the analysis of each.  I will do so later today.

Please support the blog and like this post :-)


PLEASE NOTE: THIS IS AN ELLIOTT WAVE BLOG EXPRESSING AN OPINION AND IN NO WAY GUARANTEES OR IMPLIES ANY PROFIT OR GAIN. TRADE AT YOUR OWN RISK.

Elliott Wave Forex Signals - AUDNZD Trade Hits 74 Pip Profit

Elliott Wave Forex Signals - AUDNZD Trade Hits 74 Pip Profit

The AUDNZD hit my profit target almost to the tick and then rebounded.  I feel this pair will continue lower soon but I'm happy with my 74 pip profit.

HERE IS THE ORIGINAL POST WITH THE TRADE:


Elliott Wave Forex Signals - EURNZD Short

The EUR/NZD triggered a bearish signal on my proprietary indicators and the wave count and price action suggest a pullback here.  This pair is a mess in the bigger picture, so I don't want to get too cocky with this wave count, but whether it's a small or large pullback, it should have no problem retracing 38% of wave c to around 1.6670.  Here is my trade:

Short EURNZD now at 1.6737
Stop at 1.6810
Profit Target 1.6663

Please support the blog and like this post :-)


PLEASE NOTE: THIS IS AN ELLIOTT WAVE BLOG EXPRESSING AN OPINION AND IN NO WAY GUARANTEES OR IMPLIES ANY PROFIT OR GAIN. TRADE AT YOUR OWN RISK.

Tuesday, April 5, 2016

Elliott Wave Futures Signals - ES Analysis

Elliott Wave Futures Signals - ES Analysis

I like this count better since it takes a bigger picture view of the market and makes more sense.  Here, wave 5 of (3) is complete and I'm projecting a relief rally soon as many will not be convinced the rally is over and attempt a new high.  It will fail, creating a head and shoulders top.  From there we should see a decline to the Fibonacci retracement area of 1996-2014.  I'd like it to be an ABC correction, or a combination, but 4th waves tend to be flat sideways affairs, and a boring triangle is also in the cards.  The pullback also aligns with my proprietary indicators which offer an internal look at the market and they show 132 stocks with bearish signals and only 14 with bullish signals.


Elliott Wave Futures Signals - ES Analysis 2

Here is the more detailed count I had from yesterday where I illustrated the weak price action which was confirmed by numerous momentum indicators.  The stock market has declined this morning as a result.  With wave v of (iii) complete, I have to move the "make-or-break" point of the bullish case down to the peak of wave (i) at 1969.25.  It's very far away, but if the bullish case is broken long term, I should know well before it gets to that level anyway.

Please support the blog and like this post :-)


PLEASE NOTE: THIS IS AN ELLIOTT WAVE BLOG EXPRESSING AN OPINION AND IN NO WAY GUARANTEES OR IMPLIES ANY PROFIT OR GAIN. TRADE AT YOUR OWN RISK.

Elliott Wave Options Signals - Closing LNKD Early at a 10% Profit

Elliott Wave Options Signals - Closing LNKD

I decided to close my LNKD in long call spread position a bit early because it is the only long position I have on right now, and 1 of only 2 viable long strategies in the entire stock market.  I don't like the stock market's price action, and feel it might be rolling over now.  But looking at LNKD independently, it should shoot higher to $126 before resuming its downtrend....I just don't have the patience for it at this point.

My initial trade cost $6.76 and I closed it at $7.40 for a respectable 10% profit over a couple weeks.

HERE IS THE ORIGINAL POST FOR THE TRADE:

Elliott Wave stock signal on LNKD


Linkedin fell off a cliff a few weeks ago and was met with heavy volume and at least a temporary
bottom. After correcting higher it has traversed sideways and into a buy signal on my proprietary indicators. I don't like to go into a trade just based on the signal, I need the wave count and price action to support the signal. Up until today, LNKD showed more weakness relative to the rest of the market until today where it has popped and held at a 2.5% rally. I like this price action  now and the wave count suggesting an impulsive wave C higher. from current levels

Using the Fibonacci retracement of wave (3) and the ratio analysis of wave A, I project  move to the confluence of resistance at $136-$159.  I want enter only half of my normal position size in case save B down unfolds a little further so I can add to my position at a better price later.  Here is my trade:

Buy April 29 112 Call at -$8.80
Sell April 29 132 Call at +$2.04

Please like this post :-)


PLEASE NOTE: THIS IS AN ELLIOTT WAVE BLOG EXPRESSING AN OPINION AND IN NO WAY GUARANTEES OR IMPLIES ANY PROFIT OR GAIN. TRADE AT YOUR OWN RISK.

Elliott Wave Forex Signals - EURNZD Short

Elliott Wave Forex Signals - EURNZD Short

The EUR/NZD triggered a bearish signal on my proprietary indicators and the wave count and price action suggest a pullback here.  This pair is a mess in the bigger picture, so I don't want to get too cocky with this wave count, but whether it's a small or large pullback, it should have no problem retracing 38% of wave c to around 1.6670.  Here is my trade:

Short EURNZD now at 1.6737
Stop at 1.6810
Profit Target 1.6663

Please support the blog and like this post :-)


PLEASE NOTE: THIS IS AN ELLIOTT WAVE BLOG EXPRESSING AN OPINION AND IN NO WAY GUARANTEES OR IMPLIES ANY PROFIT OR GAIN. TRADE AT YOUR OWN RISK.
Elliott Wave Options Signals - Closed WCN Spread at 39% Profit

Elliott Wave Options Signals - Closed WCN Spread at 39% Profit

WCN wasted no time shooting lower to my projected target, and beyond this morning in a strong wave ((3)).  It will probably flop around in a 4th wave for a while before continuing lower, but the easy money is already out of the stock in my view so I'm taking profits here.  I bought the May 20  60/65 put spread at $2.00 even and sold it this morning for $2.77 for a nice 39% gain in just a few days.

HERE IS THE ORIGINAL POST WITH THE TRADE SETUP:

Elliott Wave Options Signals - Short Waste Connections Inc. (WCN)

More and more stocks are hitting bearish signals and exhibiting overbought conditions which lend to my theory that my bullish wave count of the stock market is in jeopardy.  Here I see WCN hitting a wave c of (ii) down towards the $62.50 level.  This option trade is low risk, but as a result, returns would be small as well.  Here is the trade I made:

Buy to Open WCN May 20  60/65 put

Please support the blog and like this post :-)


PLEASE NOTE: THIS IS AN ELLIOTT WAVE BLOG EXPRESSING AN OPINION AND IN NO WAY GUARANTEES OR IMPLIES ANY PROFIT OR GAIN. TRADE AT YOUR OWN RISK.

Monday, April 4, 2016

Elliott Wave Futures Signals - S&P (ES)

Elliott Wave Futures Signals - S&P (ES)

The S&P continues higher as I cautiously projected and still feel there might be some more gas in the tank to hit my long awaited target of 2100.  I will not that the price action does not support my wave count well as you can see a very week price action clump over the past few weeks as noted by the light blue circles on my chart.  Not only is just visually weak, especially for what is supposed to be a wave (iii) of ((iii)), but almost all momentum indicators are showing divergence here.  At the end of a third wave at multiple degrees, momentum indicators should be showing overbought conditions which are signs of strength.  But here, we have nothing close to that.

In addition, my proprietary indicators continue to grow on the bearish side as 132 stocks have bearish signals while only 14 are bullish.  This is another sign that the stock market rally is on borrowed time.

I am not willing to get short until confirmation that the uptrend is over, or that at least a large pullback is underway.  Any breakdown of the previous swing lows will be nice to support the bearish case, which are at: 2035.25, 2019.25, 2012.25, and then the previous wave i should hold if the market is in a strong bullish move, and that's at 2008.  I remain very cautiously bullish as I await to get short the stock market, although I'm already short 6 stocks and only long 1 stock at the moment.

Please support the blog and like this post :-)


PLEASE NOTE: THIS IS AN ELLIOTT WAVE BLOG EXPRESSING AN OPINION AND IN NO WAY GUARANTEES OR IMPLIES ANY PROFIT OR GAIN. TRADE AT YOUR OWN RISK.

Elliott Wave Options Signal - SBH Put Diagonal

Elliott Wave Options Signal - SBH Put Diagonal

Sally Beauty Holdings, Inc. (SBH) has an ugly rally formation here.  After a long rally from around $22, it has pushed up in a large 3 wave move that is finishing off with ending diagonal.  This stock is ready to fall off a cliff.  Although I expect a sharp move, the most viable option strategy on this stock is a long put diagonal.  This is fine with me anyway because this stock can float and chop higher for a few more days or even a week or two before it declines.  Here is my trade:

Buy to Open SBH May 20/Jun 17 30/35 Put Diagonal @ $258

Please support the blog and like this post :-)


PLEASE NOTE: THIS IS AN ELLIOTT WAVE BLOG EXPRESSING AN OPINION AND IN NO WAY GUARANTEES OR IMPLIES ANY PROFIT OR GAIN. TRADE AT YOUR OWN RISK.

Elliott Wave Option Signals - Closed UNG Long at 31% Profit

Elliott Wave Option Signals - Closed UNG Long at 31% Profit

I closed my long UNG position this morning at a respectable profit, but nothing near the type of gain I expected.  Natural gas can really explode, and that's what I was expecting, but it just chopped and grinded higher, which didn't help my position.  I got out when I saw an over 5% rally this morning as it is close enough to the $7 target, but will probably continue higher to the $7.15 range.

I entered at $0.32 and exited at $0.42, a gain of 31%.


The UNG popped big this morning almost 4% and I definitely didn't want to get long there. It has since pulled back almost 1.5% so I got long a full call spread position as stated in my previous post:


Elliott Wave stock signals


The natural gas ETF (UNG) is really testing my trading discipline as it closed two days in a row right on the confirmation level of my proprietary indicators, and also did not close above the upper end of the trend channel.  So I'm a bit apprehensive here.  With the heavy news hitting the wires this week, and the fact that this ETF can really move fast, I want to get some exposure to a long trade here. If I like the open tomorrow morning I plan to go long with with only half of my normal position size with the following setup:

Long Call Vertical Spread:
Buy April 29 call at 6.5 cost of $0.46
Sell April 29 call at 7.5 collect $0.14

I'm looking for a move to around $7.30 which will target a 100%-165% profit on this spread.

 Principle Analysis

PLEASE NOTE: THIS IS JUST AN ELLIOTT WAVE ANALYSIS BLOG AND IN NO WAY GUARANTEES OR IMPLIES ANY PROFIT OR GAIN. THE DATA HERE IS MERELY AN EXPRESSED OPINION. TRADE AT YOUR OWN RISK.


StatCounter