This Elliott Wave blog is dedicated to sharing Fibonacci ratios and other technical analysis for forex signals, index futures signals, options signals, and stock signals. Elliott Wave Principle puts forth that people move in predictive patterns, called waves. Identify the wave counts, and you can predict the market.
Saturday, April 4, 2009
XLF Probably Continues Higher; April 4, 2009
The XLF turned into a real dog as it continues to rally yet lag most sectors and indices. When the market finally rolls over to undergo the huge correction I've been painfully calling for, the XLF will get the worst of it and collapse hard. Yet it doesn't appear ready for it yet. It rallied big a few minutes at the close right at my control point at $9.70 so I closed no XLF positions. I will cut some if it rallies strong in the morning and let the rest of my options run until expiration. The next resistance level appears to be the $10.09 area.
I will not talk about the XLF again unless something significant happens to report on. Again, more rallying Monday will cause me to reduce my XLF position and let the rest run until option expiration later in the month. If it declines sharply I'll report on it here.
Short Gold Working Well; April 4, 2009
Gold continued lower after breaking and retesting the ascending trendline as projected. It fell right down to start testing the very tough support shelf of $890. This test should occur in full force Monday or Tuesday and as I said before, it should break through that support and cascade lower next week and perhaps for weeks. My initial target is $850 but there is much much more bearish potential into the mid-$600s, so I won't exit at a market order, I will just trail my stop down and let the market take me out so I can let my profits run.
I remain fully short with a new stop at $937 with a quick trigger finger to re-enter on weakness again if stopped out.
Market Continued Higher, Still Needs Pullback; April 4, 2009
The market started down early but faught back into the positive later in the day. Again, unexpected. But this is good evidence that a substantial bottom is in at the cash S&P at 666 because of the relentless buying power and force behind this rally. But in my opinion, it's too late to get long now having it rallied so much so fast and momentum severely weakening. Folks are buying now out of fear of missing the new bull market, which we're NOT in, this is just a large bear market rally. Regardless, the best decisions I think are to go lightly short with put options so risk is well defined, or just sit out of the market and wait for it to fall so I can start establishing long positions. The larger trend is up, but momentum suggests that a major pullback is due before it's safe to get in long.
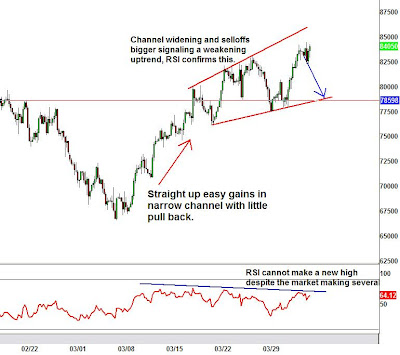
I'll post the above hr S&P futures chart until the channel is invalidated.
Thursday, April 2, 2009
Market EWP Count Uncertain, But Momentum Weak Tomorrow Should be a Big Down Day; April 2, 2009
The market rallied well above my control points and I exited half my S&P position a few minutes after the open this morning. The EWP count is unclear so I posted another chart showing the weakening stage of the market. It launched in a straight line up in the beginning, but over the past week or so it has struggled to make new highs and is looking wobbly (see above 4hr S&P futures chart). Several other indicators suggest a selloff may occur tomorrow:
1) The XLF did not make a new high today and actually sold off all day, even though all the major indices rallied to new highs.
2) The Nasdaqs were modestly weaker today.
3) The market soldoff a bit at the close today.
4) The VIX (volatility index) barely dropped today, and was actually up at one point of the trading day.
5) The RSI has not made a new high since March 18th, despite the fact that the S&P futures have rallied 30 points with 3 new significant highs during that time.
All three of the above suggest internal weakness in this rally. The first 4 above tell me that people are getting nervous on this big rally so they're staying away from the risky Tech stocks, they're buying a lot of puts as shown by the VIX, the financials have lead the market lately and they soldoff all day, and stocks soldoff at the close indicating more nervousness about holding stocks overnight especially with the jobs numbers coming out tomorrow.
With evidence of today's market action, the speed and length of this rally, and the big jobs numbers coming out tomorrow; I am bearish this market in the very short term. I will probably not add to my short position unless the market goes higher with all the same conditions occuring above still happening tomorrow, or if the market opens flat.
I'm still half short the S&P and am fully short the XLF pending a strong break of $9.70 where I'll close half.
XLF Headed Lower, Risk/Reward Outstanding; April 2, 2009
The XLF did not plummet like I projected yesterday, but after the inditial pop at the open it sold off all day. Another interesting tidbit is that it halted again underneath $9.70 resistance yet the stock market made new highs. As long as this divergence exists, and momentum indicators (RSI, MACD) keeps making lower highs, I'm immediately bearish this sector. I did not close any of my XLF position today because of the reasons I mentioned above. A strong break of $9.70 tomorrow will probably get me to close half my position and let the rest of my option position just run into expiration.
Gold Headed Lower; April 2, 2009
Gold decisively broke the ascending trendline after a typical test of the underside of it (see above 4 hour gold chart). As stated in earlier posts, by clearly breaking the trendline gold should freefall to $890. This level has led to huge rallies the last two tests of it but both times it's eaten away the bullish support there so the barrier for the bulls to break through is much thinner. $890 should be blasted through in the coming days which could lead to a cascade lower to the low $800s, and possibly the $600s!!
My new stop is $949, but will be ready to re-enter on weakness again. Gold will not undergo a significant bull rally until the $680 level is broken.
Gold Trade Still Good; April 2, 2009
Gold fell hard last night but has rallied a bit early this morning. This trade still looks good, gold should continue to fall. I remain short.
Market Rallying Too Far; April 2, 2009
Yesterday the market rallied unexpectedly after what looked like the perfect move in the morning when the futures were down so big. The market is showing strength again and I don't want to stick around with big positions I can't handle if it soars to the moon again. A break of the XLF and S&P highs will cause me to close at least half of my current positions and leave open only small hedged option positions I'm willing to go to zero. Stops are:
S&P 834
XLF $9.55 - $9.71 (depending on if the S&P broke above 834)
S&P 834
XLF $9.55 - $9.71 (depending on if the S&P broke above 834)
Tuesday, March 31, 2009
XLF Should Have Topped and be Headed Sharply Lower; March 31, 2009
The XLF showed a lot of strength today, even at the close compared to other sectors and the major indices. However I see a possible ABC three wave correction occuring today which means heavy selling should hit the sector tomorrow now that the 1st quarter portfolio jossling is out of the way. A break of the wave A high at $8.96 would confirm the 3 wave rise, but if it breaks above $8.96 beforehand, it will hurt the bearish outlook severely.
I remain short the XLF.
Gold Immediately Bearish Beneath Trendline; March 31, 2009
Gold has traded sideways for quite some time beneath the ascdending trendline that has been intact for months as seen in the 4hr chart above. As long as it holds beneath that trendline, gold is very bearish in my view and should fall off a cliff at any time to the $890 support level at minimum.
I remain short gold.
S&P Should Fall Hard Wed. and/or Thurs; March 31, 2009
With the first quarter maneuvering out of the way, the market should now continue to follow the forecast of declining into the 760 area at minimum. Today's rally was larger and stronger than expected, but it's the last day of the quarter and some maneuvering to puff up portfolios had to be tolerated. The heavy selloff into the close and continuation into the futures market afterwards to even lower levels gives strong evidence that the next decline phase to at least the 760 level is underway.
I remain short.
Monday, March 30, 2009
S&P Falls as Forecasted, More to Go; March 30, 2009
The S&P fell hard today and made a nice profit along with the XLF and gold trades. Again, with such a hard fall today I took profits to protect my capital. Momentum is headed sharply and strongly lower (see above 4hr S&P futures chart) and the internals of the market were extremely bearish as there were very little buyers at all in the market according to NYSE breadth. We might get a mild pop rally tomorrow but the next move of importance should be to the downside and I see support at the prior 4th wave and 38% fibo retracement level at 761, and the next level of support at the 743 level. Many on TV seem to site the 740 level as very important and the place to form a bottom and start buying. Because of this, I'm contrarian to this mainstream view of course and don't think that will mark the bottom. So most likely we'll see this decline end around the 760 area. But that view can change as this decline unfolds.
I'm still short the S&P through a bear put spread on the SPY.
Gold Breaking Support and Starting to Crack; March 30, 2009
Gold closed below the ascending trendline (see daily gold chart above) suggesting that the metal is about to cascade lower. It's been treading this support level, along with the $890 level, for months and once it gives way for certain, it should shoot to the $890 level in a hurry. Like I said before, the $890 level has been tested several times so the bullish support has been severely eroded already, so I would not be surprised if $890 gives way like warm butter when it's hit.
$850 is my initial gold target, but the potential is much much greater into the $650 area.
XLF Loses Over 8.5% Today, More to Come; March 30, 2009
Sunday, March 29, 2009
Financials VERY Bearish; March 29, 2009
Above is an hourly chart of the financials' ETF (XLF). The financials have been leading this market up and down for the past several months so it's good to keep an eye on it. As you can see, the ETF has risen from $5.88 to $9.71 in just 12 days which is an amazing 65% rally! This is obviously way too much too fast and after that 12 day strong 65% rally, the financials have not made a new high since the peak on March 18th, even though the stock market has made new highs. This divergence supports my position that the stock market is headed lower in the short term, and should hold true as long as the XLF does not make a new high above $9.71 first.
You can see in the chart above that the XLF's rally was basically a straight line up, but then in haulted at the $9.71 area and moved sideways, consolidating in a triangle-looking formation. According EWP, a triangle in this instance would mean it's in a 4th wave and the consolidation is just a pause in the uptrend before it thrusts higher to complete the move. Because of this, I can't rule out one more sharp rally to new highs before it reverses sharply. However, looking at the stock market and how bearish this sector looks right now, I'm far from certain this will happen. So again, I'm using put options on the XLF so I can risk whatever I want and I can just sit back and let the trade run without worrying about losing all my money if I had a straight short equity position. Using put options will allow for a sharp rally and reversal without getting stopped out and trying to get back in. Regardless, this sector looks very bearish and should fall hard, soon.
Bottom line: I'm short the XLF using naked April put options expecting a sharp decline to at least the $7.90 area, which is a 25% decline!
Gold Bearish, Needs to Break Key Support Levels Though; March 29, 2009
Above is a daily mini gold futures chart that shows that it tested the ascending trendline drawn from the $700 price area acheived back in November. Gold should break through that level Monday or Tuesday which should lead to an immediate drop to the very key and strong support level of $890. $890 has held gold up several times but with every drop to this support level the more it eats away at the bullish defenses that protect it. So when it heads to $890 this time, it should barrel right through it because bullish support should be significantly compromised by this time. That should lead to a big selloff, possibly to the $850, or much lower. Gold has the potential to cascade down into the $600s at any time so I'm not going to be quick on the trigger to take profits. I'd rather just move my stops down and let gold run lower, and let the market take me out of the trade so I don't cut my profits short. But I will take very small profits as it falls; but the majority of my position will remain intact with a stop loss backstop.
Bottom line: gold should be falling for the next week or so and the $850 area is a good target for support but the potential for it to fall much further into the $600s is also quite great.
Sharp Wave C Down Underway; March 29, 2009
If the above count on the 4hr S&P chart is correct, then the market is finishing a "flat correction". This means wave C should go just below wave A at 787 before finishing the downward move. I think a much better target is the 770 area where the prior 4th wave ended and the 38% fibonacci retracement level. However, the momentum indicators are so bearish and the volatility index is still suggesting huge swings in the market in the coming days/weeks, I wouldn't doubt the market falling much further in some other type of correction. So it may just tornado through the 770 level and head on down to the 730 level in order to releive this severely overbought condition the market is currently in. Once that occurs, the market should be on a launching pad to target the 950-1000 level so it will be a major buying opportunity as this market falls in the coming days.
Subscribe to:
Posts (Atom)