This Elliott Wave blog is dedicated to sharing Fibonacci ratios and other technical analysis for forex signals, index futures signals, options signals, and stock signals. Elliott Wave Principle puts forth that people move in predictive patterns, called waves. Identify the wave counts, and you can predict the market.
Friday, September 3, 2010
Addendum to Friday's Addendum
Okay, this should be the last post for the weekend but this is important so I wanted to point it out. The daily VIX chart shows a very good bearish setup for stocks. The VIX closed today beneath the lower bollinger band which sets up a bearish signal for stocks. Once the VIX rallies to close back above that lower bollinger band, the signal will be executed and most likely within a day or two the stock market should fall.
So despite the EWP structure not being too friendly to us in the Dow, S&P and Nasdaqs, the various other technical indicators I've mentioned here today are well positioned for a big selloff to occur next week.
Okay, I'm all done. Good bye!
PLEASE NOTE: THIS IS JUST AN ANALYSIS BLOG AND IN NO WAY GUARANTEES OR IMPLIES ANY PROFIT OR GAIN. THE DATA HERE IS MERELY AN EXPRESSED OPINION. TRADE AT YOUR OWN RISK.
Friday's Addendum
I just wanted to add some currency data to today's post I put up a few minutes ago. The euro (EUR/USD) looks poised for a top at some degree. Since I feel the larger trend is firmly down, any topping structure in the short term gets my full attention since it could lead to a major selling phase for months.
Above you can see that a possible ABC correction is unfolding with the tail end of wave C wrapping up here soon. The RSI is diverging in the 5th wave which is a typical development. Also, wave C is counting well as a complete, or soon to be complete, 5 wave move. We even have a triangle completing yesterday and that fits well with the sharp rally today as a thrust from that triangle. Although there's no significant decline yet to place risk at a top with high confidence, I thought I'd point this out since some aggressive currency traders might find use in it. I'm one of them as a matter of fact and went short at 1.2882 with a stop at 1.2945. A break above 1.2945 certainly does not negate this corrective topping structure, it just means it's extending. And I need to control risk and I think 1.2945 is where I'd want to step aside and wait for another good sign to short.
Also notice that the USD/JPY, a currency pair that often follows the stock market fairly well. Although I know other pairs now do so much better, like the AUD/JPY. But still it tends to move more-or-less in line with equities. Well here on the hourly chart you can see it is clearly not doing so and recently it did a big pop rally that was completely reversed almost immediately. This is very bearish in my view, and trading below 84.00 would be a good sign that this pair is heading quite a bit lower.
Lastly, the last post was already quite long and I didn't mention this to prevent crowding. But I thought I'd add it here to this addendum post.
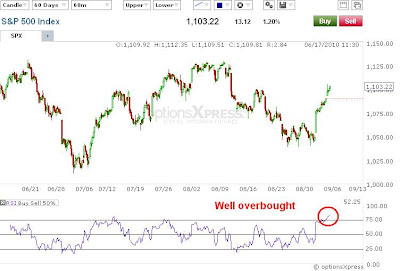
Almost all the major indices and the XLF are sporting a similar overbought indication on the RSI hourly and 2 hour charts. This is not a good timing indicator, but it sure illustrates what I said earlier about the market moving too much too fast. Here you see that the S&P's RSI is deeply overbought and is at a much higher level than where it was at during the August 9th high, yet the S&P is still almost 30 points lower. If the stock market wanted to undergo a major selloff, shooting momentum indicators to this extreme right before doing so would certainly be a high probability. This doesn't mean a major decline is coming, but if a major decline is in fact coming, then this would certainly be what you'd want to see prior to it occuring.
Have a good long weekend everyone!
PLEASE NOTE: THIS IS JUST AN ANALYSIS BLOG AND IN NO WAY GUARANTEES OR IMPLIES ANY PROFIT OR GAIN. THE DATA HERE IS MERELY AN EXPRESSED OPINION. TRADE AT YOUR OWN RISK.
The Bear Slaughter Continues
So a big gut punch to the EWP bears was issued today with the break above key resistance in the S&P at 1100.14. As I've said before, I feel that the break above that level makes the decline from early August a clear 3 wave drop. I know some folks count the decline as a 5 wave move, and they certainly can do so without violating any EWP rules, but it certainly does not have EWP's guideline for the "right look", and doesn't follow enough guidelines to give me high confidence in the count. And in my opinion, counting it as an impulsive decline is like trying to shove a round peg into a square hole. It's really just forcing the issue. An objective viewer of the structure would conclude that the move is most likely 3 waves, a correction.
So most likely this means that the S&P will now exceed 1129.24 before we can consider looking for another top. I'm not a buyer of this market at this point since it's just gone way to far too fast and feels too much like a "panic-buy". Internals are stong but more like yesterday's and not like Wednesday's. So I'm just an observer right now. It just doesn't seem like a nice smooth healthy move higher. I think if the S&P had dropped 500+ points and then the market acted this way, then perhaps I'd be a buyer. But the market hasn't really fallen that much and yet the economy and credit and employment and housing are all still weak and yet the buying frenzie is so fierce. Smells a lot like a panic rally that will soon fizzle and reverse. But we need hard evidence in the charts, not just "a feeling".
So where do we go from here? I talked a bit yesterday about how in late 2008 we had a similar choppy sideways structure with a 3 wave drop in it that eventually gave way to the big October 2008 massive selloff. That wave ii of 3 occurred August 11, 2008 and so far we currently have a top on August 9, 2010 almost two years later to the day. So it's still possible later this month and into October we could get a massive selloff as well. Another element of support for this is the action in the XLF and Russell 2000 which I discuss below.
Above you can see the daily of the Russell 2000. It looks that perhaps a leading diagonal kicked of its major selling phase and now it's declining impulsively.
The problem here is that the 590 support level has held very well over the past few months and perhaps a major double bottom was put in recently and it will be in a big rally phase now. But that has not been confirmed with any bullish evidence, mainly that means a new high needs to be established to break the downtrend and eliminate the impulsive decline implication it currently has.
The impulsive implications I'm talking about are shown above. You have a clear 5 wave impulsive decline from 672.16 with a sharp bounce off support at 588.58. However notice that this 5 wave decline followed a 3 wave rally that started at 587.67. So the Russell rallied in 3 waves from 587.67 and then declined in 5 waves and did not make a new low beneath 587.67. A 5 wave move down that doesn't make a new low almost always means the larger trend is STILL down. So this would suggest that the recent high at 672.16 will hold and that at least one more new low beneath 587.67 will occur in the near future.
Looking at the XLF we have a similar picture. The financial sector appears to be decline impulsively and the current rally is simply a small wave ii that will top before making a new high and rollover soon. However unlike the S&P and Russell, the XLF's key support is being severely eroded at $14. We've had quite a few breaks beneath that $14 level to make it less and less significant to where very little support is holding it up anymore. It won't be able to withstand many more blasts down at that level before it finally completely caves in and gives way. Here we can say that $15.09 should hold since that's the start of the most recent 5 wave drop.
So what does all this mean and what do I do? Good question, I'm glad you asked, and I'll be pondering this more in depth as I float around in the pool and sob in my beer this long weekend. The bottom line is that in the bigger picture, this market and our economy just look broken. The toxic assets, over-optimism and excesses in our economy have not been fully flushed out yet. Until that occurs, I cannot comfortably sit on a long term bullish position, nor buy individual stocks for the long run. Looking at the technical picture above of the S&P I see a market that is topping and on the verge of a big swoosh lower, and I see that the 1040 level's stand against the bears will eventually give way. Unfortunately it's not making it easy for elliotwavers in the short term structure because of the way it's unfolding lately.
I can easily see the S&P breaking out to a new high above 1130 while perhaps the Russell 2000 and the XLF do not. The evidence from an EWP standpoint for those two to hold their recent highs is still compelling. So I'd still feel comfortable shorting the XLF and/or the Russell with stops above the key levels I cited above. The Russell 2000 can be shorted through it's ETF (IWM), or with an inverse fund that shorts it 1 for 1 (RWM) or double (TWM). I would still hold long term shorts though. This market and our economy look broken, and I see little upside potential in the years ahead, but major downside risk in the years ahead. In the short term I'm neutral the S&P and will look to establish a short or long position in the short term as soon as I get higher confidence of direction in the foreseeable future.
PLEASE NOTE: THIS IS JUST AN ANALYSIS BLOG AND IN NO WAY GUARANTEES OR IMPLIES ANY PROFIT OR GAIN. THE DATA HERE IS MERELY AN EXPRESSED OPINION. TRADE AT YOUR OWN RISK.
Thursday, September 2, 2010
Taking a Step Back.......Looking at the Bigger Picture
The market was relatively flat most of the day but the Nasdaqs and even the S&P did have a slight upside bias to it while the Dow struggled in and out of positive territory. A few weeks ago when the market was topping, the Dow was exceeding the Nasdaqs, most likely because people were rushing into "safer" blue chip stocks and out of higher risk tech stocks since people were getting a little nervous, a behavior typical in tops. The result was a 3 week selloff in the recent lows. Now the opposite is happening. The Dow is struggling while the Nasdaqs are much stronger in comparison. So folks are dumping their boring blue chip Dow stocks and rushing into the higher risk Nasdaq stocks, a behavior typical around bottoms. And when you combine this with yesterday's strong move on solid volume and very strong internals, the foundation is definitely set for a significant bottom to be in place.
Today's internals were modestly weaker than yesterday's but still very strong overall nonetheless. Yesterday we had about 85% of NYSE stocks close higher while today we had only 68%; yesterday we had 96% of volume to the upside while today we had only 83%, and only 6 S&P 500 stocks closed lower yesterday while 67 did today. Also volume yesterday sat at 1.19 billion shares on the NSYE and today was only 960 million shares. So today was still a strong day, but it lagged yesterday's numbers which is typical of a 3rd and 5th wave sequence which I think it is (see my last post of the intraday wave count). Also, as shown in my midday update today, the intraday RSI (and other momentum indicators) is showing a bearish divergence to the new price highs today compared to yesterday's.
So the key level for the bearish case as far as EWP is concerned is just a few S&P points away at 1100.14. It's quite possible the 5 wave monster rally we've seen this week is part of a wave C of ii. If this is correct though, the market has little room for more rallying and should rollover in a fierce decline very soon. Tomorrow is the Non-Farm Payroll jobs number which can easily provide fuel for a big move. For the EWP bears, shooting lower sooner rather than later would be a very welcomed move at this point.
Above is daily chart of the wave iii of 3 of (1) that occurred back in late 2008. (For a bigger picture look at this entire count, check out my "Long Term Daily S&P Cash Chart" on the right side of the blog). You'll notice that at the beginning of this wave iii of 3 of (1) that it was far from impulsive-looking, and there is in fact at least one 3 wave drop (see squared off section in chart above) to which its high was not exceeded and yet it still resulted in a major declining phase shortly after. The up/down churn sideways-to-down lasted for quite a while until finally the bottom fell out from under the market big money was made for the bears' trouble of waiting it out.
The reason I'm showing this is because you might notice a similarity in the structure back then, and what might be forming right now. Both were on the verge of major declines, both started off with a choppy sideways grind, and if 1100.14 is exceeded the current structure might also have a 3 wave decline prior to a massive selloff. What's also interesting is that the top of wave ii of 3 of (1) occurred August 11, 2008 and the current top of wave (ii) occurred August 9, 2010, just two days apart.
So there are definitely similarities between the current structure leading up to today's action with the action of late 2008 that led to a massive decline. So just because 1100.14 might get broken soon doesn't necessarily eliminate the call for a major selloff. It just complicates things a bit, and makes trading it bearishly with high confidence from an EWP standpoint quite a bit more challenging. If that level is broken I'll lay the possibilities moving forward.
Another thing to consider if 1100.14 gets broken on the S&P is that even though it declined in an apparent 3 waves from the August 9th high, the Russell 2000 did not. And in fact, the Russell actually started its decline a couple weeks earlier on July 27th. So the Russell has plenty more room to run to eliminate its short term bearish potential.
The financials are in the same boat as the Russell 2000. It too started its decline earlier than the S&P, August 2nd, and it also sports a nice 5 wave impulsive-looking decline from that high. So it also has much further it can rally before the short term bearish case is eliminated.
SUMMARY: so even if 1100.14 in the S&P is broken soon, it does not completely eliminate the possible extraordinarily bearish longer term outlook (just look at late 2008). But exceeding 1100.14 will in fact damage the shorter term EWP bearish case and bring less confidence to the immediate bearish outlook than it would if it remained beneath it. If volume spikes higher and internals strengthen similar to what occurred on Wednesday's rally, then I'd consider getting long on a break above 1100.14 for the short term trade at least. Aside from that, a break above 1100.14 would just turn me short term neutral the market for the time being.
PLEASE NOTE: THIS IS JUST AN ANALYSIS BLOG AND IN NO WAY GUARANTEES OR IMPLIES ANY PROFIT OR GAIN. THE DATA HERE IS MERELY AN EXPRESSED OPINION. TRADE AT YOUR OWN RISK.
Market Topping Out; at Least in the Very Short Term
The market has completed a 5 wave rally with the 5th wave completing early this morning, or will do so later today. This is supported by the RSI divergence on the 15 minute chart which is typical of 5th waves. This suggests a top is at hand and the market will pull back AT LEAST in the short term. The first target is around the prior 4th wave extreme at 1076, but a much further decline would be welcomed. So aggressive short term traders might consider gearing up for a decline soon.
As I said yesterday, no follow-through, or an outright reversal of yesterday's big rally would be very bearish. So a sharp selloff would be a nice surprise for the bears. But all is not supportive of this: the Nasdaqs, financials and the small cap Russell 2000 are all much stronger than the blue chip Dow. This suggests that people are ignoring, or leaving, the safe blue chips and rushing into the high risk assets. So risk appettite is high today. This is supportive of a bullish move, not a top.
But for short term traders, I see opportunity to short soon since the EWP structure looks toppish.
PLEASE NOTE: THIS IS JUST AN ANALYSIS BLOG AND IN NO WAY GUARANTEES OR IMPLIES ANY PROFIT OR GAIN. THE DATA HERE IS MERELY AN EXPRESSED OPINION. TRADE AT YOUR OWN RISK.
Wednesday, September 1, 2010
Quite a Rally Today
Well, I guess people wanted to buy stocks today. The rally was a complete surprise to me. I figured a few minor short term speed bumps here and there the next few days but the ultimate net result would be lower levels with new lows. I was wrong. Today was a short-covering rally in my opinion, and many bulls on the sidelines jumped in and piggy-backed on that momentum.
Today's move was monstrously strong, with internals registering very strong numbers. About 85% of NYSE stocks closed higher, 96% of volume was to the upside, and only 6 S&P 500 stocks closed lower today. And volume spiked higher today well exceeding the 1 billion share mark. Now this is still low volume overall, but it's quite high compared to what volume we've been seeing the past few weeks.
In addition, the euro broke above the start of my projected 5 wave decline I labeled yesterday which invalidated the short term bearish scenario. So I'm waiting for signs of a top again to re-enter short. Also, the XLF managed to close above $14 today, but it on track to perhaps make a charge toward the $15 area if the stock market rally continues. However, the XLF's decline from $15.09 looks clearly like an impulsive 5 wave decline, so the rally today could easily just be a correction of that 5 wave decline. And seeing as the start of that 5 wave decline is over 7% higher from current levels, it will be tough for the XLF break its downtrend.
The bottom line is that this is the type of behavior and strength we often see in the market when major lows are put in. If so, I expect this market to continue to shoot higher in the coming days. If the rally faulters tomorrow and the coming days, then it would be very bearish. 1100.14 remains key for the bears.
Above you can see the importance of 1100.14 from an EWP perspective. From the 1129.24 high there are a clear 3 waves down. Now that can easily subdivide into a five wave decline since every 5 wave impulsive decline starts with a 3 wave move. But a break above 1100.14 would make that all but impossible. Trading above 1100.14 would make the decline very likely to be a 3 wave corrective drop. It's possible it could be a very elongated flat correction, but that is unlikely and therefore not something I'd trade based on. This means that most likely the market will continue higher if 1100.14 is taken out.
I don't want to get too complicated or overthink this since the market is just 20 points away from the line in the sand at 1100.14. If the market can remain below that level, the odds are high that the larger trend is down and I'd be looking for more shorting opportunities. But a break above 1100.14 would cast serious doubt at the bearish case and would call for a restructuring of wave counts that would most likely lead to the pulling back of the aggressively bearish stance to a more neutral stance until things clear up. Exiting short posiitions at 1100.14 is a way to preserve capital and re-strategize. I can easily just re-enter whenever I think things clear up. But shorting and holding indiefinitely is not how I trade.
PLEASE NOTE: THIS IS JUST AN ANALYSIS BLOG AND IN NO WAY GUARANTEES OR IMPLIES ANY PROFIT OR GAIN. THE DATA HERE IS MERELY AN EXPRESSED OPINION. TRADE AT YOUR OWN RISK.
Tuesday, August 31, 2010
Long/Medium Term is Clearly Bearish, but Short Term "Interference" MAY Delay the Downtrend
Today's internals were much more positive than what it looks like when just viewing the closing numbers on the major indices. The internals were not robustly strong by any means, but looking at the final numbers I would have expected a much higher close in the markets.
Today was the last trading day of August and so there was a lot of maneuvering around and positioning, along with a big spike in volume. There are numerous economic reports coming out the rest of the week, to include China's PMI tonight at 9pm (EST), that could swing the market around in the short term. Plus, the beginning of September should not only bring about some swings in itself for being a new month, but a lot of traders and investors will be coming back from summer breaks so volume should steadily start entering the market.
So with all said and done, the next week or so could get a bit wild. But the longer term remains clear, the market is declining impulsively and the majority of evidence suggest the path of least resistance remains to the downside.
The bulls are fighting ferociously to protect the 1040 level they feel is important as you can see from the above chart. It looks quite clear that their attempts to keep this level will ultimately fail. And the wave count certainly supports that outcome as well.
Very aggressive shorts can establish new positions with stops just above 1055.14, or keep them just above 1065.21, depending on risk tolerance. I feel that longer term bears should keep their stops just above 1100.14 at least until 5 waves down on a larger scale can be counted complete.
Above is a montly chart of the financials ETF (XLF). It shows that it made a new high in August compared to July, and then closed beneath the open in July. The last few times anything like this, or similar to this, has occurred recently it has led to hard selling the following months as you can see from the above chart.
The XLF is also trading below the key $14 level that it has been held up at for several months. And this month's close below $14 is only the second time it's done so since July of 2009. Once the $14 level fully gives way, there's not much holding it up for a long way down. It will be very difficult for the stock market to hold up in this current economic environment and mood, especially if financials start breaking down.
Lastly, the above 30min chart of the euro suggests that the downtrend has resumed and that today's sharp rally was just a 3 wave correction that will soon be completely reversed. If the euro is starting to collapse again, it means the US dollar should surge higher which would be more downward pressure on the stock market. So although there may be short term pops in the market here and there, the headwinds for equities remains strong. The above euro count remains valid as long as 1.2779 remains intact.
PLEASE NOTE: THIS IS JUST AN ANALYSIS BLOG AND IN NO WAY GUARANTEES OR IMPLIES ANY PROFIT OR GAIN. THE DATA HERE IS MERELY AN EXPRESSED OPINION. TRADE AT YOUR OWN RISK.
Monday, August 30, 2010
With an ABC Rally Possibly Completing wave ii, the Downside Potential from here is Quite LARGE
The stock market continued lower much like the USD/JPY and EUR/USD did early this morning in the US session. All indices dragged lower into the close with the higher risk small caps (Russell 2000) and Nasdaqs leading the grind lower by surpassing the blue chip indices' losses on the day. It's quite possible that wave ii of (iii) is complete and the market is now in wave iii of (iii) of 3 of [3] or C. Of course this means relentless selling well below the 1010 level and into the 900s very quickly.
As an aggressive trader, I think it would be a logical trade to be short at current levels with stops just above Friday's highs from an EWP perspective. The only other viable alternative right now to the current count I have shown above is that wave ii is extending into a combination correction, and that today's decline was an X wave that will lead to another 3 wave ABC rally. A break above Friday's highs would put that alternate as a top count.
So remaining aggressively short as long as the market stays beneath Friday's highs seems like a great risk/reward trade since losses can be well managed and the profit potential from a wave iii of (iii) would be quite large.
Although I don't think the X wave scenario is as likely as the bearish wave count I posted at the top of this post, it still is a possibility as long as Friday's lows remain intact (1039.70 S&P). One reason I don't like the X wave scenario is because today's decline is quite impulsive-looking, and not characteristic of a typical choppy 3 wave move that an X wave usually is composed of.
But the one problem the bears have with today's action is the volume we saw today. Coming in at only 817 million shares on the NYSE, it's an extremely light volume day, and that in fact does correspond well to an X wave. If we are in a wave iii of (iii), I would expect volume to have picked up today and spiked into the 1 billion range somewhere.
So although the prefered bearish count above is my top choice and offers the best risk/reward in my view, I think it's important to remain honest in the market and understand that it's possible today's decline was part of an X wave. So keeping risk managed well with stops above Friday's highs would be wise in my view. Breaking below Friday's lows (1039.70 in the S&P) would take the X wave off the table.
Below is a chart illustrating the alternate X wave count mentioned:
PLEASE NOTE: THIS IS JUST AN ANALYSIS BLOG AND IN NO WAY GUARANTEES OR IMPLIES ANY PROFIT OR GAIN. THE DATA HERE IS MERELY AN EXPRESSED OPINION. TRADE AT YOUR OWN RISK.
An Flat Correction is Complete
The S&P wave ii correction has unfolded as a "flat correction" and might have finished up its high on Friday. If the wave ii correction doesn't subdivide into a more complex correction, it means more heavy selling in the immediate future.
Above you can see that currencies tied to risk appettite apear to have topped and are resuming their downtrend as both the EUR/USD and USD/JPY are falling hard and in an impulsive manner. If you remember a few weeks ago I mentioned that the EUR/USD topped about a day earlier than the stock market topped. So if currencies are leading the stock market again, it means the stock market should have heavy selling in the very near future since the currency risk trade appears to be breaking down.
PLEASE NOTE: THIS IS JUST AN ANALYSIS BLOG AND IN NO WAY GUARANTEES OR IMPLIES ANY PROFIT OR GAIN. THE DATA HERE IS MERELY AN EXPRESSED OPINION. TRADE AT YOUR OWN RISK.
Subscribe to:
Posts (Atom)