Saturday, March 27, 2010

Keeping Lower Highs is Key to a Top Being in


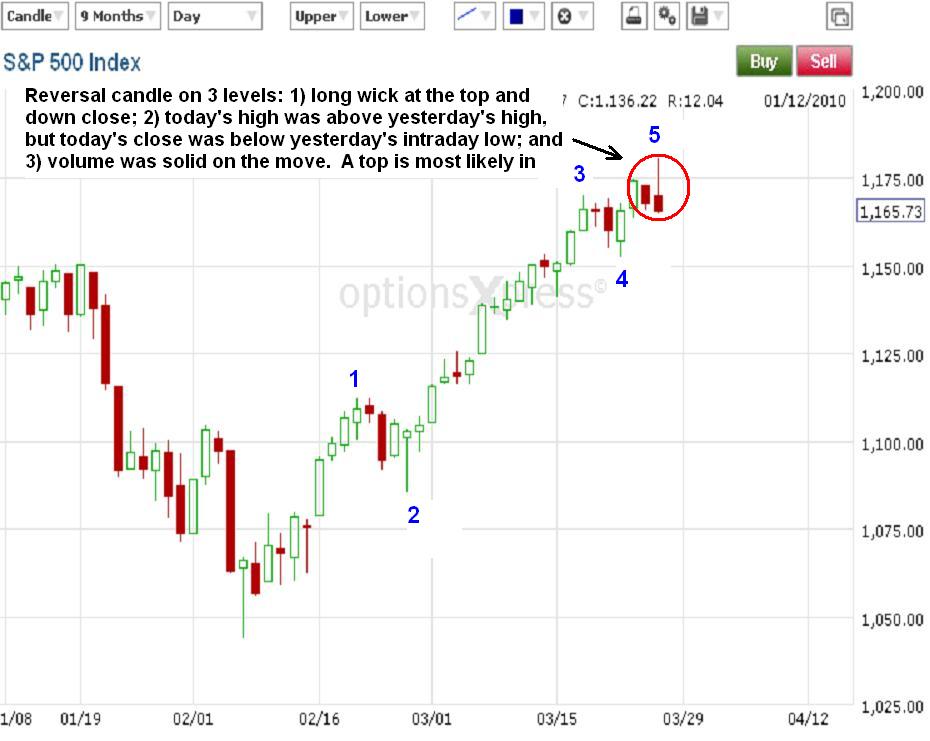
The market didn't continue it's decline from the current top on Friday, but instead tried to rally again. But it could not make a new swing high (at least down to the 15min chart) and reversed in similar fashion to what it did on Thursday. Notice that 1175 in the S&P has created some problems for the bulls as it's rejected them Wednesday, Thursday and Friday. This level appears to have some importance so I'm going to watch it carefully. On the above daily chart you can see a 5 wave count possibly complete right now. So at least a correction, if not an all out sell off, should be in the cards in the very near future if it's not underway right now. Keep in mind that Mondays have often been notoriously bullish the past few months, and that we'll also be in end of the month/quarter trading early next week so a lot of josseling around and positioning will occur. Normally this all results in bullish action, but I trade based on the charts, not on what usually happens.


15min S&P Cash Index


The above S&P 15min chart shows a possible downtrend forming with lower highs and lower lows. It's simple, as long as lower highs and lows keep occuring, the trend is down. I'll simply lower my stops just above the previous swing high, which in this case is currently at 1173.93, until either I get stopped out or a 5 wave impulsive decline forms. If an impulsive decline forms I'll adjust risk accordingly. I'll explain how I do that when the time comes. But for now, I simply have a short position in place to stop out at 1174, and will continue to lower my stop with each new swing high created. If I am stopped out, that's fine, I'll simply wait for another toppish structure to form and repeat the process.

The structure and strength of the decline will tell me more about the larger trend. But right that trend is quite questionable, so I'm playing only the short term moves at the moment.


PLEASE NOTE: THIS IS JUST AN ANALYSIS BLOG AND IN NO WAY GUARANTEES OR IMPLIES ANY PROFIT OR GAIN. THE DATA HERE IS MERELY AN EXPRESSED OPINION. TRADE AT YOUR OWN RISK.

Thursday, March 25, 2010

A Top is Most Likely in


I was wrong yesterday in thinking a new downtrend started then as today's early pop right out of the gate this morning knocked that theory right out of the water. But that happiness and jubilence did not carry into the close as we had a big reversal day across the board. The daily S&P chart shows a completed 5 wave rally on the board, and today made a bearish reversal candlestick with that long wick at the top, today's intraday high exceeded yesterday's high but today reversal led to a close beneath yesterday's intraday low. Rallying to a new intraday high then reversing to close to beneath the prior day's intraday low is very bearish. In addition, the move was done on solid volume. So a top is likely in the stock market. The magnitude of that top is yet to be seen. But the strength and structure of the decline should help make that determination in the coming days.


Lastly, the above 3min S&P chart shows that it declined impulsively from the top in what's either a 1 and 2 wave completed where we're now in wave 3; or an A and B completed with us in wave C right now. The impulsive decline combined with the evidence mentioned above strengthen the case for at least a short term top in right now.


PLEASE NOTE: THIS IS JUST AN ANALYSIS BLOG AND IN NO WAY GUARANTEES OR IMPLIES ANY PROFIT OR GAIN. THE DATA HERE IS MERELY AN EXPRESSED OPINION. TRADE AT YOUR OWN RISK.

Wednesday, March 24, 2010

Fragile Downtrend Formed on Small Timeframe; EUR/USD Declined in Big Impulse Wave

S&P Cash Index Daily


Since making new highs on the year in all the major indices I'm not certain what the bigger picture wave count is so I don't want to label all the bigger picture waves just yet. So I'm keeping my scope quite small and looking for just the basics, i.e. 5 waves and 3 waves, momentum, and trends. With that in mind you can see on the S&P daily chart above that a 5 wave rally is in its final stages. And in typical EWP fashion, the 5th wave we're currently in is being completed with momentum diverging. Notice the MACD histogram below has been declining, illustrating that the moving averages have been tightening and starting to get close to crossing down, even though price has continued to rise. This divergence is typical in 5th waves so it helps add confidence to this wave count. Although the averages have not crossed down yet, which would be illustrated with a blue bar on the underside of the histogram, the rolling over on the daily chart is certainly a sign of an impending decline that should have us look more closely at the shorter term picture. Once this 5th wave rally in price completes, we'll have at least a correction of that rally, if not an outright major top and reversal of larger trend. I want to be positioned for declines at this point, and any bullish action or evidence would only make me become neutral.


S&P Cash Index 10 Minute


The above short term S&P chart shows a simple and basic look at a downtrend starting. There's a series of lower highs and lower lows. On a very short term basis, as long as the series of lower highs continues, then I'm short term bearish. The reason is that I've been expecting a top for some time now, and so any signs of a trend reversal has my attention. The series of lower highs and lows is the first hint of a top. Now we don't have an impulsive 5 waves down yet, so if a higher high develops soon then it will make a choppy overlapping decline that is most likely a correction and new highs are just around the corner. So I want to get out of the way if a higher high forms. So I'm short term bearish as long as the sequence of lower highs remains intact, and until a 5 wave decline develops. If the market rallies to a higher high then I'll simply step aside and wait again for another sign of a potential downtrend to come about.


EUR/USD Nice and Clean 5 Wave Drop


If back in October 2009 someone told me that by March 2010 the EUR/USD will have fallen almost 2000 pips and the S&P would not be down at all, but actually be up 70 points, I'd laugh my butt off. But that's exactly what has happened. Never did I think the stock market would be able to hold up, let alone rally, with a euro decline and dollar rally of this magnitude. Either the stock market is just delaying its crash or it's marching to the beat of its own drum. We'll have to wait and see on that one. But what's clear from the daily EUR/USD chart above is that this pair has traced out 5 wave down from the highs, and probably won't make a new low beneath my projected big red wave 3 at the bottom left of the chart. Because of that, it means that not only is the long term trend down for this pair, but this almost 2000 pip 5 wave decline is probably just a wave 1 in a larger 5 wave decline. That's big. Will the dollar get to parity with the euro? It will probably be close if this count is correct. Regardless, it sure has been an interesting and fun ride trading this thing down in-and-out over the past several months. And although EWP hasn't been too kind to our stock market positions, it has been very kind to our EUR/USD, and sometimes GBP/USD, trades.


PLEASE NOTE: THIS IS JUST AN ANALYSIS BLOG AND IN NO WAY GUARANTEES OR IMPLIES ANY PROFIT OR GAIN. THE DATA HERE IS MERELY AN EXPRESSED OPINION. TRADE AT YOUR OWN RISK.

Tuesday, March 23, 2010

Market Extends Higher, Looks Like a 5th Wave


I know many people would like to punch me in the face after I say that the market is finishing up it's rally since I've been saying that for about the last 100 S&P points to the upside. Trust me, I feel your frustration and my account has paid for it. I have been stumped on this rally more than any other in my stock trading career. This thing has seemed so overextended for so long but continues to float higher on practically no volume. Today there was less than 1 billion shares traded on the NYSE and the Dow pushes up 100 points, and momentum indicators continue to drag. But the market is always right, so with today's new highs across the board now I have to sit and wait for the next opportunity to get short on signs of a top. Right now I see no reason to get short right now as the market is still showing signs of strength, but getting long this late in the rally seems too risky. Once evidence of a top comes forth again, I'll mention it here as soon as I can and mention opportunities I think are worth taking. Above is a daily chart of the S&P that shows a simple 5 wave rally occuring, with us currently in the 5th and final wave of the rise. The rise can extend and be attracted to the 1200 resistance level, but there's no guarantee. My strategy now is to stand aside and wait for the market to present an opportunity. Unfortunately, right now I see none.


S&P 500 Cash Index 15min


Above is just a closeup of what the declining structure turned out to be; just a WXY double zig-zag correction. I think it's too early to start labeling the current rally from the wave Y low, but hopefully as the structure continues to unfold I'll have more certainty in the smaller waves so we can get a better idea of where to start looking for a top again.

Sorry I don't have more to say. But the last thing I want to do is impose my goals or needs onto the market, or take my frustration out on my account by losing trading discipline. So I just continue to play a lot of XBOX360 and watch every old movie in the book to keep my mind off the frustration I feel towards the markets so I can stay on track and remain focused on my trading plan and overall strategy.


PLEASE NOTE: THIS IS JUST AN ANALYSIS BLOG AND IN NO WAY GUARANTEES OR IMPLIES ANY PROFIT OR GAIN. THE DATA HERE IS MERELY AN EXPRESSED OPINION. TRADE AT YOUR OWN RISK.

Monday, March 22, 2010

Nasdaqs Make New Highs, Russell Declined in 5 Waves; so Who's Leading the Market?

S&P Cash Bearish


Above is a continuation of the count I posted Sunday. If the larger trend has turned down, then this is one of the ugliest and most pathetic impulse waves I've seen in a long long time. This ugly structure, along with the fact that the Nasdaqs made new highs, prevent me from being very confident in the bearish short term outlook. The Nasdaqs making new highs today most likely means they're leading the market, and will pull the other indices to new highs as well, which is what Tech usually does. But as long as the Dow and S&P remain below their highs on the year, the bears have a great risk/reward opportunity to get positioned with tight stops, and there's plenty of evidence to the bearish side anyway. One reason it may be worth while other than the possible 5 wave down S&P count shown above, is the behavior in the Russell 2000.


Russell 2000


The high risk indices, like the Nasdaqs, tend to lead the overall market. Even though the Nasdaqs made new highs, the Russell 2000 did not, and it declined in a much more probable impulsive move last week. So are the Nasdaqs leading the market higher, or is the Russell leading the market lower? Unfortunately I have no idea, but the evidence of an overextended rally and limited upside for the bulls tell me that I should be looking for opportunities to get short when I see them.


S&P Cash Bullish


Lastly, I wanted to show the bullish count. This accounts for the declining structure much better than the impulsive decline in my view. But the other evidence of an exhausted rally is just too overwhelming for me to disregard all that and get long at this point. So I'm opting to let the market decide for me. As long as the both the Dow and S&P remain below their highs for the year, then I'm bearish. A break above those highs will again have me stand aside looking for another opportunity to get short for the short term. The larger trend outlook at this point is inconclusive.


PLEASE NOTE: THIS IS JUST AN ANALYSIS BLOG AND IN NO WAY GUARANTEES OR IMPLIES ANY PROFIT OR GAIN. THE DATA HERE IS MERELY AN EXPRESSED OPINION. TRADE AT YOUR OWN RISK.

Sunday, March 21, 2010

S&P Bigger Picture Still Unclear, but Short Term Picture Suggests Further Weakness


Sorry for the late and brief post; it's been a very busy weekend and I'm barely able to squeeze this in but I think we're at an important juncture and I'd like to chime in with my core thoughts.

The S&P is not unfolding very impulsive-looking since the top. But I can label it as such with a little "maneuvering" without breaking an EWP rules. Because of its imperfect structure, I can't say with any certianty that a major top is in. But the fact that the Dow and Nasdaq 100 made new highs on the year while the S&P and Nasdaq Composite did not, make me thing the overall market is very exhausted and that a larger decline is warranted before we even think about getting bullish. Not to mention all the momentum extremes reached, and the divergences lasting several days that also lend themselves to the short term bearish case.

So I see the stock market in a near term decline phase that MAY develop into a long term decline phase. But we'll have to wait and let this market unfold further to get a better opinion of the longer term view. One "X factor" is the Health Care vote here in the US. I'm not a fundamental or news guy, but I can't help but think that with the passage of socialized medicine in the US, the global capital of capitalism will not be so capitalist anymore. And that may somehow have a negative effect on our stock market. So perhaps that will add a little fuel to the bears' fire. This isn't my specialized area so this is merely an educated guess.

More tomorrow...


PLEASE NOTE: THIS IS JUST AN ANALYSIS BLOG AND IN NO WAY GUARANTEES OR IMPLIES ANY PROFIT OR GAIN. THE DATA HERE IS MERELY AN EXPRESSED OPINION. TRADE AT YOUR OWN RISK.

StatCounter