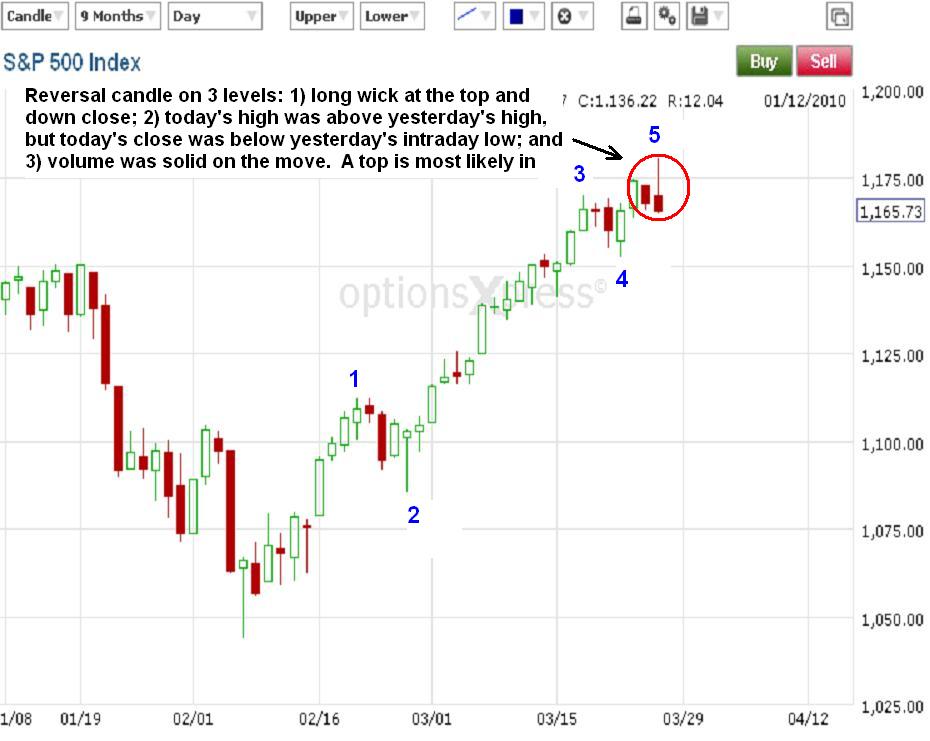
I was wrong yesterday in thinking a new downtrend started then as today's early pop right out of the gate this morning knocked that theory right out of the water. But that happiness and jubilence did not carry into the close as we had a big reversal day across the board. The daily S&P chart shows a completed 5 wave rally on the board, and today made a bearish reversal candlestick with that long wick at the top, today's intraday high exceeded yesterday's high but today reversal led to a close beneath yesterday's intraday low. Rallying to a new intraday high then reversing to close to beneath the prior day's intraday low is very bearish. In addition, the move was done on solid volume. So a top is likely in the stock market. The magnitude of that top is yet to be seen. But the strength and structure of the decline should help make that determination in the coming days.

Lastly, the above 3min S&P chart shows that it declined impulsively from the top in what's either a 1 and 2 wave completed where we're now in wave 3; or an A and B completed with us in wave C right now. The impulsive decline combined with the evidence mentioned above strengthen the case for at least a short term top in right now.
PLEASE NOTE: THIS IS JUST AN ANALYSIS BLOG AND IN NO WAY GUARANTEES OR IMPLIES ANY PROFIT OR GAIN. THE DATA HERE IS MERELY AN EXPRESSED OPINION. TRADE AT YOUR OWN RISK.

1 comment:
AAPL and NASDAQ also had outside days and closed down. AAPL volume was not heavy but is is the market leader.
JD in FL
Post a Comment