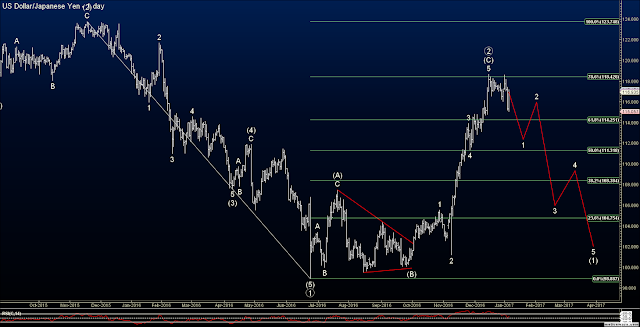
In looking at my forex workspace, I note a good longer term opportunity with shorting the USDJPY. Notice that price has rallied sharply the last few months and has triggered my custom indicator to print some magenta bearish paint bars in the middle of the rally. These paint bars usually indicate when a currency has moved too far too fast, and so at least a short term pause or pull back is in order. However, you can see that the USDJPY ignored this several times and kept shooting higher.
After the magenta paint bars, you'll notice some red paint bars which is a combination of momentum and volatility indicators noting that price has gone way too far and to look for a confirmation signal with a price close below the key moving average (yellow line). Then, two days ago, you'll notice that the signal was confirmed with a close below the yellow line, and the upper band of the volatility indicator. This is accompanied by a modified RSI which has been severely overbought for several weeks and is starting to turn down, while at the same time there is a bearish squeeze in my histogram just below it. So you have a bearish squeeze at the same time the RSI is overbought, which is a very bearish sign. Lastly, you'll notice that my momentum indicator is also showing bearish divergence.
Now this is a large and long uptrend that I'm calling to be broken, and usually these types of trends don't give up easily. You can see that the day after the USDJPY broke below the moving average (yellow line) that it immediately reversed higher and kissed the yellow line and practically close right on it on Friday. Then, when you look at my momentum comparison of all major currencies in the bottom right of the work space, you'll see that the US Dollar is all by its lonesome trying to make a push higher, while everything else, including the Japanese yen, is trending down. Directly above that, you'll see that the US and Canadian dollars are the strongest in the market right now as well. So, I'm not entirely confident that the USDJPY will breakdown immediately, as there may be another push to a new high in the next few days. If so, I'll be looking closely for reversal patterns at that new high to hit it short. I am currently modestly short the USDJPY now, but am prepared for a new high to add to that short position.
Let's look at the wave count and Fibonacci data. I can count a sharp wave ((2)) rally ending right at the 78% Fibonacci level of the decline that started from 123.75. If this count is correct, the USDJPY should not make a new high and should almost immediately undergo a sharp decline lower in a large wave ((3)) down. If so, this would be a great risk/reward trade as I can go short from current levels with a stop just above 118.50, risking a little over 150 pips with the potential to 2000+ pips. Now I doubt I would hold it that long, but it gives you an idea of the limited upside from here, and the extraordinary potential to the downside.
Please support the blog and like this post :-)
PLEASE NOTE: THIS IS AN ELLIOTT WAVE BLOG EXPRESSING AN OPINION AND IN NO WAY GUARANTEES OR IMPLIES ANY PROFIT OR GAIN. TRADE AT YOUR OWN RISK.


