This Elliott Wave blog is dedicated to sharing Fibonacci ratios and other technical analysis for forex signals, index futures signals, options signals, and stock signals. Elliott Wave Principle puts forth that people move in predictive patterns, called waves. Identify the wave counts, and you can predict the market.
Monday, March 7, 2011
Bears Showing up for a Fight; Euro Shorting Opportunity for Aggressive Bears
I'm very short on time but am posting this since some significant developments occurred today.
Internals were very bearish again today, and on a Monday no-less, which has traditionally been owned by the bulls. The internals weakness along with some small 5 wave counts on the smaller timeframes and the breaking down of 1312 at today's close make it an interesting play for the bears here.
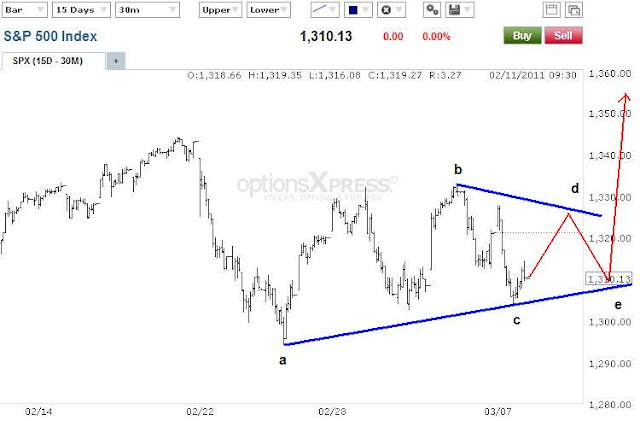
1312 was taken out today at the close, erasing that big bullish surge last week and triggering a short position on my part. Under this count above, a series of 1s and 2s are unfolding and should soon give way to a wave 3 at several degrees which essentially means a sharp almost straight line down. As long as 1327.68 remains intact, I feel comfortable being short here, a break below 1294.26 will make me extremely comfortable.
Learn Elliott Wave Principle
The alternate wave count that I'd like to see eliminated very quickly is the bullish triangle scenario above. Under this interpretation we'll see more up-down action for a net sideways move that will result in a sharp thrust higher to new highs on the year. A break below 1294.26 will negate this triangle and get me even more short this market.
EURO
As for the euro, today's reversal looks nice but didnt' really break any key levels or support. But the action in the AUD/USD and GBP/USD on the other hand, looks very bearish. I took an aggressive stance and shorted the euro on today's weakness against the recent highs. With stocks looking poised to possibly fall hard and the euro overbought, I thought I'd take a shot. But right now this is more of a calculated gamble with a very small position rather than calling a solid top and putting in a big long term position.
PLEASE NOTE: THIS IS JUST AN ANALYSIS BLOG AND IN NO WAY GUARANTEES OR IMPLIES ANY PROFIT OR GAIN. THE DATA HERE IS MERELY AN EXPRESSED OPINION. TRADE AT YOUR OWN RISK.
Subscribe to:
Post Comments (Atom)


7 comments:
Hey Todd...nice review. The markets sure teach you patience, if anything. Here's a chart for ya. Whattya think? I know what it means....lol (evil laugh) if the pattern plays out. Talk to you soon.
http://stockcharts.com/h-sc/ui?s=$TNX&p=W&yr=20&mn=0&dy=0&id=p45117965910&a=227268861&r=34&cmd=print
I've been watching that channel too, but for today I'm setting my target based on the symmetrical scenario above.If we break below 1302.75 then the symmetrical is broken and we go with your chart :)
Wait, I didn't see that was treasuries.There's also a primary channel on the spx.What does it mean to the equities market if treasuries go down?
/es Pre-market hit a high of 1318.50 and hourly shows the correction is over.Short cover set to 1307.
I don't trade bonds really but the trend for yields here looks clearly down according to your chart. As long as that series of lower highs remains intact, it should eventually give way to a washout lower, perhaps now like you labeled. Since the 10 year tends to mirror mortgage rates in movement, it means mortgage rates should tank too. Get ready to refinance!?
Normally if treasury prices go down (yields up) that means stocks go up, and when treasury prices go up (yields down) then stocks go down. So stocks often follow yields in movement. When people get nervous or scared about stocks, they move out of stocks and into the safehaven of treasuries which causes stocks to fall and treasury prices to rise (yields down).
I like that! I'm already short a little right now but will pile on more with a break below 1294.26.
Post a Comment