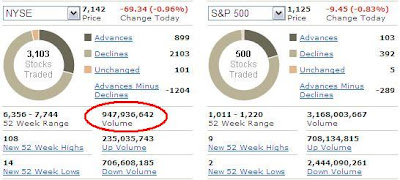
If the market put in a top on Tuesday it did so very quietly. If a large wave 3 down is underway, as my wave count suggests, then I'd expect sharp downward moves, extremely bearish internals, and an increase in volume at least above the 1 billion share mark at a bare minimum. We're getting none of that, so internally this market is not behaving like a wave 3 at all.............at least not yet.
ELLIOTT WAVE PRINCIPLE (LEARN IT FREE HERE)
The wave count above is unchanged from yesterday and remains on track as long as Tuesday's highs hold. But until we see the breakdown of some key levels and a clear impulsive decline (Elliott Wave Tutorial, 2.1), we can't conclude with any amount of certainty that a top is in just quite yet.
The Above Russell 2000 chart and wave count is almost the exact same as the S&P 600 Small Cap index. You can see that the small caps are showing weakness relative to the other main indices. We all know that oftentimes the higher risk indices will lead the markets, so according to the small caps the overall market wants to move lower. But the action in the small caps is a bit curious because the Nasdaq 100, also considered a risk index, is showing more strength relative to the other indices. So we'll see soon enough who the true market leaders are.
So if we monitor the small caps, and even perhaps the Nasdaq Composite as shown below, we may see some signs of a top in already when we grind down to the smaller intraday charts. The Russell and S&P Small Caps both declined impulsively (Elliott Wave Tutorial, 2.1), and closed beneath their lows made this morning. So if they're leading the market right now, the other indices should follow them lower tomorrow.
On the intraday Nasdaq Composite chart you can also count the decline impulsively as well, albeit it's not textbook. Under this count, there should be little pops higher or sideways action tomorrow and Monday; it should just resume its decline sharply to new lows. Anything else besides a sharp move lower would put this count into question.
ALTERNATE COUNT
Above is the alternate count (Elliott Wave Tutorial, 7.6) to intraday structure. Here I'm illustrating this count in the Russell 2000. This count remains quite probable since it would explain why the decline so far has been quite underwhelming in price and internal composition up to this point. It also can account for the impulsive decline from Tuesday's highs as well, where it's just a wave A of a zig-zag (Elliott Wave Tutorial, 3.5) correction, with wave C now underway to carry just a little bit further down before a bottom is established.
The financials continue to follow my forecast originally pointed out in Tuesday's post. The topping and reversal action was on the 4hr charts back then and I said it would probably lead to a decline for a few days, and it has done so nicely so far. If we slap a wave count on this very bearish looking structure above we can see that its descent lower has just begun. The XLF should not hesitate falling much lower in the coming days. And remember, the XLF is one of the few markets that did not exceed its August 2010 high, creating a minor divergence with the major indices. And that's bearish.
Keep your eyes on the bigger picture with EWI's newly posted article "Deflation: The Trend That's Become Too Obvious To Ignore."
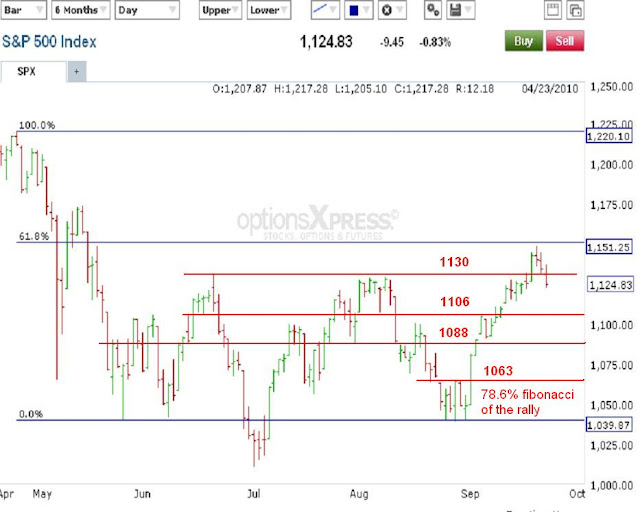
Key support levels to be taken out are 1130, 1106, 1088 and 1063. Taking back 1130 today was important for the bears because this is the supposed "breakout" level that all the bulls have been talking about lately. The break above 1130 was suppose to signal a breakout above the trading range of the past few months, implying much more upside potential in the weeks/months ahead. But today the bears took back that level with a solid close back udnerneath it, perhaps signaling a "false breakout" to the upside earlier. Now it's important is for the bears to hold onto this level Friday and early next week.
The next key levels at 1106 and 1088 are just prior support/resistance/congestion levels that could give the bears some problems. The easier the bears take out these levels, the stronger it implies the downtrend is. The ultimate key level is quite far away so I'm not sure how good it does us now to talk about it, but it lies at the 78.6% fibonacci level of the entire rise from late August at 1063. A break below that level should prove that it would be too deep of a downward correction to confidently say that the larger trend is still up and the decline was just corrective. Obviously, a break beneath 1039.70 will ultimately confirm that the larger downtrend had resumed and that a large and powerful wave 3 is in fact underway. But we should have a better idea of that probability before the market approaches 1039.70.
One thing I've been watching lately is the action in the VIX. The S&P should move in the opposite direction as the VIX. But you'll notice that since around the middle of this month the VIX has been making higher lows in a minor uptrend while the S&P was making higher highs in an uptrend as well. This shows an underlying fear and lack of confidence in those latter new highs in the S&P and lends itself to a top and reversal structure in stocks.
Lastly, I wanted to update the 4hr MACD chart on the S&P. You can see with the weakness the past few days it has finally allowed the moving averages to cross down. At their elevated level, it leaves lots of room to fall for a long time. Another strong down close tomorrow should create a downward squeeze on the daily charts too, which would be another good sign for the bears.
Also, don't forget to take advantage of Prechter's August 2008 Theorist offered for free. In this issue he does a question and answer format on the government's role in the economic conditions we find ourselves in. Below are some of the questions he addresses in the newsletter:
- What impact did the so-called “stimulus package” have on the U.S. economy?
- In an economic depression, will pension funds keep most retired Americans afloat?
- Who really benefits when the government props up Fannie Mae and Freddie Mac, and what's the fraud behind the idea of “too important” to fail?
- Who does the government consider to be homeowners: you and your neighbors, or the banks that hold the deeds?
- Who really endorsed the emergency Housing Act – and who will be hurt by it?
- Can the Fed keep making loans to banks forever?
- Is it actually against the law in some states to warn people of potentially dangerous banks?
- GET IT RIGHT NOW FOR FREE HERE


3 comments:
Thank you for sharing your analysis.
The rub is that on the COMP the subdivisions in wave 'iii.' don't look impulsive. So, if it turns out to be a top, then as you suggest, it is a stealth top.
OTOH, NDX did an impulsive move up off the lows today, and stopped less that a point from yesterday's high. The down move held at 78% fib of the lo-hi range (so far). It remains to be seen whether the last 15 minutes of up tick is part of subwave 4 or start of another up wave.
Best to you.
I see, thanks. Internally it looks like a correction, but I don't expect the top and reversal to be obvious so I'm keeping my eyes open for any sign.
Post a Comment