
There are still various options for the medium/long term but the short term showed its hand a bit today and slanted the probabilities in favor of the bears. I gladly stopped out of my last half of long positioning on this morning's decline. I added a quarter position short right at the close because I thought the Dow's reversal pattern on the daily charts was compelling enough to do so, and the market had rallied solidly off the lows allowing me an opportunity to enter at a good position.
The internals today were only slightly to the downside, however they're finally down instead of always being at least somewhat positive. And again we had a down day where volume exceeded the 13 day moving average, something the bulls have had a hard time doing on their rallies. So not overwhelming bearish at all, but bearish nonetheless.

I don't want to over-analyze or over-write today. I want my charts to do most of the talking.
The above chart is the biggest reason I took a small short position into the close and feel the bears have regained control of the market for the time being. Although it didn't close below yesterday's intraday low (10,463) that I cited earlier today, it did close below yesterday's open. So we had an intraday spike to a new high this morning that was not confirmed by the Nasdaqs or S&P, and then a close solidly beneath yesterday's open. And all on decent volume. That's bearish to me and signals that the bears have taken control of the market at least in the short term.
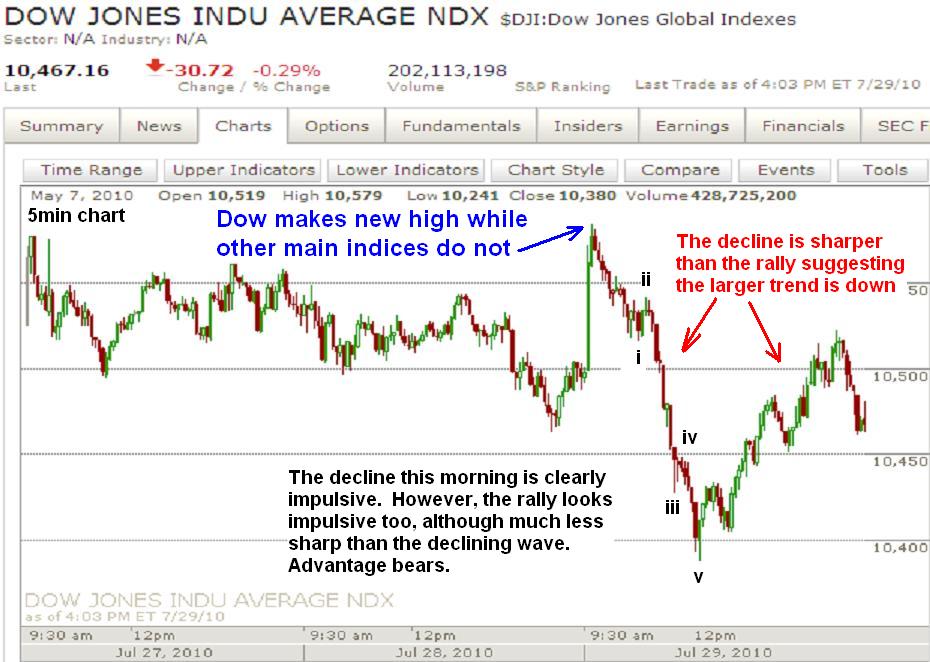
Other pieces of bearish evidence lie in the short term structure as seen in the 5min 3 day chart of the Dow. The decline this morning was clearly impulsive and much sharper than the ensuing rally. And that rally seemed to run out of steam into the close, suggesting it COULD be the start of the next leg down. The only thing that is potentially bullish in this chart is that the rally late in the day appears to be a 5 wave move as well. But the fact that the 5 wave decline was not completely retraced yet, and the declining wave this morning is much stronger and sharper than the late day rally still lend itself to the larger trend being down in my opinion.

Lastly is the less likely bullish potential that I'm adding onto from yesterday's chart. This is supported mainly by the intial decline from Tuesday's high being a corrective looking wave. Now the Dow made a new high so perhaps the Dow is leading the rest of the market as far as wave structure goes, but when looking at the S&P and Nasdaqs, their declines starting from Tuesday's highs look corrective. So it's possible that today's 5 wave decline was just a wave C within a wave iv. If so, the market should continue rallying higher in the coming days/weeks according to the above count. But as long a today's high in the Dow remains intact, I'm bearish.


Lastly, above are some currency charts. The top chart is of the euro which is sporting a potential topping pattern. The bottom chart is of the Australian dollar vs. the US dollar. It shows a nice 5 wave decline and correction that should have ended today. These may be two small hints that a large top is in place, which would mean that a US dollar bottom was in. If so, the dollar could be at the beginning stages of a major rally. Doing so would put a lot of pressure on equities and commodities.
PLEASE NOTE: THIS IS JUST AN ANALYSIS BLOG AND IN NO WAY GUARANTEES OR IMPLIES ANY PROFIT OR GAIN. THE DATA HERE IS MERELY AN EXPRESSED OPINION. TRADE AT YOUR OWN RISK.

No comments:
Post a Comment