
Internals today tell me that the decline was quite strong and the modest bump up in volume MIGHT be a good indicator of what might be coming this week. If the market continues to decline while volume increases, it will be a big indication that minor wave 2 has topped and we're in minor wave 3. The decline today was led by the small caps and technology while the VIX closed up 4.58%, so risk was pulling back today which could be the first signs of full on risk aversion coming back to the forefront after the long "risk on" trade that resulted from the Fed announcing they're going to become everyone's trading/investing backstop. I expect volume to continue to increase on the move down otherwise we'll have to consider this pullback to just be part of a correction before charging to new highs. But we'll wait to see what happens first before we start thinking about all that.

So we now need to see the decline unfold in larger impulsive patterns to help confirm that the larger trend has in fact turned down. The larger the 5 wave impulsive patterns we see to the downside, the larger the degree of trend that has been reversed. So we need to keep establishing shelves of resistance that can keep an impulsive count on track at larger and larger degrees. Right now I see the 1148.26 level in the S&P cash index as a key level that needs to remain intact for now in order for us to remain confident that a significant top is in, and not just a minor short term setback.


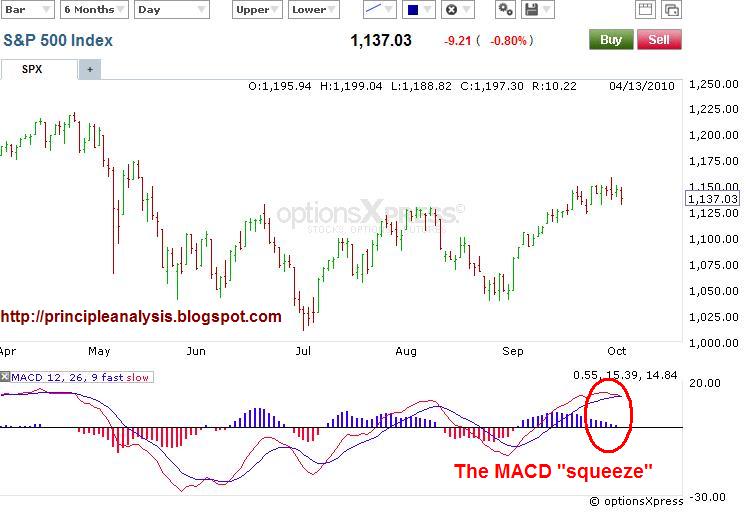
And now the MACD "squeeze" is occurring big time on the daily chart. You can see the moving averages are pinched, creating the "squeeze" on the histogram (circled in red). This is another bearish structure and signals a big trend reversal may be setting up, and could already be in the making as we can see from what I mentioned above.
Don't forget to download the free booklet, "How To Use Bar Patterns To Spot Trade Set-ups", for more basic technical analysis methods, like the ones I just mentioned, to add to your toolbox.
FOREX

Today's decline in the euro is a promising start to what could be the initial signal that the major top I'm looking for might be in. I was really hoping we'd break to a new low beneath 1.3665 to confirm that the decline was a 5 wave drop on the 15min chart. This would of course be a great sign that wave 2 had completed and the euro's descent to much lower levels is underway. This would also be another piece of evidence that the stock market has also topped as well. So I'll be watching the pair into the Asian and european sessions tonight to see if it can in fact break that 1.3665 level soon, and add another check mark to the list of evidence we want to see to confirm that a major top in both equities and the euro is likely in.
Right now the odds favor those major tops being in right now, but we're far from confirming it with high certainty. But that doesn't mean I don't see good opportunities for the bears here with good risk/reward ratios in various markets.
PLEASE NOTE: THIS IS JUST AN ANALYSIS BLOG AND IN NO WAY GUARANTEES OR IMPLIES ANY PROFIT OR GAIN. THE DATA HERE IS MERELY AN EXPRESSED OPINION. TRADE AT YOUR OWN RISK.

No comments:
Post a Comment