Thursday, June 24, 2010

1085 Taken Out Decisively, Advantage Bears

S&P Cash Index Daily Chart


Above is a daily S&P cash chart showing the bigger picture we're watching. We see that there's a high probability of a significant reversal of trend this past Monday as the market reversed sharply into the close creating a bearish reversal candlestick. What's more notable is that it did so at the 50% fibonacci retracement level. The market opened right on that level, then rallied, reversed and then closed firmly below it. So the daily chart suggests a larger trend reversal occurred on Monday and that further selling is ahead.


Internals


Internals today were fairly weak with NYSE downside volume closing at 91%, and 75% of NYSE stocks closing down on the day. This is not as weak as yesterday, but as you will see in my wave counts below, today's action probably represents a 5th wave which is usually accompanied by diverging momentum relative to that of the previous wave 3. So things are well in line in that respect. Another internal aspect that might become an issue later on is the fact that volume still remains less than stellar on this decline. Although today's NYSE volume did kiss the 13 moving average, I'd like to see bigger volume numbers coming in on this decline quickly. The size of down volume, total decliners and total volume will become more and more important as the days go on. If this is a wave 3 at various degrees, then all these things should be increasing.


Bear Wave Count 1


Today's push made it decisively below the key 1085 level I mentioned yesterday, and then even closed strong well beneath it. This action eliminates yesterday's potential bullish count that had the entire decline from 1131 as a 3 wave corrective affair. The bears appear to be in firm control now. And now that we have 5 waves down from the 1131 high, the bears can comfortably place stops just above 1131 in my opinion.

Above is one of my two top interpretations of the short term wave structure. Although we have a 5 wave decline already, it could be useful to recognize what any bounce may imply if it comes in the future since it can bring about a great trade for the bears with a stop just above 1131. The count above has us in an extended 5th wave which means that very small wave [iii] got underway at the close and should continue down sharply into tomorrow's open. That should be followed by a flat wave [iv] rally that should stop short of 1074.63 before falling to one more new low to complete wave [v] of v. of (i) of 3 of [3] or C. So if that type of behavior occurs tomorrow, then we'll have our only top count above.


Bear Wave Count 1


The other top count I'm watching is that of a flat correction shown above. Today's late day decline represents wave 'b' of a "flat correction". And with the strong momentum at the end of the day to the downside, I wouldn't be surprised to see another pop lower in the morning. But under this wave count it would mean that a sharp wave 'c' rally would then quickly occur to finish off wave ii.

So these are the two counts I'm watching. The first one has us in an extended 5th wave which should result in more heavy selling tomorrow and perhaps flooding over into next week. The second wave count might result in a rally right at the open for wave "c" of ii, or maybe a short pop lower and then the wave 'c' of ii rally. Either way, the larger trend remains down and any rally would seem to be a good opportunity to get short with stops above 1131.


PLEASE NOTE: THIS IS JUST AN ANALYSIS BLOG AND IN NO WAY GUARANTEES OR IMPLIES ANY PROFIT OR GAIN. THE DATA HERE IS MERELY AN EXPRESSED OPINION. TRADE AT YOUR OWN RISK.

Wednesday, June 23, 2010

Bears Need to Take out 1085 Before Bulls Take out 1108

BEARISH COUNT


The market did nothing today, other than reverse a sharp rally surrounding the Fed announcement. The bulls are having a real tough time getting any momentum, or holding gains, so it aligns well with the trend being to the downside right now as projected. Above is one of two counts I'm watching right now. The decline counts well in the short term as a 1-2-3-4, with a wave 5 occurring on a break of 1085. Without a break of 1085, it will leave the decline vulnerable to being a 3 wave drop, which is a correction, and meaning it will make new highs soon after. This will become increasingly likely if the market goes above 1108 (the wave 1 low) before breaking below 1085. So breaking below 1085 is key for the bears at this point. Once the market does this, it will be very likely that a large decline phase is underway, and with it quite possible the decline is a 3rd wave at various degrees, it would make it a great trading opportunity with a stop just above 1131.


BULLISH COUNT


The fact that the market has not completed a 5 wave drop yet, and more importantly that there seems to be a clear triangle in the middle of the decline, make me hold this count above in equal probability as the first one I posted. If we only looked at a small window of time, and did not anticipate what might happen in the future, then this count would be the primary one since we have only a 3 wave drop with a clear triangle in the middle. Triangles can only occur in B, X and 4th waves, and a B wave would fit best here. A break above 1108 before going below 1085 would put this count as top choice. However a break below 1085 would make this count very unlikely, and put the bearish count up top as my primary choice. The breakdown of 1085 is key for the bears.


INTERNALS


Lastly, and briefly, I just wanted to further illustrate the market's "laboring" the past few days that has continued today. The market rallied strong midday but then reversed into the close, a theme all week. Also, as you can see above, the internals of the market were negative today as well. The bulls are having a tough time getting their legs under this market. So the advantage is to the bears, and as long as the bears successfully defend 1108 and take out 1085 soon, the bears will have a VERY firm advantage. We also need to see volume increase on the next leg down. Right now volume has been quite muted.


PLEASE NOTE: THIS IS JUST AN ANALYSIS BLOG AND IN NO WAY GUARANTEES OR IMPLIES ANY PROFIT OR GAIN. THE DATA HERE IS MERELY AN EXPRESSED OPINION. TRADE AT YOUR OWN RISK.

Tuesday, June 22, 2010

The Market Should be at the Start of a Very Aggressive Decline Phase


The market continued to the downside after its big reversal yesterday which is well in line with a wave 2 top. The market looks to be declining impulsively in nice smooth downward waves. A reliable count should develop in a day or two and I'll post the short term count here. Today's decline not only followed a big reversal day with impulsive-like action, but it did so with massive selling volume compared to up volume with down volume representing 92.5% of the total volume today, there were only 21 S&P stocks that closed up, and there were almost 4 decliners for every 1 advancer on the NYSE. The only kink in the armor for the bears is that today's volume was nothing to be impressed about as it held way below its 13 moving average on the NYSE. But that may change tomorrow. We should see increased volume on declines if the above wave count is correct.

I've adjusted the count to have us in a wave 3 of [3] or C, but it may change to a wave (iii) of 3 of [3] or C if the structure dictates. Right now the count I have above does not have EWP's "right look" in my view since wave (ii) is so much small than wave (iv). But it violates no rules so it does remain valid. And my other count would have its wave (ii) being quite long in time and price to be part of a wave 3 of [3] or C, so that one is suspect as well. Regardless of which of the two counts are correct, the market should be under tremendous selling pressure in the coming days. Without impulsive action to the downside on strong volume in the coming days, this above count may become vulnerable. Look for heavy selling, whether it be methodical like today, or a panic sharp shot downward. The market's larger trend right now should be decisively down. Otherwise some other structure is unfolding that I haven't listed yet. I would recommend watching the market's closely and being active in it right now. Opportunities like the one we MIGHT have right now are extremely rare.


PLEASE NOTE: THIS IS JUST AN ANALYSIS BLOG AND IN NO WAY GUARANTEES OR IMPLIES ANY PROFIT OR GAIN. THE DATA HERE IS MERELY AN EXPRESSED OPINION. TRADE AT YOUR OWN RISK.

Wave (iii) May Have Started Today

I've been moving to another place the past few days and haven't had internet or cable access. Tonight I'm finally up and running and saw what the market did today and am quite pleased as a bear. I'm sorry I can't post a count or chart right now but will try to do so tomorrow morning if I can. The market rallied in a 3 wave (abc) structure for wave (ii) of 3 of [3] or C. It made a clear 5 wave pattern for wave C and reversed after just breeching the 62% fibonacci level and has found support at a minor support shelf around 1106. If this is a wave 3 at multiple degrees like I suspect it might be, then there should be little mistake about it. The market has been practically churning sideways for the past few weeks. If we're in the wave 3s that us wavers are looking for, then the market needs to get going to the downside and start acting like wave 3s. I expect heavy selling tomorrow, otherwise wave (ii) probably has a little further to go.

I'll do my best to post more thorough updates with charts as the week goes on and I get more free time.

Friday, June 18, 2010

Markets Still Laboring to Move Higher


Above are the internals of the market this morning and again it shows that the rally of the past few weeks is laboring greatly as pushing higher today. This condition can last for days, but as long as it continues it means the reversal should be sharp and decisive to the downside when it gets underway.


Basic momentum indicators such as the MACD and RSI shown above are illustrating a bearish divergence in the tail end of this rally. Again, these indicators are not good for timing a move or reversal, but it does tell us that as it stands now, this rally is weakening significantly. This can change with a strong upward push on strong volume and internals, pushing these momentum indicators higher, but that hasn't happened yet. So as long as this feeble internals exist during this rally, then I would not be long and would be positioning myself to the short side for a possible monster wave 3 reversal to the downside starting at any moment.


PLEASE NOTE: THIS IS JUST AN ANALYSIS BLOG AND IN NO WAY GUARANTEES OR IMPLIES ANY PROFIT OR GAIN. THE DATA HERE IS MERELY AN EXPRESSED OPINION. TRADE AT YOUR OWN RISK.

Lakers Win the NBA Finals

It's been a wild night as the NBA Finals wrapped up tonight. Just a quick note on the markets, today we got the weakness the market was telling us it wanted to undergo the past couple days, but the losses weren't sustained as the bulls roared into the close. The bulls have a lot more work to do though before I step out of their way. Although it seems the market may want to climb a bit higher in the hsort term before wave 2 tops, at any minute we could get an avalanche of selling when wave 3 gets underway. With the end of quarter action still taking place the next week or so, it's possible the market could float around until July. But the profit potential for the bears here is high, so I'm looking for shorting opportunities.

Congratulations to the LA Lakers for their repeat championship!

Wednesday, June 16, 2010

Rally Out of Gas For Now


As I said around midday today, the market rally is quite labored. Although some indices closed positive, the market was negative today. As you can see above, there was solid downside pressure on the market with decliners beating advancers on the NYSE, and downside volume well outpacing upside volume. The S&P internals sported similar behavior. So the majority of action today was to sell, and only a small group of stocks held the market up. This is what occurs at the end of market trends as stocks start to peel away early from the previous trend and just a small few shoot higher as they're completely ignorant to the change of trend occurring. On top of that, the rally of recent weeks has been done on weak volume as well, suggesting that overall, the masses are not buying into this rally. So there's all around internal weakness, so I expect a pullback very soon.


Above is just a good example of how fractured and unhealthy the market has become with a rainbow of up and down indices today. This type of behavior, especially that when the Dow closes positive and the NYSE closes negative, suggest a reversal to the downside is on the horizon.

Of course, the market can erase all this "weakness" with a strong push tomorrow, but the evidence doesn't support that happening. Right now the evidence suggests that the market rally is severely weakening and that a reversal is imminent. It's all about probabilities, and the market will probably decline tomorrow and/or Friday.


In addition to internals, price is showing us an ending diagonal looking pattern into the 1119 level with diverging momentum as seen by the RSI (purple indicator at bottom of the chart). Ending diagonals are structures illustrating a severe weakening of trend. They are usually sharply reversed. My initial target for the decline is the 1089 area in the S&P cash index, but it has the potential to snowball into something much bigger. Remember, I'm waiting for wave 3 of [3] or C to get underway any minute now. There's no evidence now of this occurring right now, but any potential top and decline should be looked at as a possibility. I added to my short positions today to at least catch a near term decline. If the decline does occur soon, then I'll simply set my stop loss at the recent swing highs, and then hopefully soon to break even, and try to catch at least a modest decline in the market to scrape a few profits together.

One thing to keep in mind is that the end of the 2nd quarter is upon us so it can get kind of whacky for the next two weeks. So this "weakening structure" can hold for quite a while as the market grinds higher as money managers maneuver around for end of quarter positioning. But at face value, the internals and price action of the market look bearish, so I'm trading accordingly.


PLEASE NOTE: THIS IS JUST AN ANALYSIS BLOG AND IN NO WAY GUARANTEES OR IMPLIES ANY PROFIT OR GAIN. THE DATA HERE IS MERELY AN EXPRESSED OPINION. TRADE AT YOUR OWN RISK.

S&P Uptrend Weakening; At Least a Short Term Pullback Coming


The market rally is looking very "labored" at this point and momentum divergences are showing it as well (see RSI in above chart). Although the timing of the pullback is in question, I added to my short position a few minutes ago in trying to catch at least a short term pullback.


PLEASE NOTE: THIS IS JUST AN ANALYSIS BLOG AND IN NO WAY GUARANTEES OR IMPLIES ANY PROFIT OR GAIN. THE DATA HERE IS MERELY AN EXPRESSED OPINION. TRADE AT YOUR OWN RISK.

Tuesday, June 15, 2010

Waves Relabeled, Bears Have Work to do Now


Yesterday I asked if we would get the follow-through to the end of day selloff that was a nice setup for wave (iii) of 3 of [3] or C. We got our answer quite early this morning. Above is a daily chart of the S&P cash index showing the all talked about 200 day moving average. The break below it was supposed to send the market down off a cliff. This didn't happen. The market then unsuccessfully tried to break above it 3 different times until finally today it broke above it, and closed well above it. So now the market is headed to the moon right? Just as the CNBC chatterers said armageddon would happen when the 200 day MA was broken to the downside, they can also be wrong about the significance of breaking and closing above it. I don't put much weight in moving averages, other than they might become self-fulfilling prophecies since a lot of folks do follow this very basic indicator. What would be extremely bearish though is if the market breaks and closes below it in the next few days. And looking at the count below, it's possible.


I reworked my wave count in accordance with the action the market is giving us. My last count has us in a wave (ii) of 3. That wave 3 should be quite fast and ferocious, especially because itself is part of a larger wave [3] most likely. The market has been chugging around and grinding higher way too long and way too much for this to be likely. So I eliminated it from contention. So the above count is possible. I didn't put this count as my primary count because it is very awkward in the way the degrees of waves subdivide. Wave 4 is very sharp and much much larger and longer than wave 2, which is odd. It just doesn't look right. But it violates no rules, and is still possible. With volume still light, and nothing really changed in the US or global financial landscape in my view, I don't see a reason for the bulls to be so bold on this rally.

Today's rally did make progress for the bulls though. They blew out the 200 day MA which may, in the short term, get some other bulls to jump in now and accelerate the buying from here. They held the S&P 1040 level after a couple attempts by the bears to break below it. And there are a few bullish reversal candles in place reminiscent to the last couple corrections we've had that led to new yearly highs.

So the bearish case has been weakened today, and the bullish case strengthened indeed. But the majority of evidence still goes to the bears in my view. So after today's break of yesterday's highs I only exited half of my short term short position. The market can turn down sharply in wave 3 at any minute, but I don't see any signs of that happening yet, and I don't expect to see any signs either - it should be a surprise. But by exiting some of my shorts I can have the freedom to add on strength, or jump back in on weakness when I feel a top is in, or almost in. A close beneath the 200 MA would be a good start for the bears.


PLEASE NOTE: THIS IS JUST AN ANALYSIS BLOG AND IN NO WAY GUARANTEES OR IMPLIES ANY PROFIT OR GAIN. THE DATA HERE IS MERELY AN EXPRESSED OPINION. TRADE AT YOUR OWN RISK.

Monday, June 14, 2010

We Have the Setup, Now do we Get the Follow-Through? Also, Thoughts on the Euro

S&P CASH INDEX WAVE COUNT


S&P TRIANGLE AND THRUST


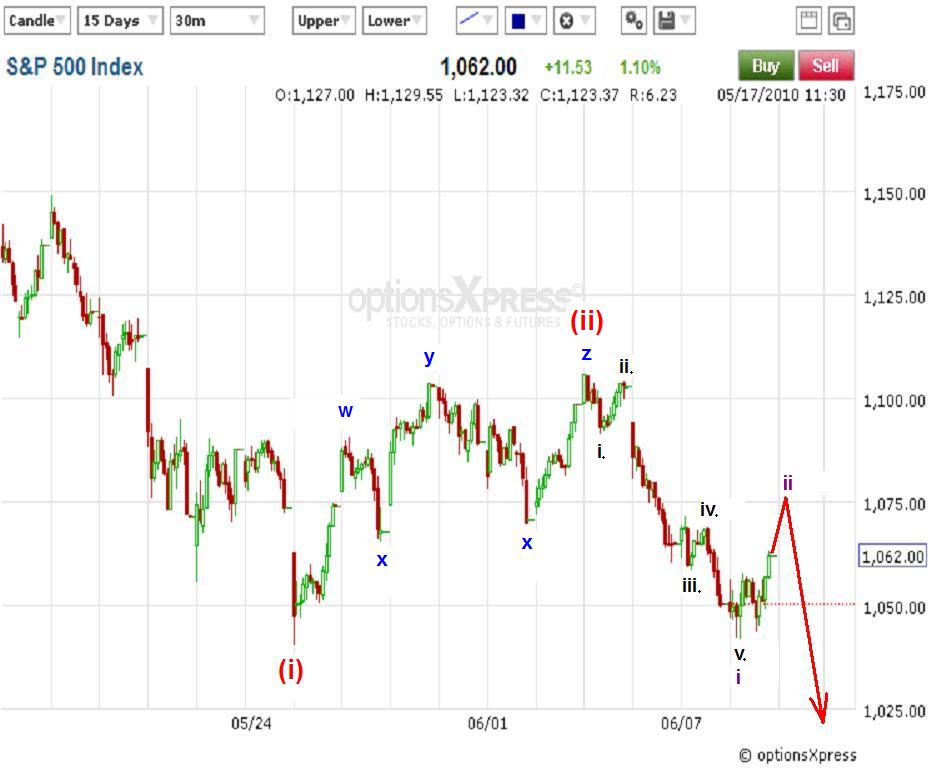
So the market played out nicely with the "flat" correction and triangle scenarios I mentioned yesterday. The market continued it's thrust higher from the triangle to make a very slight new high above 1105.67 to 1105.91 and then reversed downward the rest of the day. So the flat correction suggests that wave (ii) was continuing the past several days and most likely has completed at today's high. This means extremely heavy selling should be on the horizon in the immediate future with a wave 3 at various degrees, i.e wave (iii) of 3 of [3] or C. A break above today's high would severely damage my current wave count above, and I'd have to analyze the current structure at that time to determine what the best wave labeling would be if that were to happen.

But keep in mind the triangle from Friday. The thrust is over and so the market should now decline to AT LEAST the apex of the triangle around the 1083 area before possibly trying to find a bottom. So that's almost 7 more S&P points that should be lost in the near future. If the market just blasts right through the 1083 level then it will be the first hint that the above wave count is correct, and that heavy selling is underway to much lower levels.


INTERMARKET DIVERGENCES

S&P Cash Index


Another bearish development today was the fact that there was an intermarket divergence between the Dow/S&P and the NDX/Russell 2000. Both the Dow and S&P eeked out new highs from a couple weeks ago while the Nasdaq 100 and the Russell 2000 did not. This type of divergence usually occurs at trend changes. So as long as the NDX and Russell remain beneath those highs, the market is overall bearish in my view.


THE EURO


Weekly


Daily


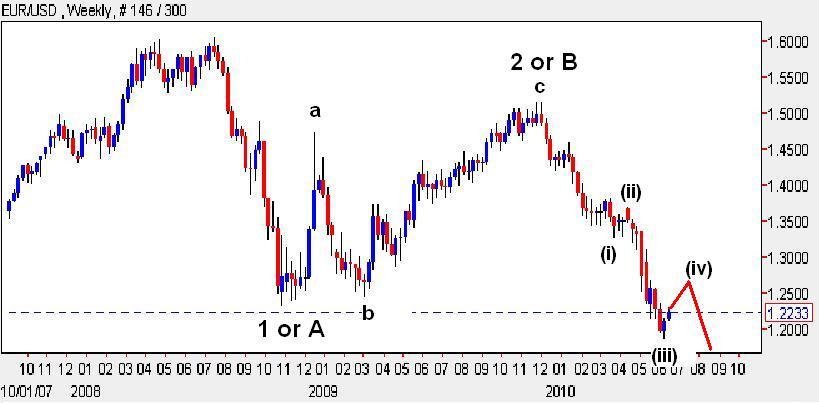
I've been getting a lot of emails regarding Prechter's call for a major US dollar top and its possible affect on the stock market. It's a legitimate concern, and I share it with many of you. I like to look at the euro, which is essentially the opposite of the dollar, and has been extremely oversold for a few weeks now and has been due for a big bounce. Obviously with a dollar top, the euro will bottom. As you can see from my above wave counts, it appears that a wave (iii) has ended and that a wave (iv) is now underway. So the euro is bullish and the dollar is bearish in the medium term in my view. But since it's a 4th wave, it may just be a sideways consolidation, or triangle, before shooting downward to new lows.

So what does this mean for the stock market? Well recently the euro's weakness has usually meant stock market weakness too. But there may be many various factors for that, and I'll leave that to the fundamental analysts to hammer out for eternity. While they're doing that, I'll be looking at the techincals and EWP to try and make some money. What I do know is that markets are not always correlated. They tend to be correlated strongly for given periods of time, and then move almost completely independent of each other during other periods of time. Just look at gold and the dollar. During the dollar's monster rally the past 7 months you'd think it would put some pressure on gold, but instead gold has been making new highs. Also, the euro has declined dramatically during that 7 months and the stock market moved up and down during that euro slide. So the correlation between different markets doesn't always hold true, and the euro can certainly rally, or move sideways, while the stock market tanks hard in wave (iii) of 3 of [3] or C. Although the euro bottom and rally is on my radar and is a concern for the bearish outlook in equities, I will not trade based on it. I trade based on the facts laid out in the EWP count and the other technical indicators. Anything else would just be a guess. And I don't trade based on guesses.

So I'm analyzing the markets independently with an eye on the euro/equity correlation as a backdrop. The euro looks to have found a bottom for the time being and the stock market appears to be at the beginning of a major decline phase.


PLEASE NOTE: THIS IS JUST AN ANALYSIS BLOG AND IN NO WAY GUARANTEES OR IMPLIES ANY PROFIT OR GAIN. THE DATA HERE IS MERELY AN EXPRESSED OPINION. TRADE AT YOUR OWN RISK.

This Week's Action


1105.67 is a key level for the bears to remain in a comfortable and advantageous position in my view. The failure of the S&P to make a new intraday low June 8th, breaks the series of lower lows it's had from the highs on the year. A break above 1105.67 would then make the first higher-high since that downturn as well. This MAY mean the downtrend has been broken, and the bulls are back in control. But 1105.67 is not do-or-die for the bears at all. It just means the bears' comfort level dropped a bit. A break above 1105.67 would have me looking at the below count:


This counts suggests that a flat correction is unfolding which means we're in a wave "C" of (ii). If correct, it will carry to just above 1105.67 before reversing sharply. From there the market will be trapped in a wave 3 at multiple degrees which means heavy heavy selling. Anything short of this behavior after a break above 1105.67 would be concerning.

One thing to note on a short term basis is that Friday we had a choppy session most of the day until going into the close where the market soared higher in an impulsive looking manner. This is either the start of a wave 3 at some degree, or a thrust from a triangle. Seeing as that I'm looking for a top any minute, and the market was trading sideways most of the session, I'm going to side with it being a thrust from a triangle. If so, the market may have topped Friday, or will do so with just slight pop upward at the open Monday morning.

So my primary count still stands from last week in that the market should be finishing up a wave ii of (iii) of 3 of [3] or C any minute now. But it needs to stay under 1105.67 in order for that count to remain intact. A break above 1105.67 would mean that a flat correction shown above is probably occurring for wave (ii), and that a reversal should occur shortly after breaking above that level. If not, then perhaps something very bullish is underway. I'll address that if it happens.


Lastly, I wanted to show the above MACD histogram momentum indicator. Although the MACD histogram is quite a basic indicator and is not good for timing at all, it does help us gauge the momentum of a trend. The histogram illustrates the divergence and momentum of the moving averages it tracks (not shown). As you can see, on the 30min chart above, the S&P is making new highs while the MACD histogram is making new lows, suggesting that the moving averages in the MACD are not impressed by the market's rally lately and that the market's momentum is quite weak. And the moving averages actually turned down late last week as you can see by the blue bars recently. This would be an odd setup for a wave 3 rally at some degree, or any rally that is just getting underway. This fits more with a thrust from a triangle Friday surging into a top. Although like I said, momentum indicators are not good for timing, and this bearishness can be erased easily with one strong surge higher on Monday. But as it stands right now the MACD histogram is telling us that the market's recent rally is weakening severely on a short term basis, and that there will probably be a sharp selloff soon, at least in the short term.


PLEASE NOTE: THIS IS JUST AN ANALYSIS BLOG AND IN NO WAY GUARANTEES OR IMPLIES ANY PROFIT OR GAIN. THE DATA HERE IS MERELY AN EXPRESSED OPINION. TRADE AT YOUR OWN RISK.

Thursday, June 10, 2010

What Does Today's Monster Rally Mean?


Yesterday's post called for a large downside drop today in a wave 3 at multiple degrees. Well a big move DID occur, but to the upside unfortunately. This was a complete surprise to me. The internals of the move were very very strong making me believe this is not going to be just a one day event. Unfortunately there is not that much room to the upside left for the S&P before it breaks above 1105.67, the start of its 5 wave decline. So I'm not confident that level will hold. If it doesn't hold, then it's still possible that wave (ii) is still unfolding and that the current push higher is a wave "c" of a "flat" correction. This would mean a slight push above 1105.67 before topping and reversing. But I don't like this count much at all since the current rally of the past few days does not look like a "C" wave at all since they are usually composed of sharp impulsive 5 wave moves. Not always, but usually. Also, this would have wave (ii) become quite long and wide, especially in time, compared to wave (i) that it would start to lose EWP's guideline for the "right look". Although it's not likely, it's still possible, so a break above 1105.67 would still put this alternate count on the forefront. But for now, I'm expecting 1105.67 to hold, and perhaps some more rallying or flat action tomorrow and maybe Monday before the next leg down. Notice the MACD is already diverging bearishly on the rally. So perhaps the rally won't last as long as I think.

Side note: I posted the 3rd video of Prechter on the top right of this blog if anyone's interested.


PLEASE NOTE: THIS IS JUST AN ANALYSIS BLOG AND IN NO WAY GUARANTEES OR IMPLIES ANY PROFIT OR GAIN. THE DATA HERE IS MERELY AN EXPRESSED OPINION. TRADE AT YOUR OWN RISK.

Wednesday, June 9, 2010

Wave ii May be Over.....if so, then the Stock Market is on the Verge of a Ferocious Selloff

Yesterday's Chart


Yesterday's Chart Updated with Today's Action


The top chart shows my primary count from yesterday which called for a sharp pop to complete wave ii and then a reversal. Today we got just that. Today's action is very bearish. Internals were strong most of the day but ended the day flat with the big reversal bringing the bears back into the market. The VIX also went from negative to positive territory as well. So the "all clear" signal for the bulls is definitely not in play yet. The sharp decline with the impulsive-looking structure at the end of trading today suggests that wave ii may be over and that wave iii of (iii) of 3 of [3] or C is underway. The market has been unfolding in beautiful impulsive declines and rallying in somewhat predictable 3 wave, or 3 wave combination, moves. Plus the internals of the market, along with other methods of technical analysis, are also falling into place to support the wave count. So all-in-all, things continue to look good for the bears. In order for this to continue, we need to see the market selloff sharply from here, If for some reason wave ii wants to chug a bit higher first, it needs to stay below 1105.67 for this count to remain on track.


1hr Nasdaq 100 and Fibonacci Chart


Above is an hourly chart of the Nasdaq 100 showing that the index's rally that started May 25th had halted and reversed at the 61% fibonacci retracement level of the previous 5 wave decline (count not charted).


10min Nasdaq 100 Chart and Fibonacci


Above is a 10min chart of the Nasdaq 100 showing that the rally that started June 8th also retraced a fibonacci level before reversing; only this time it was only 38%.

The fact that the index is respecting fibonacci retracement levels also suggests that the larger trend is still down. And the fact that the first retracement was 61%, and the second retracement was 38%, may tell us that the downtrend is building momentum and about ready to tumble lower in a big way. Solidly breaking through the S&P 1040 level will be a good sign that the downtrend has resumed, and the next wave of selling pressure should be extremely fierce and strong.


US Dollar vs. the Japanese Yen


One last thing, the currency pair that has been quite correlated to the stock market lately has been the USD/JPY. On the very small 10min timeframe we see a clear and clean 5 wave decline. This implies the trend has switched to down. So this too may be an indicator that the stock market's trend has also reversed to down as well. Tomorrow's action should give us more certainty of this. If the wave count I posted at the top of this blog is correct, there should be no mistake about it as the market should selloff VERY sharply very soon.


PLEASE NOTE: THIS IS JUST AN ANALYSIS BLOG AND IN NO WAY GUARANTEES OR IMPLIES ANY PROFIT OR GAIN. THE DATA HERE IS MERELY AN EXPRESSED OPINION. TRADE AT YOUR OWN RISK.

Tuesday, June 8, 2010

Two Wave Counts on the Table, Both Overall Bearish

KEY SUPPORT AT 1040


Above is a daily S&P cash chart showing the fierce support at the 1040 level of the S&P cash index. Once this level is taken out, there is little left but a few speed bumps to support the index until it reaches 900. So the bears taking out 1040 convincingly will be big. The more attempts at taking out this level, the weaker it gets. It's like eroding a castle wall with cannon blasts. One or two blasts from a cannon may not take the wall out, but each blast weakens it more and more until eventually it collapses and the army charges through with no resistance. In the markets, each attempt at taking out 1040 gobbles up stop losses and profit taking from the bears. But the more it's hit, the more of that support dissipates until it eventually gives way. So I'm watching 1040 closely.

Another thing to note today is that although the Dow and S&P's headline close was quite strong, the behavior of the overall market was quite weak. The high risk Nasdaqs and Russell 2000 indices all closed lower on the day despite the blue chip indices' sharp rally, which a lot which occurred in the last couple hours of trading. Today was a shift out of higher risk stocks, and into lower risk stocks. That is not the behavior of a new bull market. It's the behavior of an unhealthy and fearful market. So today's behavior was not bullish to me at all. The market may certainly grind a little bit higher in the short term, but the larger trend is still clearly down in my view.


PRIMARY WAVE COUNT


Above is my primary wave count of the short term picture. For the longer term count, check out last week's post (click here). This count is desirable because wave (ii) was composed of overlapping waves which is conducive of a correction, and it was also composed of sharp bursts higher which is conducive of a wave 2. It was followed by a sharp 5 wave decline into a low established yesterday, with very weak internals conducive of a wave 3 at some degree. So the rally and decline are unfolding perfectly for EWP standards, and the internals and structure support the wave count as well. So this count looks very good for me right now. Under this count, 1105.67 needs to hold, and the next wave will be a wave iii of (iii) of 3 of [3] or C. Which means it will be very fast and ferocious unrelenting selling for days. If correct, it's a wave the bears don't want to miss.


ALTERNATE COUNT


My alternate count suggests that wave (ii) is still unfolding in the form of a "flat correction". This means that wave "b" of the flat occurred yesterday, and todays is the start of a strong and sharp wave "c" that should just exceed wave "a" at 1105.67 to complete wave (ii) and then give way to very heavy selling pressure. This count is rated as less likely than the first one I mentioned because in order for this to be a flat correction it means that the proposed wave "b" would look a lot like a 5 wave move which a wave "b" cannot be. "B" waves can only be composed of 3 waves, or a combination of 3 waves. It cannot be a 5 wave impulse. Also, the decline from 1105.67 was very sharp and the internals were quite bearish, both of which are also not conducive of a wave "b". So although this count is still quite possible, it's just not as likely as the primary count above.

So right now my two top counts are overall bearish with one count leading to extreme selling any time now, and the other about to get hardcore selling pressure after it pops to just above 1105.67.


PLEASE NOTE: THIS IS JUST AN ANALYSIS BLOG AND IN NO WAY GUARANTEES OR IMPLIES ANY PROFIT OR GAIN. THE DATA HERE IS MERELY AN EXPRESSED OPINION. TRADE AT YOUR OWN RISK.
I'm unable to put up a thorough post tonight. Hopefully Elliott Wave International subscribers can get adequate information on the markets action today. The bottom line is that today's sideways action followed by a sharp selloff is conducive of a 4th an 5th wave. And this fits well with the wave structure that unfolded from last week's wave (ii) high since it's completed a five wave drop. So a short term rally might ensue to correct that five wave drop before more selling occurs. But last weeks wave (ii) high should hold and the trend is sharply lower as long as that high holds.

I should be up and running more normal for tomorrows post.

StatCounter