Thursday, August 25, 2011

Stocks Reverse Right at 1190, More to Selling to Come; Euro Set to Breakout Hard


Stocks reversed nicely today but volume held at the same level it's been at the past few days while it was rallying.  Probably the same folks who bought up this market just took profits today, lol.  I would have expected to see higher volume for the kickoff of Minute wave ((iii)) down of Minor wave 5, but with most people waiting for Bernanke's comments tomorrow, the big volume probably won't come in until Friday or Monday.  And I expect that volume to be slanted heavily on the sell side.


Using simple candlestick analysis you can see that the daily S&P cash chart shows a nice reversal pattern was put in today.  A strong new high was made today compared to yesterday, and then a new low was made compared to yesterday, and today's close was beneath yesterday's open.  All-in-all, a bearish formation.  I expect today's high to remain intact for at least a few days while the market falls hard.

Learn Elliott Wave Principle


For those of you who grew up watching the TV show The A-Team you'll appreciate it when I say, "I love it when a plan comes together" (Hannibal Smith).  Yesterday I said to expect a reversal at the 1190 area in the S&P since there is a gap there and a 78% fibonacci retracement level.  Even I was surprised to see the market turn on a dime right at that level.  Today's reversal looks good on so many levels, i.e. fibonacci retracements, EWP requirements/structure, candlesticks, gap behavior, etc.  The only problem with today's decline is the structure.  It is far from a good impulsive decline, so far.  But if it's the beginning of a larger down move, such as a Minute wave ((iii)) down, then there is some wiggle room for the early stages of the decline since further price action can easily clear up the short term's lack of clarity.

I expect today's highs to remain intact and the market to fall hard Friday and/or Monday.  A break above today's high will probably mean the Minor wave 4 high will also be broken soon as well.  So as long as today's highs remain intact, I'm firmly bearish in the short term.  The risk/reward strongly favors the bears here.


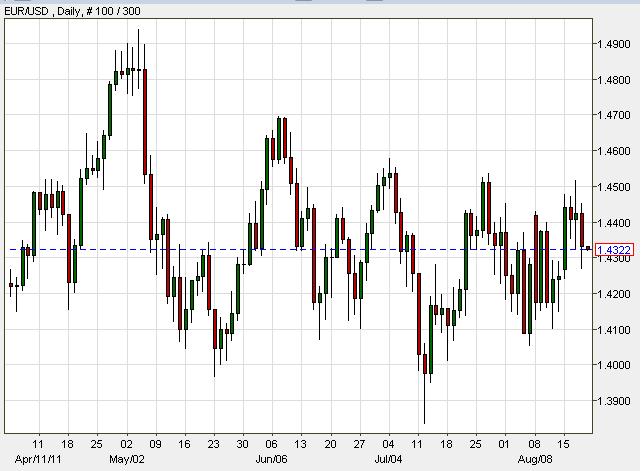
The GBP/USD traced out a 5 wave decline and made me a quick 100 pips in less than a day so I closed my short position this morning.  I feel the pair can easily continue lower but I don't want to be greedy.  Looking at the EUR/USD above, the sideways consolidation has really tightened lately, suggesting it is about to breakout hard and fast.  Looking at the daily chart alone would have me thinking the pair will breakout to the upside, but the series of lower lows in combination with the fact that it appears gold has formed a major top, have me leaning towards the euro breakout happening to the downside.  I expect gold and the euro to fall hard in the coming days.


PLEASE NOTE: THIS IS JUST AN ANALYSIS BLOG AND IN NO WAY GUARANTEES OR IMPLIES ANY PROFIT OR GAIN. THE DATA HERE IS MERELY AN EXPRESSED OPINION. TRADE AT YOUR OWN RISK.

Wednesday, August 24, 2011

Stock Rally Nearing Reversal; Euro Messy, but British Pound Very Bearish


Internals today were solid on the bullish side but nothing spectacular.  You can see a slight decrease in momentum from yesterday as volume was slightly down as well as advancers on the S&P.  Nothing very telling from this though, other than there seems to be little interest in buying up the market here from the big players.  I think a lot of this is just short covering going into Bernanke's speech on Friday, and relieving the oversold condition the market got into after the past few weeks.  The market can certainly float higher and higher on light volume, but the risk/reward of trying to follow a light volume move after a massive selloff is not good in my view.  So I'd be looking to short, and I have been.  Volume on this rally tells me it's a countertrend move, not the start of a new bull run.


The stock market had a nice reversal midday which showed some promise but was quickly erased and new highs were established telling us Minute wave ((ii)) is not over.  I zoomed in on the wave count I'm tracking above.  The conclusion of Minute wave ((ii)) is near.  The market rally seems to be fueled by short covering on risk reduction going into Bernanke's speech Friday as well as the hopeful perma-bulls thinking Bernanke will say something magnificant Friday.  I have no idea what will happen, nor do I care.  The charts are what talk to me and....shhhhhh, .listen.......(whispering) the charts are telling me that Minute wave ((ii)) is almost finished and a reversal to the downside is near.  And just in time for Bernanke's comments Friday.  There's an open gap and a fibonacci retracement level at the 1190 area that should mark a stopping point for this rally, if not sooner.  If correct, the selloff from there will be huge, at least 70 S&P points in a hurry.  But a break above 1208.47 will invalidate this bearish view and put me on the sidelines until things clear up.

Bottom line: the markets are eyeing Bernanke's Friday comments, so look for the timing of the reversal to be between Thursday and Monday, and look for the price of reversal to be at around 1190 in the S&P cash index, if not sooner.  Only a break above 1208.47 will negate this bearish view.

Learn Elliott Wave Principle


Well the euro may be a mess, but the Brisith pound is telling us a very clear story here, and it's bearish.  The 4hr chart I made this morning is above and shows a nice clean head and shoulders top accompanied by textbook diverging momentum during the head and shoulders process.  The break of the neckline and sharp selloff is a clue that this pair is in trouble.  Despite the euro holding firm, the fact that the British pound has appeared to have topped against the US dollar, and gold's big top and selloff today, it's possible the US dollar is set to surge big here, which is bearish for the GPB and EUR and other majors. 

I got short the GBP/USD today, I think the dollar is set to surge while gold and silver continue to freefall.

PLEASE NOTE: THIS IS JUST AN ANALYSIS BLOG AND IN NO WAY GUARANTEES OR IMPLIES ANY PROFIT OR GAIN. THE DATA HERE IS MERELY AN EXPRESSED OPINION. TRADE AT YOUR OWN RISK.

Tuesday, August 23, 2011

Stocks' Bounce Anemic, Downtrend Not Complete; Euro Still a Mess


Prices sure took off higher since my post this morning.  The surge in price is what I'd expect to see when a significant bottom is put in place, and the advance/decline ratio as well.  However volume was quite light today relative to the past few weeks at only 1.2 billion shares on the NYSE.  If this were significant bottom being put in place to kickoff Intermediate wave (2) higher, I'd expect to see much higher volume on the move today.  The light volume today tells me the big shots and heavy players needed to put in a bottom were absent today.  This morning's post still stands despite the big surge in the second half of trading today.


I just wanted to report that I'm starting to lean more towards the alternate count I put up in the last post.  The market is bouncing as I expected but my top count from last post suggests a major bottom of Intermediate wave (1) which means Intermediate wave (2) up would theoretically be underway now.  There are two major problems with thinking Intermediate wave (2) up has started though:

1) most major indices/sectors have not made new lows beneath their Minor wave 3 extremes; and

2) the bottom and rally has been anemic in price action and internals.  I would expect a more violent move off the lows, or a much larger and internally stronger push higher to kickoff such a large wave that Intermediate wave (2) would be. 

I don't see those two things here which tell me that most likely my alternate count is in play (see above chart).  This means that this current bounce is simply a Minute wave ((ii)), and when it ends, Minute wave ((iii)) down within Minor wave 5 will be underway.  This will be a pretty strong move to the downside that should have no problem taking most, or all, of the major indices/sectors to new lows.  So, as long as the S&P cash index stays below the Minor wave 4 high at 1208.47, this market is still bearish in my view.

Should Stock Investors "Fret Over Economy"? No -- See Chart to Understand Why


Learn Elliott Wave Principle

The euro is still a mess and no wave count can be determined here with high confidence, so I'm not going to "guess" and put one up.  It looks clearly corrective to me here which suggests a new high for the year is on the way.  But the recent move higher so far is also a choppy mess, suggesting we may have a sharp decline first.  Too many "ifs" and "buts" for this one so I'll avoid it for now.

My opinion is that the euro is experiencing a push/pull affect.  One example is that behavior in gold relative to the stock market.  Gold has been soaring to new all time highs and seems hell bent on getting to the $2,000 mark before exhausting.  But stocks have been plummeting during this time.  This push/pull of related forces on the euro has helped create the choppy price action you can see in the chart above.  I'm not sure how this will resolve though since when gold finally tops and reverses down, stocks should be headed up.  So which way will the euro go when that happens?  I have no idea, and since I usually depend on the EWP count for direction, I'm stumped.  I'm staying away.

PLEASE NOTE: THIS IS JUST AN ANALYSIS BLOG AND IN NO WAY GUARANTEES OR IMPLIES ANY PROFIT OR GAIN. THE DATA HERE IS MERELY AN EXPRESSED OPINION. TRADE AT YOUR OWN RISK.

Friday, August 19, 2011

Risk of Stock Reversal Increasing


I'm not too interested in reading the internals today since it was an options expiration day which can skew these numbers a bit.  However, considering the fact that there's usually heavy volume on option expiration day, the fact that there were only 1.5 billion shares traded lends itself to a Minor wave 5 outlook that is finishing up most likely.

And make sure you keep the bigger picture in mind and what it might mean for your long term portfolio:
See Prechter's "FREE FALL TERRITORY" Chart for Yourself


The more conservative way of counting the subwaves of Minor wave 5 is above.  I have 5 Minute waves almost complete which will wrap up Minor wave 5 very soon in the process.  I know that these waves are small for Minute waves relative to the prior Minute waves in this decline, but 5th waves often unfold imperfectly from what I've seen, so I'm planning for the most conservative scenario, which is above. 

I've removed most of my short positions to reduce risk.  The market has moved in my favor big enough and fast enough to warrant some profit taking at these levels.  Sure, Minor wave 5 can turn into an extended 5th wave and cascade downward to significantly lower levels.  But at this point that would just be a guess since there's no evidence to support that here, and the risk of a very large Intermediate wave (2) starting at any moment is great.  So the risk/reward for the bears here is not appealing to me.  So I took profits today.

Download Robert Prechter’s free report. - offer expires August 22nd


The other more aggressively bearish outlook is posted above.  In a perfect EWP world, and a world that I wasn't trying to reduce risk on my short positions, this count would be my top choice.  The count shows only a Minuette 5 waves completing here for Minute wave ((i)).  Meaning that after a corrective Minute wave ((ii)) rally, the market will continue much lower to complete all of Minor wave 5.  The possibility that this count may be in play is the reason why I kept a very small short position in place still.  If the structure clears up in the future to make this count a high probability, and the opportunity arises, I might attempt to re-enter on the short side if I can keep risk tight.  But for now, this count is only in the back of my mind as I try to reduce risk in preparation for a big Intermediate wave (2) rally.

SAVE 57% with this LIMITED-TIME OFFER: See what we see next for the markets now via this instant-access discount subscription offer.


The euro arguably completed a 5 waves down with a sharp corrective rally today.  I didn't label the chart because I don't want it to be misinterpreted that I actually buy into the view that this proposed 5 wave decline is the start of a new downtrend, because I don't.  The daily chart of the euro shows what is clearly a corrective downward move by EWP standards, meaning the next big move is up.  Aside from the series of lower highs in place that keep me from getting long for now, the euro does look overall bullish to me here.  Stocks have sold off drastically the past few weeks yet the euro has held firmly still, partly because gold has been in a blowoff top - or vice versa.  So I don't see how the euro will all of a sudden tumble at the tail end of Intermediate wave (1) in stocks.  Most likely the euro is waiting for Intermediate wave (2) in stocks for it to start declining, or it's going to rally with stocks' Intermediate wave (2), then decline hard with stocks' Intermediate wave (3).  There are too many "ifs" and question marks here for me.  So I'm standing aside for now.

Learn Elliott Wave Principle


PLEASE NOTE: THIS IS JUST AN ANALYSIS BLOG AND IN NO WAY GUARANTEES OR IMPLIES ANY PROFIT OR GAIN. THE DATA HERE IS MERELY AN EXPRESSED OPINION. TRADE AT YOUR OWN RISK.

Thursday, August 18, 2011

Stocks' Wave 5 Down Underway; Euro a Mess


Simply put, the reversal signs I noted in yesterday's post were indeed the kickoff to Minor wave 5 down.  New lows are just around the corner.  Internals today were a blood bath as you might have imagined.  97.3% of NYSE volume was to the downside and almost all S&P stocks were down on the day.  But volume was not nearly as large as it was in the previous down move.  Today we saw only 1.6 billion shares traded instead of the 2.5 billion area we saw before.  This further gives us evidence that a 5th wave is underway since EWP states that 5th waves are often accompanied with diverging momentum relative to the previous 3rd wave at the same degree.  So the previous 3rd wave at the same degree had volume in the 2.5 billion range, and now the 5th wave is in the 1.5 billion range.  Typical behavior of 3rd and 5th waves which helps strengthen the top wave count.

Download Robert Prechter’s free report. - offer expires August 22nd


Speaking of wave counts, let's get some posted.  Normally I just like to get to the bottom line and not get too tied up with the details that really aren't relavent at that moment.  The bottom line was that a 3rd, 4th and 5th wave have been on our plates and the focus should be on that current up/down movement, not what the bigger picture wave counts might be which will onlly cloud the issue.  In general, up until now, all the wave counts virtually would result in the same up/down movements, so I just focused on that fact.  But now that we're entering a time where the wave count options will start to separate from each other, I want to post the counts I'm tracking closely to get a better idea of where to look in the future.

Above is the preferred count I'm tracking now.  It's a little different than what I've been posting the past few days because Minor waves 1 and 2 have move back one wave.  The internal strength of Minor wave 3 compared to the current Minor wave 5 make this count the most viable in my view.  New lows in the major indices should be just around the corner, but once those lows are achieved, perhaps in only some of the indices, there will be a very sharp and long Intermediate wave (2) rally.  I would not want to be caught holding short during that rally so I'm choosing to begin the exit of my short positions now.  I'll then reshort as the big Intermediate wave (2) rally gets underway as long as it has the characteristics of a countertrend rally (corrective).

And make sure you keep the bigger picture in mind and what it might mean for your long term portfolio:
See Prechter's "FREE FALL TERRITORY" Chart for Yourself


In a perfect world, this count would be preferred. The reason is because Minor wave 3 should subdivide into a little nicer 5 wave move, giving it the "right look" in EWP's guidelines.  But we don't live in a perfect world, and the market rarely gives us perfect EWP form.  In my opinion, the move down has been so great and the profits so large that ignoring the first count I posted and trading based on this count would just be greedy.  Even if this count here is correct, the market is going to make one more low anyway and getting out at that point to avoid being caught short in Intermediate wave 2's monster rally is well worth it in my view.  Trading is all about risk/reward in my view, not trying to squeeze out every last drop of profits out every move even when a larger countermove is imminent.

SAVE 57% with this LIMITED-TIME OFFER: See what we see next for the markets now via this instant-access discount subscription offer.


Lastly, there is a less bearish option as seen above.  Instead of an impulsive decline downward as I counted in the two above charts, here we have an Intermediate (A)(B)(C) decline that will end with a new low soon.  Wave Cs are 3rd waves and are equally destructive according to EWP, so we can't say the past few weeks of heavy selling can only be a wave 3.  It can also be a C wave.  This count will keep me honest on the next big rally phase.  I have to make sure that I analyze the rally carefully in order to determine if it's characteristic of a new bull run, or if it's just part of a correction.  Making that determination will be key in placing big bets on the next big move the market makes.

I know this is a lot to digest and can be a bit confusing to those not EWP savvy.  This is why I usually just focus on the bottom line and don't get too tangled in the details.  The bottom line though for the short term is that regardless of which count is correct, notice that in the short term all the counts agree that the markets are headed to new lows soon and will rally soon after that.  From there we can better determine which of the above counts we should eliminate depending on the size, structure and strength of the impending rally.

Learn Elliott Wave Principle


The euro is a mess and according to EWP, this is clearly a correction within a larger bullish move.  The euro's failure to collapse with stocks also strengthens the thesis that this is just a correction within a larger bull move.  The problem is that it can't make a new swing high on a daily basis, making it hard to get long right now.  But overall, I think that it's currently in a 4th or B wave within a larger upward correction.  Once the 5th or C wave rally is complete, which will probably be in conjunction with stocks' Intermediate wave (2) rally, then the euro should fall hard along with stocks' Intermediate wave (3).  But right now, I'm avoiding trading the euro.

PLEASE NOTE: THIS IS JUST AN ANALYSIS BLOG AND IN NO WAY GUARANTEES OR IMPLIES ANY PROFIT OR GAIN. THE DATA HERE IS MERELY AN EXPRESSED OPINION. TRADE AT YOUR OWN RISK.

Wednesday, August 17, 2011

Today's Reversal Looks Appealing


I'm looking for Minor wave 5 to get underway to continue shorting with the larger trend. Today's reversal is a good initial sign that perhaps Minor wave 5 has started. But an S&P key level needs to be broken first.

Download Robert Prechter’s free report. - offer expires August 22nd


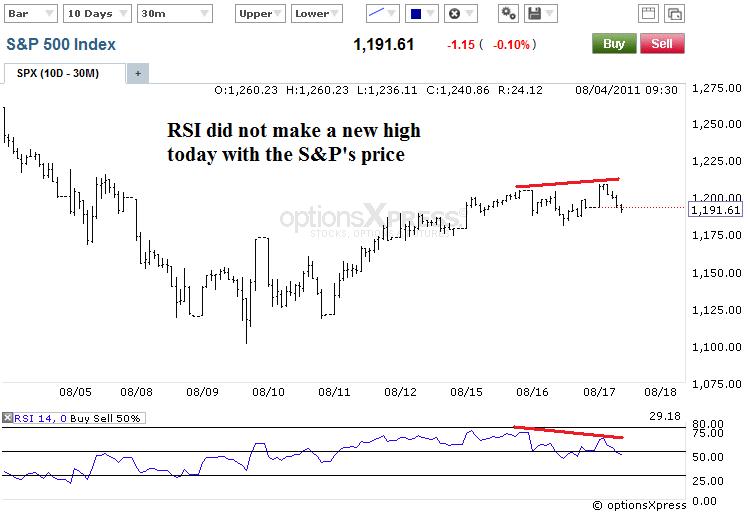
Today the market put in a nice reversal that sets up the possibility Minor wave 5 is now underway.  The Dow, S&P and Nasdaq 100 all made new highs today while the Composite lagged.  Tech is also leading the charge lower right now which shows that some risk aversion has returned.  Also, notice that the S&P's new high was not confirmed by the RSI.  Overall, the new highs made today were very weak and the reversal that just happened make it ripe for Minor wave 5 to get underway.  But I don't want to jump the gun early, I still want to see if the S&P cash index breaks to a new low beneath 1180.53, then I think it's a good risk/reward trade to be short here with a stop just above today's high.

Learn Elliott Wave Principle


PLEASE NOTE: THIS IS JUST AN ANALYSIS BLOG AND IN NO WAY GUARANTEES OR IMPLIES ANY PROFIT OR GAIN. THE DATA HERE IS MERELY AN EXPRESSED OPINION. TRADE AT YOUR OWN RISK.

Monday, August 15, 2011

Stocks Continue 4th Wave; Euro Trying to Breakout to the Upside

One last time, in case you missed it:
Prechter Discusses Market Forecasts on CNBC Closing Bell

We invite you to watch the interview below. Then download Robert Prechter’s free report that uses an 84-year study of stock market values to help you prepare for and understand today’s critical market juncture.


Download Robert Prechter’s Free Report To Discover How You Can Prepare For Today’s Critical Market Juncture


While we're sure you're reading countless articles and analysis about the market's recent volatility, if you're not reading what EWI's subscribers read, you're missing the valuable, prescient perspective contained in each issue of Robert Prechter's market letter, The Elliott Wave Theorist.
Access Robert Prechter’s free report and read in-depth analysis -- including an 84-year study of stock values -- that will help you prepare for and understand today's critical market juncture.

Download Robert Prechter's Free Report.


MONDAY'S POST


Internals today show a countertrend rally.  Volume continued to contract today as the NYSE only hit 1.1 billion shares whichs is about half of what we've been seeing the past couple weeks.  The price move was big, but internally it's hollow, suggesting this rally is countertrend. I'd continue shorting rallies.....this surge the past few days should be completely erased in fast order pretty soon.  If a bottom for the year was put in last week, there'd be a lot more volume on the rallying the past few days, in my opinion.


It's just a waiting game for the bears in my view.  Stocks look strong as they shrug off bad news and rally on mild good news.  The market is clearly relieving its oversold condition from the past few weeks of heavy selling.  Right now the S&P is in a good and typical reversal zone for 4th waves.  Fibonacci retracement levels of 38% - 50% of the prior move tend to be good areas for reversals to happen.  The problem is that there is virtually no evidence that there is a reversal, or that one is coming.  The market is is full bull mode at the moment.  The daily RSI has come out of significan oversold territory, and another day or two of up closes should prime it to get ready for another downturn.   

So although there's no evidence of a top in place, I'm watching the S&P's 1200-1223 area for signs of a reversal so I can add to my shorts.

Learn Elliott Wave Principle


For continuity purposes I'm posting the follow up to last Thursday's short term chart forecast.  According to this count, Minor wave 4 is coming to an end.  I still feel we need some more up/down movement that's weak internals, i.e. low volume with dragging momentum.  I wouldn't doubt if today starts that pattern, but it will probably continue at least another day or two before reversing sharply lower.


The euro has made a new swing high and is trying to breakout to the upside.  It has yet to take apart the series of swing highs laid before it though.  Breaking above 1.4600 would probably point to a sharper move higher in the coming days.  I'm now neutral the euro.


PLEASE NOTE: THIS IS JUST AN ANALYSIS BLOG AND IN NO WAY GUARANTEES OR IMPLIES ANY PROFIT OR GAIN. THE DATA HERE IS MERELY AN EXPRESSED OPINION. TRADE AT YOUR OWN RISK.

Thursday, August 11, 2011

Possible Short Term Wave Counts, S&P/Euro


I'm posting the internals after the close today. My intraday post from this morning is below. Internals were extremely bullish however volume continues to pull back, now down below 2 billion NYSE shares today.  Not encouraging for the bulls.  With the new highs made today above my wave ((a)), it's possible wave ((c)) of Minor wave 4 is already over. And the late day selloff into the close may be a hint of Minor wave 5 already beginning. We'll see tomorrow.  If wave 5 is already underway then it should be almost a straight line down tomorrow.  If wave 4 up is still working itself out, then we'll either get a sideways or up move tomorrow.  Either way, my finger is on the "sell" button at every opportunity.

Also, at the bottom of this post, check out the new Prechter video of when he was on CNBC's Closing Bell the other day:

Learn Elliott Wave Principle

Please read yesterday's post below for bigger picture bottom line analysis.  Basically I think a Minor wave 4 correction is underway that may take the form of a triangle (sideways move).  Another possibility may be a simple zig-zag correction (ABC) as shown above.  Tuesday's big triple digit Dow rally looks impulsive, which could make it an ((a)) wave, then you have a clear 3 wave decline with yesterday's selloff for wave ((b)), then this morning we have a clear impulsive rally again which is probably just a wave (i) within wave ((c)).  If correct, the market should rip higher in wave (iii) of ((c)) fairly soon. 

This is very very speculative on my part and just food for thought of something to watch out for the rest of the day and tomorrow.  I'm not getting long at all, I'm merely tracking this count to determine when to get short on a rally.  At any time this market can easily break down to new lows since it's now in a clear and strong large downtrend.  A sharp rip higher would put the above count on track.

Download Bob Prechter's Free Report on Market "Critical Juncture"


This count only works on a closing basis so confidence in it low in that respect.  Ignore the degree of trend since I'm unsure of it right now.  I'm just sticking with EWP basics of 1-2-3-4-5 / a-b-c right now.  On a closing basis it's such a perfect EWP pattern, I just can't ignore it.  If correct, the euro should be headed sharply lower very soon.  The above chart and count warrants at least a short term short position in my opinion since the risk/reward is so great with risk held at a new high on the day (stop 1.4293), or the start of the impulsive decline (stop 1.4400).

Prechter Discusses Market Forecasts on CNBC Closing Bell

"The problem is deeper than just a minor recovery or a minor recession."

Robert Prechter joins CNBC hosts Bill Griffeth and Maria Bartiromo on Closing Bell to talk about the still-unfolding forecasts presented in his New York Times bestseller Conquer the Crash.

We invite you to watch the interview below. Then download Robert Prechter’s free report that uses an 84-year study of stock market values to help you prepare for and understand today’s critical market juncture.


Download Robert Prechter’s Free Report To Discover How You Can Prepare For Today’s Critical Market Juncture


While we're sure you're reading countless articles and analysis about the market's recent volatility, if you're not reading what EWI's subscribers read, you're missing the valuable, prescient perspective contained in each issue of Robert Prechter's market letter, The Elliott Wave Theorist.
Access Robert Prechter’s free report and read in-depth analysis -- including an 84-year study of stock values -- that will help you prepare for and understand today's critical market juncture.
Download Robert Prechter's Free Report.


PLEASE NOTE: THIS IS JUST AN ANALYSIS BLOG AND IN NO WAY GUARANTEES OR IMPLIES ANY PROFIT OR GAIN. THE DATA HERE IS MERELY AN EXPRESSED OPINION. TRADE AT YOUR OWN RISK.

Wednesday, August 10, 2011

The Sideways Minor Wave 4 Takes Hold; Euro Set to Breakout Soon


Internals calming down a bit today relative to the last few major triple digit moves we've seen the past couple weeks.  Volume was still very high overall though at 2.14 billion shares.  Of that volume, 93.5% was to the downside.  Overall, again a very bearish day.  My guess is that margin calls are hitting traders and fund managers' desks forcing the large selling of their assets, which in turn facilitates further margin calls and more forced selling.  Then speculators are jumping on board and riding the short term trends, magnifying the impact of these moves.  So we get these wild swings on huge volume.  As far as price structure and internals go, this market looks ugly and in severe trouble.  Somebody  better do something "magical" to calm the markets down at least short term or this thing will continue to fall off a cliff in the coming days.  Things are bad.

Download Bob Prechter's Free Report on Market "Critical Juncture"


I'm still thinking that Minor wave 4 is underway which should lead to a see-sawing up and down with very little overall net gain or loss over the next week or so.  This is highly speculative on my part since the market can easily just plummet lower at any time and I'm trying to give wave labels to basically a straight line down.  Yesterday we had about a 450 Dow rally and today we had about a 530 Dow decline, but no new low.  So wave 4's choppy sideways move is off in typical fashion.  I would not get long this market at all, I'd simply be looking for rallies to short into.  This market remains bearish overall.

Learn Elliott Wave Principle


The financial sector has finally broken down.  I have said this a couple times in the past couple years as the $14 level was taken out, but was wrong on both accounts obviously.  I feel more confident in calling it a breakdown now that it's in the lower $12 range now.  Financials are the backbone of our economy.  We have to borrow money to buy or do almost anything in this country, i.e. buy a car, house, go on vacation.  So if financials are breaking down this severely as seen from the above weekly chart, it shows you how much trouble our economy and stocks are in right now.


Nothing new here for the euro as the bears and bulls keep exchanging blows in a truly consolidative pattern.  The bears have a slight edge here in my view though since there is a series of lower lows and lower highs in place, suggesting the making of a larger downtrend is at hand.  But with no clear EWP count on the bearish side, it keeps me honest and cautious of getting too aggressively short.  The euro is due to breakout from its consolidation at any moment, and the weight of evidence slightly favors the breakout being to the downside.

PLEASE NOTE: THIS IS JUST AN ANALYSIS BLOG AND IN NO WAY GUARANTEES OR IMPLIES ANY PROFIT OR GAIN. THE DATA HERE IS MERELY AN EXPRESSED OPINION. TRADE AT YOUR OWN RISK.

Tuesday, August 9, 2011

Market Rebounds, Minor Wave 4 Underway; Euro Continues to Consolidate Before Breakout


The market was deeply oversold going into today's session, and the bulls pounced on that opportunity.  With little bears left to sell the market the "buy the dip" crowd came in today and surged the market higher.  As a bear I would have liked to have seen lighter volume on today's move, but with 2.4 billion NYSE shares with 97% to the upside, the bulls are making a strong move here to put in a bottom.  I'm not convinced a bottom is in place, but today's rally certainly got my attention.  But let's look at volume in a little more detail through the S&P's ETF (SPY):


Looking at volume on the day as a whole on the NYSE, it was a very big volume day.  And looking at the big rally into the close you'd think it was all bulls all the way.  Although for the most part this is true, when you look at down volume relative to up volume on the SPY, you'll see there was still a slight bias to the downside with volume decreasing on rallies and increasing on declines.  This is a very small piece of evidence showing a slight bearish undercurrent on an otherwise very bullish day.  Just something to keep in mind when looking at the rally as a whole today.

Should Stock Investors "Fret Over Economy"? No -- See Chart to Understand Why


I know a lot of folks have been very excited and happy this decline has taken place over the past several weeks.  In fact, I know a couple of people who are absolutely joyful that the market has fallen so much so fast.  And no, they are not bears and they are not short.  They are perma-bulls who view this decline as a great buying opportunity.  Well people like this, and many wise short term traders who covered their short positions, were the reason why we had this bounce today.  The only difference between the two groups of people is that that the perma-bulls will hang onto their long positions and get their faces ripped off on the next series of declines while the wise short term opportunist traders will know when to get short again.

Today's rally may be part of a Minor wave 4 which I speculatively drew out a path forward in the above chart.  I expect further rallying tomorrow morning, but if it's a 4th wave, the overall move over the next week or so should be that of a fairly sideways move.  The key for the bears is to keep the Minor wave 1 low intact at 1258.07.  As long as the S&P cash index remains below that level, I'd be selling into rallies.

Learn Elliott Wave Principle


The euro continues to consolidate and will breakout hard and fast soon.  If I weren't a waver I'd look for that breakout to the downside.  But being a waver makes feel that this consolidation is similar to a triangle which means the consolidation is just a correction of the previous trend (up) and once the consolidation is over the previous trend will continue (up).  So I'm conflicted.  But I think the weight of evidence and risk/reward tell me to stick with the basics which show a series of lower lows and lower highs, so I think the short side should be favored as long as a new swing high on the daily chart is not made.


PLEASE NOTE: THIS IS JUST AN ANALYSIS BLOG AND IN NO WAY GUARANTEES OR IMPLIES ANY PROFIT OR GAIN. THE DATA HERE IS MERELY AN EXPRESSED OPINION. TRADE AT YOUR OWN RISK.

Monday, August 8, 2011

Markets in Chaos (again); Euro a Mess


The stock market action has been jaw dropping to watch the past two weeks to say the least.  The Dow lost almost 1800 points in just two weeks.  Wall Street overvalued the market going into the so-called "recovery", and now there is a severe repricing of that recovery.  It's happening in a hurry though and panic is well set in.  That doesn't mean a bottom is in though, the market closed down huge and on its lows today, and both the international and US governments have so far failed to calm the nerves of investors over the crumbling backdrop of our financial system. 

But just like the market overshot to the upside recently, it will also overshoot to the downside and lead to a sharp relief rally.  When that happens though, I have no idea.  The selling pressure is beyond intense and should be very worrisome for investors and politicians.  Today's volume on the NYSE was a whopping 2.54 billion with practically all of that volume going to the downside.  It's really jaw-dropping.  Just crazy.

Should Stock Investors "Fret Over Economy"? No -- See Chart to Understand Why


I'm going to address the giant elephant in the room, Bob Prechter.  There's no more avoiding it, or sugar coating it, Prechter's Primary wave ((3)) analysis is fitting in well here.  Primary wave ((2)) would have stopped shy of an all time high, and the strength and speed of the current decline is certainly that of a very large wave 3.  Prechter's call is back in business, and as prudent investors and traders, we should all at least be mindful of the current downside potential if Prechter is right.  Today's selloff feels like a "point of recognition" at some degree, meaning that we should be approximately in the middle of this current Intertermediate wave (1) of Primary wave ((3) down.  If correct, the market should continue sharply lower for most of this week taking the Dow at least another 1000 points lower before any meaningful bounce occurs.

Learn Elliott Wave Principle


The euro is a mess.  It looks like a correction, but the lower highs and lower lows keeps the downtrend intact and open the door to a sharp selloff at any moment.  But with this structure in price being so choppy, it's hard to gain confidence in the bearish outlook.


PLEASE NOTE: THIS IS JUST AN ANALYSIS BLOG AND IN NO WAY GUARANTEES OR IMPLIES ANY PROFIT OR GAIN. THE DATA HERE IS MERELY AN EXPRESSED OPINION. TRADE AT YOUR OWN RISK.

Thursday, August 4, 2011

Stocks Tank, Euro Follows


Yesterday I said the market was oversold and that bears should exercise prudence and caution and wait for rallies to get short.  I also added that taking a very small short position late in the rally yesterday would also be wise.  And of course, I wish I had gone "all in" yesterday, but that would have been a pure gamble on my part.  And I try not to gamble in the markets anymore.  The only reason I said that it would be wise to take a small short position yesterday is because sometimes when the market is oversold, and there's a big looming topping pattern in place (head and shoulders), the market will accelerate downward with a massive selloff.  But this is rare, so putting on only a small short position seemed wise.  Hind sight is 20/20 though, and today's action won't change how I approach the market in the future. 

Now I don't want emotions to get ahold of me, I'm in the business of taking well thought out and disciplined strategies that offer a high possibility of success relative to the possibility of failure.  So I still want to approach the market smartly here and not get caught up in the "I'm gonna miss the move unless I put everything I own in to short the market now" crowd.  With that said, I must say the charts, price action and internals look absolutely horrible right now and it appears that the equity markets are in severe trouble.  So finding a good entry point for the bears might be difficult.  All I can say that if someone were to have to get short and just can't stand having a small, or no position on right now, then I'd suggest that they make sure that they always keep at least some cash on hand to add to their positions on rallies, and/or to make sure they can survive a huge and sharp snap back rally.

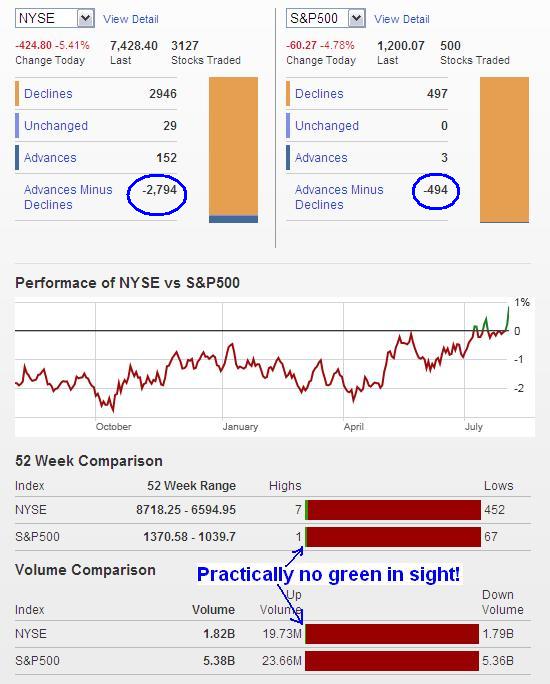
Looking at the internals today it's hard to think that there's anyone left to sell.  An amazing 1.82 billion shares were traded on the NYSE today.  This is about 1 billion more shares than the average the past few months.  Buyers were non-existent as the S&P had only 3 advancers and 497 decliners while the NYSE had only 152 advancers and 2946 decliners.  NYSE down volume represented an amazing 98.4% of all trading done today.  Those numbers are absolutely incredible in their entirety.  Just amazing.  But with so much selling force done today in such a calm orderly fashion, it's hard to think that there's anyone else left that's going to sell tomorrow.  I mean, who would have waited all day through a slow orderly selloff to -500 on the Dow and then is going to wake up tomorrow and sell?  Unless more horrible developments take place in Europe or early in the US session tomorrow that aren't already expected, then I would think we'd at least get a relief rally either early tomorrow morning, or most likely after an initial decline early in the morning where it will bounce back later in the day.  BY NO MEANS AM I TRYING TO GET IN LONG AT ALL.  I'm merely preparing myself for any rally that I can short into.

Unless the Dow rallies over 500 points tomorrow, this market looks horrible right now and the short side should be favored whenever opportunities arise, in my opinion.

Learn Elliott Wave Principle


For those of you who are savvy in chart technicals know this chart looks very very bad.  You have a major head and shoulders topping patter that has completed and has been followed by a very sharp drop to new lows.  Today's close occurred on the lows suggesting further selling early tomorrow morning, although I'm not sure who out there missed their selling opportunity today and decides to sell tomorrow after a 500 point drop.  But the chart is the chart, and it suggests that as it stands now, this market is in severe trouble.  Now that can all change in a heartbeat, like with a 600 point Dow rally Friday.  But we trade the with the data we have and view the market as it stands now.  And as it stands for the moment, stocks are in big trouble.

 
Elliott Wave International on today's 500 point Dow drop


The euro wasted little time taking back yesterday's gains and breaking down to new lows which I said yesterday would mean follow through to the downside.  The euro's series of lower highs and lower lows suggests the trend is down, despite no discernable wave pattern to count.  Look for the euro to charge for the 1.4000 area soon.


PLEASE NOTE: THIS IS JUST AN ANALYSIS BLOG AND IN NO WAY GUARANTEES OR IMPLIES ANY PROFIT OR GAIN. THE DATA HERE IS MERELY AN EXPRESSED OPINION. TRADE AT YOUR OWN RISK.

Wednesday, August 3, 2011

S&P Breaking Down; Euro Draws Line in Sand


The S&P broke down the levels I cited in my last post, making the bigger picture look bearish.  We've had rallies that failed to make new highs on the daily chart, and now a new low today.  This suggests that the trend is now down in the bigger picture.  There's a possible major head and shoulders top in place now, suggesting much further downside in the weeks/months to come. 

With that said, the market quickly recovered after breaking down to a new low this morning, typical behavior when establishing a new extreme.  So as long as we don't make a new high on the daily chart (around 1350), I see the larger trend as down, which means I'm looking to short rallies.

Using Elliott Waves: As Simple As A-B-C


In today's national news, as seen by http://www.drudgereport.com/, there is massive pessimistic news out there right now.  Not the type of mood I'd expect to see at the start of a major selling phase, but more like what I'd expect to see at a bottom.  So I still want to stick to the basics here with a disciplined shorting strategy.  As long as a new daily high isn't reached (around 1350), I want to short rallies as I get them.  With the market is oversold intraday and the news headlines so negative right now, it seems a sizeable bounce is due soon that should give me a good opportunity to enter short.  With the markets almost even right now, entering a small short position right now also seems wise.


A solid shelf has been established in the euro at the 1.4170 area.  It has tried several times to sustain a break beneath this level but has failed to do so and is now rallying sharply.  This level is obviously important so I'll keep watching it.  The bears must see the euro trade below 1.4453 in order to keep the short bias intact, and a sustained break below 1.4170 should open the door to further heavy selling.


The Single Most Reliable Indicator

In this video excerpt, Elliott Wave Financial Forecast Editor Steve Hochberg explains one of the most important things to keep in mind when assessing a market, "Extreme opinions, shared widely, constitute the single most reliable indicator of an impending change of direction for a market." Enjoy your video excerpt.
To find out more about the Wave Principle, be sure to watch the Club EWI video series: Learn the Why, What and How of Elliott Wave Analysis. This 3-video series is a great way to get started with the Wave Principle. You can watch these videos free with a Club EWI Membership.


Watch the Club EWI video series: Learn the Why, What and How of Elliott Wave Analysis. This 3-video series is a great way to get started with the Wave Principle. You can get these videos free with a Club EWI Membership.

Watch your free video now>>


PLEASE NOTE: THIS IS JUST AN ANALYSIS BLOG AND IN NO WAY GUARANTEES OR IMPLIES ANY PROFIT OR GAIN. THE DATA HERE IS MERELY AN EXPRESSED OPINION. TRADE AT YOUR OWN RISK.

Tuesday, August 2, 2011

S&P Breaking Down? Euro Continuing Lower


S&P momentum is clearly down at the moment, but you can see how wild the market has been the past few days to where it can turn on a dime at any moment.  So be careful.  I want to see the S&P break down before I get short with confidence.  Making new lows beneath 1258.07, and especially 1249.05 would be a good sign that the larger trend has reversed to down, and that the big head and shoulders pattern top may be in force.  If so, the S&P has big downside potential and I want to capitalize on it.  But I'm not getting sucked into a trap, so I want to be patient and make the market prove to me that it's time to get short. 

To keep me honest, I have to respect the potential for a triangle-like consolidation that's occuring which means there will be a very sharp and long rally coming at any time.  But if 1258.07 and 1249.05 are taken out, then that bullish consolidation potential will be significantly diminished.  So I'll wait for that breakdown to occur before I get short.

Using Elliott Waves: As Simple As A-B-C


The euro has been a choppy mess downward, making it hard to develop a high confidence wave count at the moment.  But the series of lower highs and lower lows is well intact so the path of least resistance is down.  I'm bearish the euro as long as 1.4453 remains intact.

PLEASE NOTE: THIS IS JUST AN ANALYSIS BLOG AND IN NO WAY GUARANTEES OR IMPLIES ANY PROFIT OR GAIN. THE DATA HERE IS MERELY AN EXPRESSED OPINION. TRADE AT YOUR OWN RISK.

StatCounter