Thursday, November 3, 2011

Stocks Pause at 61% Fibonacci, Euro at 38% Fibonacci....Are Tops In?


The market threw a head fake to the bears with the early morning decline then rally.  Not to mention the futures and euro were down big in overnight trading.  So it's been a wild 24 hours for the markets.  All eyes may be on Greece and every little move they do, but we wavers could care less since we know that for the longer term, Greece moves mean nothing.  We watch the wave count, and the wave count is very bearish.

Internals were mixed today as total volume kicked up to 1.05 billion NYSE shares, a slight uptick from yesterday's 955 million shares but still well short of the 1.3 billion shares traded on Tuesday's decline. S&P advancers stayed about the same at 455 from 448 yesterday, but only 85% of total volume was to the upside compared to 90% yesterday.  So the market had solid internal strength, but nothing jaw dropping to suggest any momentum is being picked up on the move the upside.  The rally still looks corrective.

Free eBook Included in EWI Article, "How You Can Make Yourself a Better Trader"


The S&P is primed for another decline as early as tomorrow (Friday).  The S&P filled its gap at 1253.16, and has paused so far at the 61% fibonacci retracement level of the previous decline.  Stocks can drop as early as first thing tomorrow morning.  If not, then they may want to push towards 1276.  Either way, the risk/reward here favors the bears right now.  Again, as long as 1292.66 remains intact I remain firmly bearish and will continue to short rallies.

Learn Elliott Wave Principle


The euro also did a head fake to the bears this morning but has not performed nearly as well as stocks have.  You can see this clearly with the comparable fibonacci retracements of the two.  Stock have so far retraced 61% of their previous decline while the euro has only retraced 38%.  The euro usually leads the stock market so this lagging behavior in the euro might be telling.  Here too the euro looks poised to fall hard again at any moment.  Since stocks and the euro should fall together, and stocks are already at the 61% retracement level, I doubt that the euro's correction will go much past the 50% retracement level at 1.3925 if it decides to continue higher in the short term.


PLEASE NOTE: THIS IS JUST AN ANALYSIS BLOG AND IN NO WAY GUARANTEES OR IMPLIES ANY PROFIT OR GAIN. THE DATA HERE IS MERELY AN EXPRESSED OPINION. TRADE AT YOUR OWN RISK.

Tuesday, November 1, 2011

Stocks Form Major Top, Destruction Just Beginning; Euro Topped, Headed Much Lower: plus Wednesday's Addendum


Wednesday's Addendum: I've posted my thoughts on where we're at in the market in yesterday's post below, but right now I just wanted to put up a quick update on today's action.  Although the rally was fairly strong as far as price is concerned, internally it did not exceed the intensity of yesterday's decline.  For example today's S&P advancers were 448 vs. yesterday's decliners at 479, today's up volume was 90% of total volume while yesterday's down volume was 93%, and most importantly in my view today's total volume was a weak 955 million NYSE shares vs. yesterday's 1.3 billion shares.  So this rally has the internal makeup of a correction, suggesting the larger trend remains down and this week's lows will be broken soon.  This corrective rally either finished at the high today, or might do so with one more leg up to a new a brief new high.  But either way, 1292.66 should remain intact, giving the bears a clear risk level.

Tuesday's Post:

Usually I refrain from making bold statements like that in today's title since usually when I do it the market does the opposite of what I say, stamping the word "fool" on my forhead.  But I want it to be crystal clear what my outlook is now for the market looking ahead.  I will try to analyze the short term movements of the market in the coming weeks/months, which means anticipating relief rallies, but I want to drive home the "bottom line", which is the big picture.  And the big picture tells me that as long as 1292.66 remains intact on the S&P cash index, stocks are extremely vulnerable to a major selling phase in the coming months which could result in over 50% of value lost.  And although the greedy little monster in my head will whisper in my ear constatnly to leverage every penny I have in derivative-type trade shorting stocks, I also need to always keep in mind that no matter how sure I am of the market's direction, I could be wrong, and I need to always protect myself.

Now to the markets.  So another failed attempt for a "man-made" stock market recovery from the government....this time in Europe.  Last week the Dow popped 400 points on government intervention.  Some common investors I know were giving me jazz because the day prior I suggested they protect their retirement accounts by putting them in all or mostly cash.  But with a rally based on government intervention it was nothing more than a sell signal for me, and I told them that.  This week now has me giving those same people jazz back, lol.  It's all in good fun.  Governments around the world will attempt to stop the implosion, and will cause short term pops only, and in the end they will all fail.  Primary wave ((3)) will do what it wants to do and only stop when it is done destroying almost everything in its path.  There's nothing any person or government can do to stop that.  The crowd is in control, and the crowd always overpowers governments and individuals, i.e. Warren Buffet, et al.

The internals today were very bearish in that 84% of NYSE stocks traded lower, 479 S&P stocks traded lower, and 93% of total NYSE volume traded to the downside.  Total volume was just under 1.3 billion NYSE shares, which is not jaw dropping, but volume should increase as Intermediate wave (3) progresses downward.  So overall, a very bearish day in price action and internals.  When combined with the wave count and other technical indicators, it looks like a major top is in.

How You Can Make Yourself a Better Trader


Updating the S&P chart I've been posting the past few weeks, we can see that this top is a major one as far as EWP is concerned.  This week's declines should be the start of Intermediate wave (3) within Primary wave ((3)).  So a 3rd wave within a 3rd wave is now underway.  This is a Waver's dream trade here.  And what it means is that this market should move lower in a hurry, destroying support like it's paper thin.  And since 3rd waves tend to do whatever they want to do and ignore most technical and fundamental indicators, it's wise to ensure I don't get in its way.

With that said, the hourly charts show that the S&P probably has to make one more new low to complete a nice 5 wave decline from 1292.  This will probably occur tomorrow morning.  It's possible a sharp recovery rally will then take place.  But as long as it stays below 1292, I will be aggressively shorting that rally, IF IT EVEN OCCURS.

Bottom line: if the above count is correct, it means that over 50% of the value in the stock market should get erased in a very short period of time.  Needless to say, I'm short.  My stop is just above last week's high at 1293.

Learn Elliott Wave Principle


The euro is getting destroyed.  The European "save the day" news only lasted about a day.  And now, as usual, the markets realize the financial system as we know it is still doomed.  So the dollar is back on fire again, crushing the euro in a 5 wave move as you can see in the above chart.  Here too I will be aggressively shorting rallies as long as last week's high remains intact.

Free Trader's eBook Until November 7th, 2011 from EWI


PLEASE NOTE: THIS IS JUST AN ANALYSIS BLOG AND IN NO WAY GUARANTEES OR IMPLIES ANY PROFIT OR GAIN. THE DATA HERE IS MERELY AN EXPRESSED OPINION. TRADE AT YOUR OWN RISK.

Monday, October 31, 2011

Stocks Go Flat After Big Rally Last Week; Evidence of Euro Top Mounts

Nothing has really changed since my last post as you'll see the same daily chart above that I've been posting for quite a while now.  Stocks are in the targeted reversal zone between the 61% and 78% fibonacci retracement levels, a common place for second waves to top.  What's important, aside from stocks having trouble gaining ground inside my reversal zone, is that after Thursday's monster rally from europe "saving the financial world" is that Friday was flat, and today is so far negative........meaning there has been abosolutely no follow through to the great save the world news and big rally last week.  Now today's trading isn't over and we could sure see a monster rally into the close.  So I'm not getting too excited here, nor am I calling a top at this moment.  All I'm saying is that so far we've had no follow through to the big rally last Thursday, and stocks are stalling in the reversal zone I've cited, two bearish signs.

The action into the close will be telling.  And keep in mind, it's the last day of the month so end of month trading can make things a bit whacky.  I have a feeling this week could get pretty wild as November gets underway, and it's a month that has been particularly brutal to the euro in past years which could be reflective of what will happen to stocks.

Free Trader's eBook Until November 7th, 2011 from EWI


And speaking of the euro, here she is.  On the daily chart you can see the top from last week took place at a very convenient spot, the 78% fibonacci retracement level.  If the big bearish candlestick on the day holds into the close, I will definitely be taking another stab at the short side on this pair.

Learn Elliott Wave Principle


In addition to the reversal right at 78%, the euro declined from the high in five waves.  This in-and-of-itself is enough to get EWP bears in on the short side in my opinion.  I'd like to get a nice bounce from here to give me better positioning on the short side though.  And when you combine this with the fact that November, and especially the Thanksgiving US holiday, tend to be very bearish for the euro, it definitely has me salivating to short this pair soon.

PLEASE NOTE: THIS IS JUST AN ANALYSIS BLOG AND IN NO WAY GUARANTEES OR IMPLIES ANY PROFIT OR GAIN. THE DATA HERE IS MERELY AN EXPRESSED OPINION. TRADE AT YOUR OWN RISK.

Thursday, October 27, 2011

Stocks Well Into Reversal Zone; Euro Slaps Me

Tuesday I thought a top in stocks might be in, but was unsure.  Then the big euro reversal yesterday made me think a reversal in both the euro and stocks was at hand.  Well, you know the result of that thinking.  If the top I'm looking for is in fact Intermediate wave (2) of Primary wave (3), then it will be a doozy when Intermediate (3) gets underway to the downside, and a big money maker for the sage bears.  However, I can almost guarantee you that catching this monster top will not be easy.  And that was proven to me yesterday.

But being wrong in the short term does not make me wrong in the longer term.  With the high on the year still intact, stocks are right in the typical topping area for 2nd waves right now, and the fact that this rally is based on some bailout nonsense in Europe, I feel this is simply just another time for me to nibble on the short side some more.  I'll get more aggressively short on a nice reversal day, or simply a sharp decline on very bearish internals.  But I have little doubt this market will not make it easy on me.  I just have to put my emotions in a box, lock them up, and keep them under the bed for now so I don't do anything stupid.

Free Trader's eBook Until November 7th, 2011 from EWI


Looking at the euro chart I posted yesterday it still looks great for a top and reversal and has me salivating to get short.  Then when I look at the above chart from this morning, I think I'm an idiot for wanting to get short.  But that's the market.  Right around major reversals in likes to suck you in and then slap you, making you feel stupid in front of your friends.  And this slap hurt, I tried twice to short this pair yesterday and got stopped out twice.  I'm waiting now for another reversal sign and will try again.  I'm not giving up simply because I was wrong yesterday.  Being wrong is part of trading.  It will happen, and happen often.  The key is to adhere to the bottom line we all have, which is to make money trading.  Well, that's what I plan to do.....make money shorting the euro.  Yesterday's decline looks like a 4th wave and the 5 wave rise into this morning looks like a 5th wave at some degree.  I'm not sure if it will subdivide further into 4th and 5th waves so I'm going to wait for now.  The top in the euro should align with stocks more or less.

Learn Elliott Wave Principle


PLEASE NOTE: THIS IS JUST AN ANALYSIS BLOG AND IN NO WAY GUARANTEES OR IMPLIES ANY PROFIT OR GAIN. THE DATA HERE IS MERELY AN EXPRESSED OPINION. TRADE AT YOUR OWN RISK.

Wednesday, October 26, 2011

Euro Reversal Signals Top, Stocks Might Follow


Yesterday I said I suspected the euro might charge quickly toward 1.4000 before topping and sharply reversing.  That's exactly what happened.  Although I got stopped out on the sharp new high, reshorted a few minutes ago because this looks like a top was put in.  If so, stocks might follow soon. 

Free Trader's eBook Until November 7th, 2011 from EWI


PLEASE NOTE: THIS IS JUST AN ANALYSIS BLOG AND IN NO WAY GUARANTEES OR IMPLIES ANY PROFIT OR GAIN. THE DATA HERE IS MERELY AN EXPRESSED OPINION. TRADE AT YOUR OWN RISK.

Tuesday, October 25, 2011

Stocks Decline at Bottom of my Reversal Zone.....Top in Place?


Internals today were very bearish in that declining stocks far outweighed advancing stocks on the NYSE and S&P.  And although volume increase slightly today overall, it was still quite light today coming in at just under 1 billlion shares NYSE.  Not sure this supports the case of a top being in right now, but volume doesn't have to enter right at the top, it can come in during the following days, and there is certainly evidence in place now that suggests Intermediate wave (2) might be over.

Free Trader's eBook Until November 7th, 2011 from EWI


Stocks reversed at a very interesting level at the 61.8% fibonacci near 1257.  I've been citing this as the bottom level of my reversal zone the past couple weeks since the 61% and 78% fibonacci retracement levels are often the stopping points for 2nd waves, it's above the prior 4th wave, and the end of Minor wave 1 down June 16, 2011 is at 1257.  All represent good resistance levels that should give Intermediate wave (2) some trouble.

I would have liked to see higher volume with a rally and reversal to be more certain that a top is in right now, but the evidence would seem to at least warrant me to start getting short here.  I will add to my short position on further rallying and /or an acceleration of the downtrend with strong volume and very bearish internals. 

Learn Elliott Wave Principle


I like to look at the SPY (S&P SPDR) as a proxy for overall stock market volume sometimes.  You can see that the big sharp decline we had this past July/August had increasing volume accompany it, while the recent Intermediate wave (2) rally has had mildly decreasing volume.  This is bearish.  You can even see the 20 day moving average trailing slightly down now while price moves higher.  This is a good sign that we're on the right track in counting this current rally as a correction, and NOT a resumption of the previous uptrend. 

There is plenty of other evidence to support this, but I don't see a reason to put a laundry list of things on here.  The bottom line is that as long as this year's high remains intact, I see substantial risk to stocks, and that once Intermediate wave (2) ends, the decline should be deep and sharp providing substantial profit potential for those on the short side.


The euro has reached a level I'm comfortable putting on a very small short position to start easing into a larger short position for the longer term.  Today's weakness may even be enough for some aggressive traders to get short with a stop just above the overnight high.  With a nice round number of 1.4000 at the 61.8% fibonacci retracement level in arms reach, it's hard to think that at least on sharp, and possibly quick, attempt to reach 1.4000 won't be made by the euro.  But no matter what my play is on how to approach the short side, I want to make sure I'm in the market when this pair finally decides to turn sharply lower on what I believe will be a move towards parity with the US dollar.  If a sharp move to 1.4000 occurs overnight and stops me out, I wouldn't be surprised if a sharp reversal takes place shortly after, prompting me to jump back in on the short side.


PLEASE NOTE: THIS IS JUST AN ANALYSIS BLOG AND IN NO WAY GUARANTEES OR IMPLIES ANY PROFIT OR GAIN. THE DATA HERE IS MERELY AN EXPRESSED OPINION. TRADE AT YOUR OWN RISK.

Saturday, October 22, 2011

Wave (2) Nearing an End; Euro Should Follow Stocks


Stocks have not done anything unexpected the past week.  Wave (2) was projected to be underway, and was projected to be strong and deep.  It's definitely filling those expectations as you can see it's already surpassed the 50% retracement level, and has barely let up at all.  I see no signs of a top so I expect higher levels next week.  However it's probably in Minor wave C of Intermediate wave (2), and wave Cs can be very sharp yet brief affairs.  So I want to be vigilant and watch the moves carefully next week.  A big rally and reversal in the same day would be a great sign that Intermediate wave (3) had started.  This wave will present an absolutely fantastic opportunity for the bears since it should result in several hundred S&P points being erased rather quickly before a bottom occurs.  So I don't want to miss it.  Further rallying from current levels will get me to start nibbling on the short side.  Once we get a good sign of a reversal then I'll start to pile on even more to the short side. 

It's FreeWeek at EWI: Get Complimentary Commodity Forecasts, Video Analysis, Trading Lessons and More!


The euro's structure remains unclear so I'm focusing on basic technical analysis here.  Although I do feel a major top has occurred in the euro back in May of this year since it aligns with the big picture in stocks.  With that in mind, the RSI's rise remains healthy while the stochastics have crossed over, suggesting at least a pullback might be coming soon.  I hold the RSI in much higher regard than stochastics, so I'm still on hold trading the euro.  And since stocks probably haven't topped yet, I'm looking for the euro to continue climbing as well.  Looking higher we see a nice resitance level at 1.4000 since it is a solid round number and it's also a 61.8% fibonacci retracement level of the big decline the past few months.  This should be a good topping area to watch for the euro. 

Much like stocks, further rallying this upcoming week will get me nibbling on the short side here, waiting for a big reversal sign for me to pile on even more to the short side.

Learn Elliott Wave Principle


PLEASE NOTE: THIS IS JUST AN ANALYSIS BLOG AND IN NO WAY GUARANTEES OR IMPLIES ANY PROFIT OR GAIN. THE DATA HERE IS MERELY AN EXPRESSED OPINION. TRADE AT YOUR OWN RISK.

Thursday, October 13, 2011

Stocks Contiue Higher in Wave (2); Euro in Same Position as Stocks

Stocks have continued higher in Intermediate wave (2) as I've been talking about the past several days.  Nothing new has developed this week to change tjos outlook so I haven't posted anything.  But today's pullback may signal that Minor wave B down has started.  I want to be clear though, I am not a firm believer in trying to dial down corrections to predict every little move as if it were a mathematically and scientifically calculated certainty.  EWP, like all technical analysis, is all about probabilities.  And with several different corrective forms Intermediate wave (2) can take on, and many of them so different from each other, trying to project the wave structure would still produce low probability trades.  My opinion.  With that said, I'm merely tracking it in the above chart with an educated guess.  I usually start counting my corrections as the simplist form, a zig-zag, and then make them more complex as the market demands.  I am neutral on stocks right now and have no positions in equities at the moment.

Bottome line: stocks were repelled at a prior swing high as well as 50% fibonacci retracement right now.  I believe this is only a temporary barrier, with the current decline possibly being the start of Minor wave B.  Once Minor B is over, Minor C higher will be in full force, a strong 3rd wave surge into my reversal zone labeled above.  Once Minor wave C is complete, Intermediate wave (2) might be complete, and then disaster should strike for stocks with a large and very destructive Intermediate wave (3).

Understanding Fibonacci
Learn to apply Fibonacci ratios to calculate price targets in stocks
- Elliott Wave International


I'm uncertain of the wave count in the euro since it started so choppy and with a lot of 3 wave moves around the high.  So I'm using basic technical analysis, and monitoring stocks in correlation to the euro since they tend to move parallel more or less.  You'll notice here that the euro is also trading at, and having trouble at, the 50% fibonacci retracement level.  Although, keep in mind I'm not using my fibonacci measurement equal to stocks since the euro's fibonacci does not start at the high on the chart.  The reason I'm not starting it at the high in the euro is because it doesn't look like a full 5 waves down from the high, so the next best thing is to measure the length of the sharp decline itself and count the retracement from that only.  Needless to say, the euro is not painting a clear picture here so I don't want to trade it.  But when stocks top in Intermediate wave (2) I will be looking to short the euro along with stocks despite the euro's lack of clarity.

Learn Elliott Wave Principle


PLEASE NOTE: THIS IS JUST AN ANALYSIS BLOG AND IN NO WAY GUARANTEES OR IMPLIES ANY PROFIT OR GAIN. THE DATA HERE IS MERELY AN EXPRESSED OPINION. TRADE AT YOUR OWN RISK.

Tuesday, October 11, 2011

1195.86 Broken, Stock and Euro Trends are Up


Stocks have been moving firmly higher the past few days leading into today's split market.  Volume was real light again at 881 million shares on the NYSE, but that should be expected since this rally is part of a larger Intermediate wave (2).  Today's volume with the fractured market MAY mean the rally is taking a break.  Regardless, the larger trend looks to be up over the next few weeks.

Understanding Fibonacci
Learn to apply Fibonacci ratios to calculate price targets in stocks
- Elliott Wave International


With 1195.86 broken it appears that Intermediate wave (1) is complete, and now the larger trend has turned up.  And Intermediate wave (2) up seems far from over.  It can take the shape of several different EWP corrective formations, all of which can be difficult to project and trade.  2nd waves tend to be deep and sharp and make one feel that new highs are on the way as if the previous uptrend is back in force.  It's at that point when everyone feels the worst is over and when the bottom falls out for wave 3.  It doesn't appear we are at that level yet at all.  So I expect higher levels. 

Looking at fibonacci retracement and resistance levels we can get an idea of where Intermediate wave (2) might reverse.  2nd waves tend to get to the 61% and 78% fibonacci levels before ending.The 61% level around 1258 looks like a good area to give the market some trouble since it's where Minor wave 1 ended, it's just above the previous 4th wave which is where a lot of corrections end, and it's a 61% fibonacci retracement level.  With that hard resistance in place, I would think the market will have a tough time getting through that area without a major upswing in volume and intensity.  But then it will have the 78% fibonacci level to contend with at 1308 which is also a prior congestion area over the past several months. 

So, in summary, the market appears to be in an uptrend for at least the next few weeks.  There will be pullbacks along the way, but overall, the trend looks up and I'm looking at the 1258-1307 area as a good reversal zone for Intermediate wave (2).

Learn Elliott Wave Principle

The euro has bottomed along with stocks and should continue higher with stocks.   I don't see any good opportunities in the euro right now, but when I see one I'll announce my thoughts on it.

PLEASE NOTE: THIS IS JUST AN ANALYSIS BLOG AND IN NO WAY GUARANTEES OR IMPLIES ANY PROFIT OR GAIN. THE DATA HERE IS MERELY AN EXPRESSED OPINION. TRADE AT YOUR OWN RISK.

Friday, October 7, 2011

Key Level For S&P; Euro Bumping Up on Trendline


Stocks continue to move higher after that big reversal that got my attention a few days ago.  Although it seems likely that 5 Minor waves down have completed and therefore finished Intermediate wave (1), the market still has work to do to prove a major bottom is in. The series of lower lows and lower highs on the daily chart is still intact.  So it's possible we'll still get another drop lower to a new low in a choppy grinding torturous 5th wave.  I am not projecting that move, but I'm simply sayings it's still on the table until a new swing high can be established, breaking the series of lower highs.  So getting too aggressively bullish here for a swing trader like me does not seem wise.  That new high is above 1195.86 in the S&P cash.  A strong break and close above that level will probably get me to finally go long in anticipation of a long and deep Intermediate wave (2) correction higher.  Until then, I'm neutral and I wait.

Bob Prechter's EWI is Offering a Free Trading eBook Until October 17th - "Trading the Line"


The euro continues higher but it too has not made a new high to break the series of lower highs and convince me the trend has turned up.  You can see I drew a hasty trendline where the euro is currently bumping up against.  I wouldn't be surprised that a strong break above that trendline will lead to an imminent breakout to a new swing high above 1.3700 shortly after.  From there, 1.4000 is the target.  I'm still unsure of the short term direction of the euro so I'm only holding a long term short position here.  A strong move above 1.3700, and 1195.86 in the S&P, will probably get me looking at the long side though for short term trading.

Learn Elliott Wave Principle


PLEASE NOTE: THIS IS JUST AN ANALYSIS BLOG AND IN NO WAY GUARANTEES OR IMPLIES ANY PROFIT OR GAIN. THE DATA HERE IS MERELY AN EXPRESSED OPINION. TRADE AT YOUR OWN RISK.

Wednesday, October 5, 2011

Stocks Continue Higher, Continue to Build Case for a Bottom; Euro Fills Gap at 1.3385, is that it for the rally?


Today's move was solid, and while the percentage of volume to the upside was similar to yesterday's at 84%, overall volume decreased today to 1.2 billion shares, down from 1.7 billion shares.  So this alone is not a confirmation that a bottom is in and Intermediate wave (2) is underway.  But the structure of the decline is far from perfect for an impulsive 5th wave, if that's actually what's occurring.  So the outlook right now is mixed, which is just another reason in my view to be neutral here and reduce risk on the short side.

Stocks: Buying Opportunity or "Free Fall" Ahead? Bob Prechter's Free Report Expires October 7th


If Minor wave 5 is in fact in right now you can see that it's a very imperfect wave, and would probably have to be labeled as an ending diagonal even if it's not symetrically correct.  This would be a good illustration of what I meant by 5th waves unfolding unpredictably and imperfect, making them very difficult and stressful to trade especially when you know a major reversal of the entire 5 wave move is about to occur at any time.

But is Minor wave 5 and Intermediate wave (1) complete?  I can't say so with a high degree of confidence.  A week or so ago I said I had little doubt that we'd get a new low in stocks before a major rally phase got underway.  And we in fact finally got that new low this week.  But now what?  What I can say is that I feel good being neutral here, and that the downside looks very risky while trying to find a good time to get long is more appealing.

Put EWP aside for now.  Notice that yesterday and today the Nasdaq has been on fire compared to the blue chips.  Again this is a bullish sign as long as it exists.  And when you combine that with the divergence between the Composite's new low not confirmed by the 100 this week, it makes me think a larger move higher might be getting underway.  Also notice the price action the past 2 months.  Price has been choppy and sideways, creating a push-pull battle between bulls and bears.  Then a break down to a new low Monday, followed by two fairly strong days Tuesday and today which took price comfortably back into the congestion area.  In my opinion, that tells us that the bears threw everything they had into pushing the market lower to continue the prior Minor wave 3's work.  But it took everything the bears had to make a slight new low before the bulls pushed the market back almost immediately to close back with the "battleground" area again today.  That tells me that it's quite possible the bears have run out of steam and momentum to push this market much lower at this point, and if the bulls choose to strike here they have a good chance of taking out the exhausted bears with a continued surge higher.  Again, the theme here is to reduce risk on the short side. 

Bottom line: the risk seems to be to the downside and I'm looking to get long for a big Intermediate wave (2) rally that should last a few months.  A move above 1195.86 would be a good sign that Intermediate wave (2) up is underway, depending on the internal strength of the move.

Learn Elliott Wave Principle


Yesterday I said the euro would charge toward 1.3400 and close the gap from Sunday and we could say that it has done so with its move to 1.3385.  I'm unsure it will continue higher from here though so I like being only 50% short with my long term position.  Any follow through higher should lead to an eventual attack of 1.4000 again.  A break down from here would probably mean new lows were just around the corner to get it to 1.3000 at least.  And it will probably take stocks down with it.

PLEASE NOTE: THIS IS JUST AN ANALYSIS BLOG AND IN NO WAY GUARANTEES OR IMPLIES ANY PROFIT OR GAIN. THE DATA HERE IS MERELY AN EXPRESSED OPINION. TRADE AT YOUR OWN RISK.

Tuesday, October 4, 2011

Stock Reversal MIGHT Have Legs; Euro Charging Toward Gap Near 1.40


Today's late day reversal was impressive as far as the price action goes and internally it was quite strong as well since with only 1 hour of rallying the NYSE had about 85% of volume trade to the upside and almost 1.7 billion total shares traded.  This rally got my attention.

Stocks: Buying Opportunity or "Free Fall" Ahead? Bob Prechter's Free Report Expires October 7th


Yesterday I said I lightened up my short positions because with the new low in the S&P it satisfied EWP's requirments for a 5th wave in an overall impulsive move.  And with 4th and 5th waves being so unpredictable I feel it's too risky to get greedy here.  Today's early morning decline looked good for the bears and the wave count I've been tracking since it suggested an acceleration of the downtrend was underway.  But when you peeled the onion back deeper you'd notice that the euro was flat and the Nasdaqs were trading much stronger than the Dow and S&P, a bullish sign.  Two big divergences in the euro and Nasdaq compared to the blue chips is an important indicator since the euro and especially the Nasdaqs tend to lead the overall stock market..  Then when I saw the market rip higher at the end of the day it was enough for me to see to get me fully out of my short positions.  I'm all about reducing risk when in a profit and that's what I'm doing.  Sure the market can cascade lower like the wave count suggests, but the risk here of a major longer term reversal higher is too great, and so I'm neutral now.

I'm not posting the wave count today because it suggests major selling ahead, which may still be true.  But the theme of tonight's post is that of caution for the bears and I don't want to have a chart with a wave count that suggests major selling ahead while saying that I'm being cautious and have removed all my short positions.  That will only cause confusion. 

Tomorrow's action will tell us a lot.  If the market stays firm and even follows through to the upside on solid volume, then I'll be looking to get long soon since Intermediate wave (2) up might be underway.  But if today's big rally is completely reversed tomorrow, then it's game on again for the bears.  So tomorrow's action is important.  Right now, I have no equity positions at all.

Learn Elliott Wave Principle


Yesterday I mentioned that the euro is getting oversold and that I lightened up some of my short positions and with today's rally I lightened up a little more.  The euro may be simply heading higher to close its gap just below 1.3400, or it may have put in a big reversal that will drift the euro higher towards 1.4000 during the next several weeks.  Either way, the euro was oversold and bounced sharply today which screams at me to reduce risk and take profits.  I do still have 50% of my original short position on, but that is more of a long term play.


PLEASE NOTE: THIS IS JUST AN ANALYSIS BLOG AND IN NO WAY GUARANTEES OR IMPLIES ANY PROFIT OR GAIN. THE DATA HERE IS MERELY AN EXPRESSED OPINION. TRADE AT YOUR OWN RISK.

Monday, October 3, 2011

Stocks' 5th Wave in Full Force; Euro Getting Oversold


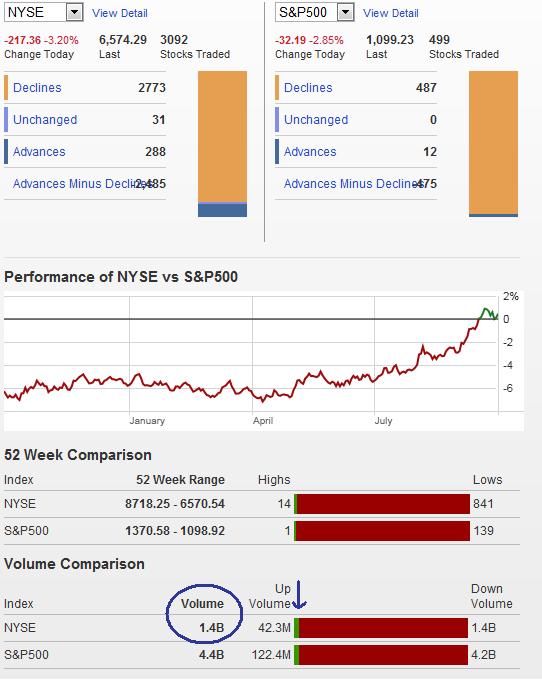
Today was a solidly bearish day with decent volume at over 1.4 billion NYSE shares traded and about 97% of all shares traded going to the downside.  But again, this is not as intense as we saw on Minor wave 3 down which had about 2.5 billion shares traded and 99% of volume trading to the downside.  So the lightening up of intensity fits well for this being a 5th and final wave as we're counting it since 5th waves have decreasing momentum compared to the previous 3rd wave at the same degree.

Stocks: Buying Opportunity or "Free Fall" Ahead? Bob Prechter's Free Report Expires Soon


The way I'm counting the S&P above suggests the major downside for Minor wave 5 is just getting underway.  However, as I've said many times, 5th waves are tricky and often imperfect.  Since I had such success shorting Minor wave 3 and some of this Minor wave 5 as of today's close, I took a lot of profits on my short position late today.  I wanted out of the S&P around 1100 in the cash market and we closed almost right on that number, which is perfect for me.  Sure the market can fall hard like the count above suggests, but since this is a 5th and final wave, and that once Minor wave 5 is over it means that a very large and long Intermediate wave (2) rally will get underway, I'm protecting my profits and minimizing risk here.

For those who are aggressive and vigilantly watch the markets they might want to hang on short with a clear and disciplined exit strategy.  Those who are more like me and take a more conservative swing trade approach might want to consider lightening up short positions considerably with hard stops on the short positions left in.  My opinion.

Learn Elliott Wave Principle


Shorting the euro the past several weeks has been very profitable.  Price action and structure does not suggest the euro is oversold, but common sense and the RSI do suggest it's oversold.  I covered half of my short positions at a hefty profit and will watch the action closely for a bullish reversal so I can exit the rest of my short positions.  This is only a short term move, I will again reshort the euro at a later time since I feel long term the euro is bearish and the US dollar is bullish.


PLEASE NOTE: THIS IS JUST AN ANALYSIS BLOG AND IN NO WAY GUARANTEES OR IMPLIES ANY PROFIT OR GAIN. THE DATA HERE IS MERELY AN EXPRESSED OPINION. TRADE AT YOUR OWN RISK.

Thursday, September 29, 2011

Thursday's Action - Stocks Working Lower; Euro May be Topping

The S&P is moving more as less as planned so there's not much to add from my last set of comments.  The S&P carried higher to the maximum comfortable retracement level at 78.6% fibonacci at 1197 before reversing sharply.  Yesterday's decline was much stronger internally than the preceding rally the day prior suggesting the larger trend is down.  Today's big rally should fade away by the end of trading.  The Nasdaq has been traversing in and out of negative territory all day despite the Dow being up triple digits all day. This is a telling sign that favors the bears.  Rallies are weaker internally and fractured whereas declines are internally strong to the downside and moving uniformly.  That's bearish.  And the wave count above suggest big moves lower if it's correct. 

Even though the structure right now may not be ideal for the resumption of the downtrend being underway, this type of imperfect movement is typical for 4th and 5th waves, i.e. 4th waves are often very choppy and unpredictable, and the following 5th wave can be even more unpredictable and imperfect.  We have been seeing that play out the past few weeks.  Yesterday's high should not be broken so I'm shorting into rallies against yesterday's high.

Read Excerpts From Robert Prechter's Newest Theorists in This Free Report


I thought the euro would charge toward 1.4000 again before topping but it's possible a top is already in, at least in the short term.  There's a near head and shoulders pattern in place now, but besides it not being textbook it still tells the same story, a rally that is in trouble.  I favor the short side here against 1.3700.

Learn Elliott Wave Principle


PLEASE NOTE: THIS IS JUST AN ANALYSIS BLOG AND IN NO WAY GUARANTEES OR IMPLIES ANY PROFIT OR GAIN. THE DATA HERE IS MERELY AN EXPRESSED OPINION. TRADE AT YOUR OWN RISK.

Tuesday, September 27, 2011

Stocks on Fire, Will They Cool? Euro Correcting 5 Down


Today's internals give me a mixed conclusion on what they represent to the short term action.  However price action suggests a possible reversal is at hand with today's late weakness.  If the bearish count I posted this morning is correct, then today's high should remain intact.  Regardless of the wave count at this point, with today's high being the risk level to stop out at, I'd be shorting into any rally I get tomorrow morning with a stop just above today's high. 

THIS MORNING'S POST IS BELOW:


As you all know from my last post, yesterday's rally was expected.  And I thought we'd get another pop today to the 1167 area I cited as well.  But today's action blasted right through 1167 like it wasn't even there.  Now, 1180-1197 marks the reversal area I'm watching now.  I see no weakness in the rally so far, but this is a 2nd wave and they are often very strong and fool us into thinking the trend has reversed.  Only a break above 1197 would be concerning, a break above 1220 would negate the bearish count you see above.

Read Excerpts From Robert Prechter's Newest Theorists in This Free Report.


The euro appears to have completed 5 waves down and is now correcting higher.  I'm looking for the euro to possibly push to just above its prior 4th wave high to the 1.4000 area again before it tops and reverses lower.

Learn Elliott Wave Principle


PLEASE NOTE: THIS IS JUST AN ANALYSIS BLOG AND IN NO WAY GUARANTEES OR IMPLIES ANY PROFIT OR GAIN. THE DATA HERE IS MERELY AN EXPRESSED OPINION. TRADE AT YOUR OWN RISK.

StatCounter