This Elliott Wave blog is dedicated to sharing Fibonacci ratios and other technical analysis for forex signals, index futures signals, options signals, and stock signals. Elliott Wave Principle puts forth that people move in predictive patterns, called waves. Identify the wave counts, and you can predict the market.
Monday, March 5, 2012
Still Waiting For Stocks to Make Tradeable Move; Euro Has Opportunities
Nothing has changed from my post, charts and the wave count remain static. I'm still waiting for a reversal pattern and impulsive move to the downside so I can establish a position. I've been on the sidelines for weeks now, simply waiting. Volume continues to be light with today barely breaking above 700 million NYSE shares. Tough to trade with volume like that, unless you're a daytrader which I am not. One of many signs that this rally has no legs is that volume has left a long time ago. The next move of consequence to provide traders a good solid opportunity should be to the downside. But we have to wait until the market is ready. But I'm on high alert....looking for signs of a reversal, knowing that many others are doing the same so there will probably be a fake out or two to the downside before the real heavy selling gets underway. So as always, I'll be managing risk appropriately and looking for a shorting opportunity.
Learn Elliott Wave Principle while EWI is offering a free online edition of Bob Prechter's Elliott Wave Principle - Key to Market Behavior.
The bottom line is that the euro appears to be falling impulsively. Being so early in the decline makes it hard to determine the degrees of trend with high confidence, but the subdivisions of the move is undoubtedly impulsive nonetheless. So the path of least resistance for now is down. The euro should not exceed 1.3485 in the near future, so shorting with stops just above that level seems like a good opportunity to me, especially if a big rally occurs from current levels which would allow me to short at a better price.
Who's Going to be President? Ask the Stock Market.
PLEASE NOTE: THIS IS JUST AN ANALYSIS BLOG AND IN NO WAY GUARANTEES OR IMPLIES ANY PROFIT OR GAIN. THE DATA HERE IS MERELY AN EXPRESSED OPINION. TRADE AT YOUR OWN RISK.
Tuesday, February 28, 2012
New Highs Slap Wavers....AGAIN; Euro Correction Looking Clearer
I haven't posted anything in a while because there was nothing new to add from my last post. The market has continued the slow grind higher with no clear signals to establish a tradable position in my view. But this week the S&P confirmed the Dow's new high, which is a significant event, and therefore the reason I'm writing today. The major bearish setup was that the Dow made a new high while the S&P did not, so any sharp downturn would be a great signal for the bears to jump in short for what could have been a major selloff. But that setup was negated with the new high. It means again, wavers were wrong in calling Primary wave ((2)) complete, and again we have to look higher and continue stretching out the count. It has been tiresome and frustrating to say the least.
Although I have not taken a position for quite some time since I thought the best move was to get short when opportunities arose. But the fact that I missed this long gring higher frustrates me. Again, I find myself standing on the sidelines with no position, simply waiting for an opportunity to get short. It won't be easy at this point. I expect volatility to pick up when a top starts forming, and most likely at least one fakeout will occur. So I'll remain disciplined and keep risk tight when trying to catch a top and short this market. But for now, it's a waiting game.
Don't forget to take advantage of free forex analysis from EWI until tomorrow!
The euro's correction seems a little more clear now. It's completing a Minor A-B-C corrective rally with wave B tracing out a nice flat correction, and wave C tracing out a nice impulse pattern with a wave ((iv)) down and wave ((v)) up to complete the entire corrective pattern. Once we get a new high, I'll be looking to get short this pair on any reversal pattern. Stocks MAY follow soon after.
Forex Market Insight: EUR/USD Rallies...Why?
PLEASE NOTE: THIS IS JUST AN ANALYSIS BLOG AND IN NO WAY GUARANTEES OR IMPLIES ANY PROFIT OR GAIN. THE DATA HERE IS MERELY AN EXPRESSED OPINION. TRADE AT YOUR OWN RISK.
Wednesday, February 15, 2012
Stocks Continue Grind; Euro Rally Faltering
This chart illustrates why I haven't been posting much lately. Stocks have simply floated higher in a an unconvincing, yet very persistent, grind to higher levels. Just look at this chart and think to yourself how you would write a post based on this crap above unfolding. The lack of conviction and volume on the rally has left me skeptical of its ability to be sustained much further. But it has done so, seemingly on an empty gas tank. As I've said in past posts, this can continue even longer, and without evidence of a top I don't think it's wise to short here. I'm waiting for a reversal pattern to form, and hopefully it will be accompanied with solid volume, before I attempt shorting stocks. The divergence in price between the Dow's new high and the S&P's lack of a new high remains in place. So if a reversal pattern forms with that divergence still in place, it will leave a nice high probability shorting opportunity in my opinion.
Learn How to Apply Fibonacci Retracements to Your Trading
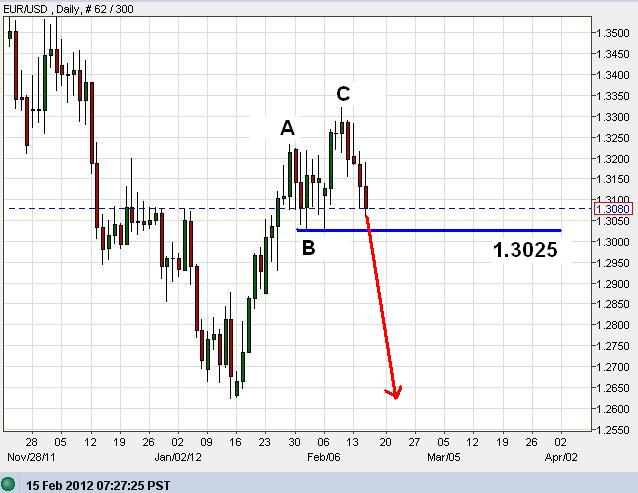
The euro has a couple options here: one is bullish, one is bearish. Which I am well aware is an absolutely useless statement at this moment in time. But let's look at the options to see how things will setup for a trade in the future. The bullish outlook has the move from 1.2625 to 1.3225 as an impulse move (probably an A wave) and the up-down movement since then can be a "flat correction" (probably a smaller degree ((a))((b))((c)) of B wave). This means that the current decline is simply wave ((c)) that will come down just below 1.3025 before bottoming and then undergoing a fierce rally to the upside. Okay, so that's the bullish view. The bearish view has the entire rally, from 1.2625 to 1.3325, a 3 wave correction that has completed. The result will be continued selling pressure for the foreseeable future which will take the euro well below the recent 1.2625 low. Right now, the euro is simply making a stair-step decline, with big looping moves to the downside, and therefore there is no impulsive pattern to help further analyze the bigger picture. However, the series of lower lows and lower highs means the current trend is down at the moment.
My approach is this; wait for a move below 1.3025 and see what happens. Continued selling pressure and closes beneath that level will reduce the likelihood of the bullish outlook since wave ((c)) of a flat correction shouldn't go too deep as an EWP guideline (not a rule though). Since trading is all about probabilities, I think the probability at that point would favor the bearish view and getting short at any opportunity. On the other hand, if the euro makes a quick dip to 1.3025 and then reverses sharply higher, I will jump on the long side since it would appear that the bullish flat correction might be unfolding and the move higher will probably be a sharp and deep impulsive move higher for wave C.
But unfortunately, at this point we are only left with concluding that the euro will either go up, or it will go down. A completely useless analysis at this point in time. However, by looking at our two options of wave patterns, we can sit and wait for more price action to unfold to work ourselves into a high probability trade.
Learn Elliott Wave Principle (EWP)
PLEASE NOTE: THIS IS JUST AN ANALYSIS BLOG AND IN NO WAY GUARANTEES OR IMPLIES ANY PROFIT OR GAIN. THE DATA HERE IS MERELY AN EXPRESSED OPINION. TRADE AT YOUR OWN RISK.
Friday, February 10, 2012
Intermarket Divergence in Place = Bearish for Stocks; Euro Pullback is Bearish
The Dow's new high has created angst in the EWP community, and rightfully so I suppose. For EWP purists it's tough to explain it away and still try to justify a major top in the overall market. I am more flexible with my analysis and although I'll never violate an EWP rule, I use EWP as a basis for my overall analysis, not the be-all know-all form that must be adhered to as if it were an infallable law written in stone. The key is make sure we don't violate any EWP rules, and use our best objective judgment when using EWP guidelines. I will say, with the experience I've had in these markets, EWP is the most reliable out of all other forms of technical analyis I've tried. I can't tell you how many times when all technical indicators point to the market moving in one direction, but the EWP count suggests the opposite, the EWP count proves to be correct. It happens a lot.
With that little preamble out of the way, let's try to take a basic common sense look at the market. The Dow made a new high, suggesting that its Primary wave ((2)) did not end last may as previously projected. The Dow only has 30 stocks in it, and is the bluist of the blue chips for that matter. So I'm not sure it's the best proxy for crowd psychology as EWP is based on. This is why I follow the S&P, it has 500 stocks (or close to it), and is much more diverse and touches a much larger crowd than the Dow can. The larger and more diverse the crowd, the more reliable our EWP wave counts will be. The S&P has so far failed to confirm the Dow's new high, keeping the original wave count that its Primary wave ((2)) has topped already. And with today's modest decline, it leaves the potential for a major intermarket divergence to be in place between the Dow and S&P.
The bottom line is that the market rally is stretched, I think it's hard to argue that. So what are the plays here? 1) Getting long here at this point in the rally without any meaningful pullback? I don't think so. Not wise in my opinion. 2) How about getting short now with a stop above yesterday's high? This seems like a great risk/reward opportunity I'm jumping all over, despite it being a Friday. 3) And lastly, sitting on the sidelines doing nothing is another options. Certainly a viable option, at least until we get confirmation a significant top is in. Regardless of the choice, trading is all about probabilities, not certainties. So I make every trade with assumption that I'm going to be wrong, and manage my risk accordingly.
Do Low Interest Rates Power Stocks Higher?
Above is another possibility for the Dow. It suggests that it's in an Intermediate degree "flat correction". This suggests the larger trend is still up, and pretty much destroys Prechter's call for the past several years. So I'm not confident in this count at all. However, it's worth noting this count for at least the short term because even though the count suggests a larger bullish move is still underway, the downward correction still has to undergo a major Intermediate wave (C) pullback that will be fast and deep, about 2,500-3,000 points. And although it seems unlikely, it's still a valid wave count and therefore must be respected.
The bottom line is that I think the best plays here are to look for shorting opportunities with tight risk and then jump on them, or just wait on the sidelines until solid confirmation of a top comes in. But getting long here at this point, just doesn't seem like the risk/reward is on your side.
Learn Elliott Wave Principle (EWP)
The euro appears to have completed an A-B-C correction and is now pulling back. Whether a major top is in, or just a short term top is in, is still in question. For currencies, I usually don't jump in on a Friday since Sunday afternoon when the market reopens we often get a gap in price which is very tradeable. I want to get short so I hope we gap-up Sunday afternoon so I can short aggressively at a better price than today AND get the odds of a gap-close on my side. On the other hand, if the euro gaps lower I can simply wait to get short when it rallies to close the gap. Either way, I feel I can get the most optimal positioning on the short side if I wait until Sunday afternoon. Either short on a big gap-up, or if it gaps-down then just wait for it to rally and close the gap before getting short.
Learn How to Apply Fibonacci Retracements to Your Trading
PLEASE NOTE: THIS IS JUST AN ANALYSIS BLOG AND IN NO WAY GUARANTEES OR IMPLIES ANY PROFIT OR GAIN. THE DATA HERE IS MERELY AN EXPRESSED OPINION. TRADE AT YOUR OWN RISK.
Friday, February 3, 2012
Line in the Sand....the Rubicon 1370.58
February 9, 2012: I don't have anything new to add. The Dow made a new high while the S&P has so far lagged behind, failing to exceed 1370.58. If a reversal occurs with the S&P failing to make a new high above 1370.58, then there would be a major intermarket divergence in place suggesting a major top had formed. But entering short prior to that is purely speculation in my opinion. I'm waiting for a reversal pattern to form, and if it occurs before the S&P can exceed 1370.58, then I'm jumping in big on the short side. Until that happens, I'm simply waiting, doing nothing but trying to determine if it's possible to twiddle my thumbs long enough to burn off the two donuts I ate this morning, and to see if I can twiddle them fast enough to break the sound barrier.
Internals illustrate a typical Friday behavior where volume is fairly soft and a large majority of up volume accompanied the rally relative to down volume. Nothing conclusive here since price moved right in line with these internals as would be expected.
I thought today would be a great day for a nice reversal to the downside and hopefully leave a setup to either short today, or early Monday. But Mr. Market wanted to annoy me today, and he succeeded. The rally remains intact and I see no reason to "guess" and just short here unless you're a gambler. I'm waiting for evidence of a reversal, and will load up on the short side upon confirmation of a reversal if it's not too late when that happens. The market is moving higher, contrary to what the evidence I see suggests it should be doing. When this type of thing happens, I want to simplify things and focus on the bottom line. The bottom line is that 1370.58 is key to the bearish wave count, and the bearish case as a whole. The Dow came within just a few points of exceeding its wave ((2)) high today, so things are a bit shakey for the EWP bears right now.
But as along as 1370.58 in the S&P cash index remains intact, the bearish wave count remains valid and so any good sign of a reversal on the short term charts is worth taking a shot at the short side with a stop at the day's high, or just above "the Rubicon" level at 1370.58. A perfect scenario for the bears would be for the Dow to exceed its wave ((2)) high Monday while the S&P stays below 1370.58 and then a big reversal occurs. This type of divergence in two major indices would be deadly bearish.
Learn Elliott Wave Principle (EWP)
Although the euro has been able to make a new low and has not been able to make a new high, there has been no follow-through to the downside. As a result, there has been a net sideways action the past week or so. This consolidative pattern conveys a similar message that an EWP triangle conveys; which is that the euro is pausing from its uptrend before it thrusts higher in a sharp and deliberate move to new highs. Now since this is not an official EWP triangle the euro has formed, so I can't say the thrust to a new high will happen with any level of certainty. But I will say that the odds are slightly tilted toward the bullish side for right now.
Technical Indicators: A Love-Hate Relationship
PLEASE NOTE: THIS IS JUST AN ANALYSIS BLOG AND IN NO WAY GUARANTEES OR IMPLIES ANY PROFIT OR GAIN. THE DATA HERE IS MERELY AN EXPRESSED OPINION. TRADE AT YOUR OWN RISK.
Tuesday, January 31, 2012
Stocks Remain Flat; Euro Prints Head and Shoulder Top
Thursday, February 2nd note: I just wanted to touch base with a quick note to state that I see no new developments in the market since my last post, as seen below. The market continues to be "on pause" it seems and has been in this mode for quite some time. The general malaise in the market for the past few weeks still tells me a big move is coming soon. And the evidence suggests that this move will be to the downside. The euro has made a new low and although the recovery was deep, it still failed to make a new high. Now a series of lower highs are in place, which is the definition of a downtrend. Unfortunately, the moves are almost sideways and there's no follow-through to the downside at the moment. So it doesn't give me much confidence in calling a top at the moment. I'm currently short the euro, but I wouldn't doubt a sharp new high is around the corner with the action the way it is, so I'm managing risk accordingly. I'll be back with new info as it arises.
It's tough to write new blog posts when not much has changed since the last post. It's tempting to create drama where it doesn't exist, or to overthink simple setups. I'll spare you from both. This post is simply to add on to the previous post and mention the few new developments since then.
Today actually saw small spike in volume that's worth noting. NYSE traded just over 1 billion shares which is far from jaw-dropping, but certainly strong relative to volume the past few weeks. Unfortunately, the market closed mixed with some indices up and others down on the day. Since this behavior is occuring at the end of an uptrend, it's reasonable to think that this indicisiveness and volume is the result of a top forming. So we'll see. But volume possibly re-entering the market now means we should get some moves of significant - finally.
Technical Indicators: A Love-Hate Relationship
The daily stochastic I've been talking about the past few weeks has finally started trending down. Prices are now certainly free to follow. This is quite an elementary indicator, but one of many in the toolbox, and I'm using it strengthen the other bearish evidence I've laid out, as well as illustrate how momentum appears to shifting to the downside.
Credit Crisis: Are We Set Up for The Perfect Storm?
There is certainly a lot of evidence for a top and reversal at any moment, and there has been for weeks in my view. But unfortunately on a short term basis EWP does not support a top being in right now. This is because the recent pullback looks like a 3 wave drop, and it didn't get a chance to subdivide into an impulse move since today's rally broke above the previous high, which cemented the 3 wave structure in place. This is not a death blow to the bearish case, it's just a short term indicator that suggests a top may not be in right at this moment. So it keeps us honest, and as always, it keeps us managing risk appropriately.
Learn Elliott Wave Principle (EWP)
And lastly, and certainly not least since this is probably the most significant development of everything I follow. The EUR/USD appears to have formed a head and shoulders top and has broken beneath the neckline today. The uptrend has been broken and now the bears just need a little follow-through to the downside to be even more confident that a top is in. I've already entered a short position with a stop just above today's high. Any rallly that stays below today's high will only get me to short more.
If the euro has topped, it's most likely entering a very bearish phase and will move sharply lower from here. This also lends itself well to a top forming in stocks as well since the two often move in the same general direction.
PLEASE NOTE: THIS IS JUST AN ANALYSIS BLOG AND IN NO WAY GUARANTEES OR IMPLIES ANY PROFIT OR GAIN. THE DATA HERE IS MERELY AN EXPRESSED OPINION. TRADE AT YOUR OWN RISK.
It's tough to write new blog posts when not much has changed since the last post. It's tempting to create drama where it doesn't exist, or to overthink simple setups. I'll spare you from both. This post is simply to add on to the previous post and mention the few new developments since then.
Today actually saw small spike in volume that's worth noting. NYSE traded just over 1 billion shares which is far from jaw-dropping, but certainly strong relative to volume the past few weeks. Unfortunately, the market closed mixed with some indices up and others down on the day. Since this behavior is occuring at the end of an uptrend, it's reasonable to think that this indicisiveness and volume is the result of a top forming. So we'll see. But volume possibly re-entering the market now means we should get some moves of significant - finally.
Technical Indicators: A Love-Hate Relationship
The daily stochastic I've been talking about the past few weeks has finally started trending down. Prices are now certainly free to follow. This is quite an elementary indicator, but one of many in the toolbox, and I'm using it strengthen the other bearish evidence I've laid out, as well as illustrate how momentum appears to shifting to the downside.
Credit Crisis: Are We Set Up for The Perfect Storm?
There is certainly a lot of evidence for a top and reversal at any moment, and there has been for weeks in my view. But unfortunately on a short term basis EWP does not support a top being in right now. This is because the recent pullback looks like a 3 wave drop, and it didn't get a chance to subdivide into an impulse move since today's rally broke above the previous high, which cemented the 3 wave structure in place. This is not a death blow to the bearish case, it's just a short term indicator that suggests a top may not be in right at this moment. So it keeps us honest, and as always, it keeps us managing risk appropriately.
Learn Elliott Wave Principle (EWP)
And lastly, and certainly not least since this is probably the most significant development of everything I follow. The EUR/USD appears to have formed a head and shoulders top and has broken beneath the neckline today. The uptrend has been broken and now the bears just need a little follow-through to the downside to be even more confident that a top is in. I've already entered a short position with a stop just above today's high. Any rallly that stays below today's high will only get me to short more.
If the euro has topped, it's most likely entering a very bearish phase and will move sharply lower from here. This also lends itself well to a top forming in stocks as well since the two often move in the same general direction.
PLEASE NOTE: THIS IS JUST AN ANALYSIS BLOG AND IN NO WAY GUARANTEES OR IMPLIES ANY PROFIT OR GAIN. THE DATA HERE IS MERELY AN EXPRESSED OPINION. TRADE AT YOUR OWN RISK.
Thursday, January 26, 2012
Stocks' Rallying in a Final 5th Wave into a Top; Euro Uptrend Well Intact
The short term wave count suggests that price is rallying in a tiny 5th wave that should mark a long awaited top. I know, I'm playing the same ole' tune I have been for the past few weeks yet the market goes higher. But this is what I see and so this is how I call it. I've been establishing small short positions on every new high but won't get in heavy on the short side until a topping formation occurs. Right now, the stock uptrend is still intact, and fighting the trend is never a good idea in my opinion. The easiest money I make is when I identify the larger trend fairly early, then just keep looking for opportunities to take short term positions with that trend. Right now we don't have that. What we have is an overstretched and weakened uptrend that has yet to break. I feel there's too much risk getting bullish and holding that long position iin overnight trading. Day traders may want to continue on the long side until the trend has been confirmed to have reversed to the downside. But I'm a swing trader, and I'm not getting long right now because there's simply too much risk in holding overnight positions. Patience is key right now.
And for those who may not have done so already, check out Elliott Wave International's free 14-Page eBook, "How You Can Use Fibonacci to Improve Your Trading". I always take advantage of free tools from reliable analysts.
Earlier in the week I said that the euro may rally to 1.3050 to form a right shoulder of a head and shoulders pattern before reversing lower. Well, that's what happened. Unfortunately it had no follow through and later rallied sharply to new highs surrounding the Fed action. It's clear the uptrend is still intact, and shorting is not wise here. Looking at the daily chart above you can see how choppy the decline was from 1.4200 and then how sharp the rally from 1.2600 has been. So the rally is much stronger than the decline, raising concern that this rally may get some legs and continue for a while. The key will be to watch for this rally to falter; either with some choppy price action, or a series of rallies and declines giving it a net sideways result for several days or weeks. But right now, I'm not getting short.
Lastly, notice how the RSI has come far out of oversold territory on this rally. Viewing this from bearish eyes it could mean that this rally is simply allowing the euro's downtrend to "recharge" by squeezing out a lot of shorts, moving sentiment out of extremes, and getting momentum geared up for another big decline. But this is all speculation for future action. This will only be important if we later see the euro rally faltering, or we get a solid reversal pattern. So right now, it's bullish or nothing in my view.
Learn Elliott Wave Principle (EWP)
PLEASE NOTE: THIS IS JUST AN ANALYSIS BLOG AND IN NO WAY GUARANTEES OR IMPLIES ANY PROFIT OR GAIN. THE DATA HERE IS MERELY AN EXPRESSED OPINION. TRADE AT YOUR OWN RISK.
Tuesday, January 24, 2012
Strong Sell Signal in Place; Euro Slaps Me
Comments from Friday's post remain in play today. Volume today was extremely light suggesting major market players continue waiting on the sidelines. News-watching seems like a good choice since the wave count and momentum indicators suggest a sharp reversal at any moment. Maybe some Fed news will shake this market up in either direction. So be alert.
And while you're waiting for the market to give you a reason to stay awake, check out Elliott Wave International's free 14-Page eBook, "How You Can Use Fibonacci to Improve Your Trading". I always take advantage of free tools from reliable analysts.
The projected wave count remains unchanged. The daily stochastic has been overbought for some time now, and needs relief, i.e. it needs to fall. The short term average crossed down today so it's possible a top in price is in, although I would definitely not put in a short position solely based on this indicator. It is quite primitive and not a good stand alone indicator. It's much better used in conjunction with several other pieces of analysis, to include the wave count and internals for me.
Learn Elliott Wave Principle (EWP)
I got so bored with this market I did not notice that the market's lethargy triggered and then executed a VIX sell signal. I only realized this after reading Steve Hochberg's Short Term Update from EWI. The daily close beneath the lower bollinger band, and then the later close above it, executes a sell signal. This is the most reliable timing indicators I know of. Usually a reversal in stocks occurs within 3-4 days suggesting a reversal will occur this week in stocks.
The euro stood me up, reached back, and laid a huge slap down on me.....I mean just a hard 5 across the eyes. I had a sell stop order almost right at the bottom this week which executed and then reversed sharply to a new high and stopped me out. I mean, I lost money and had the position closed before I even got up in the morning. Slap! But that's the game. There's a long reversal wick in place right now and 1.3050 should stop any rally attempt if a top is in and a head and shoulders pattern wants to unfold. My jaw still hurts though, so I'm waiting for more selling and a series of lower lows to get printed before I tackle this one on the short side again.
PLEASE NOTE: THIS IS JUST AN ANALYSIS BLOG AND IN NO WAY GUARANTEES OR IMPLIES ANY PROFIT OR GAIN. THE DATA HERE IS MERELY AN EXPRESSED OPINION. TRADE AT YOUR OWN RISK.
Friday, January 20, 2012
Stocks Push Higher, But Still Look Weak; Euro Looks Strong
Wake up everybody! Wake up!! I know the market is boring right now but we have work to do :-) The market has continued it's slow boring hump higher on weak internals and volume. Although this can continue even longer, the risk right now is with the bulls in my view. Momentum indicators are overbought, volume refuses to accompany the rally, and the price action is very choppy. All spell out that when this rally ends, the move down will be sharp, fierce and probably quite deep. Today's volume was a bit strong relative to the previous days, but that's because today was options expiration day which usually means we get a surge in volume. But relative to most options expiration days the past few years, today's volume was very light. We usually see well over a billion shares traded on options expiration.
When you're a bear and growing impatient with a sloppy rally, we can tend to over-analyze every little thing on the bearish side and read too much into it. I don't want to do that here. But it's worth noting that the overall market today was fractured with the Dow doing quite well, the S&P barely eeking out a gain, and the Nasdaq closing slightly negative. With options expiration out of the way, and the evidence of a weak rally the past few weeks, it's quite possible early next week could be the pullback we've been waiting for. Timing is very difficult, as you can probably see from the last few posts I've put up which practically say the exact same thing. So I simply want to be ready for a decline, but not be positioned as if the decline will immediately occur. This choppy sideways-to-up action can continue for a while longer. So keeping risk tight, and my finger on the sell trigger seems like a wise choice at this time.
Five Fatal Flaws of Trading
If all I had were elementary indicators like the overbought stochastic and a fractured Friday market to tell me the market is topping, then I might as well just throw my money out the window or burn it in a pile to keep warm because I'd be losing my money in the market anyway. But the fact that the wave count and internals support the outlook of a major top forming, these small indicators simply add to the bearish outlook and can help us get our timing down a little better. The stochastic has been maneuvering around overbought territory for a while now, and needs to come back to earth before another major rally phase can get underway. Oftentimes the stochastic will start moving down prior to prices establishing a downtrend. And since we don't have that yet, it certainly would not be wise to use this indicator to get short right now. But if the stochastic starts trending down and prices don't, I might nibble on the short side a bit even if there's no sign of a top. A long time overbought stochatic starting a downtrend after a weak rally in prices seems like a good shorting opportunity.
Learn Elliott Wave Principle (EWP)
The euro stopped me out a few times in the past week or so. So I'm on the sidelines again. With the previous swing high taken out this week, the short term downtrend has been broken so we need to look for higher levels until it proves to us it has reversed trend to the downside. There's a nice confluence of support levels in the 1.2875-1.2900 area that I'm watching right now. At 1.2875 you have the previous swing high, at 1.2885 you have today's low, and at around 1.2900 next week you'll have the base of an ascending trendline. So it's quite simple, a a close below 1.2875 would get me to short the euro again with a stop just above today's high. Until then, I think it's best the bears wait this rally out. The euro has been declining almost non-stop for the past several months now and a sharp and deep corrective rally would not be out of the question. Keeping risk tight here until the euro proves that the uptrend is no longer intact seems wise to me.
PLEASE NOTE: THIS IS JUST AN ANALYSIS BLOG AND IN NO WAY GUARANTEES OR IMPLIES ANY PROFIT OR GAIN. THE DATA HERE IS MERELY AN EXPRESSED OPINION. TRADE AT YOUR OWN RISK.
Tuesday, January 17, 2012
Stock Pullback is the Next Big Move; Euro Rally Creates Good Shorting Opportunity
There's nothing new to add to prior posts. Stocks continue to flip flop around with an upside bias on light volume and diverging momentum suggesting the next big sharp move will be to the downside. Ideally, 1356 in the S&P cash index needs to hold for the bears to still have a high probability trade in my opinion. I'm adding to my current short position as the market rises.
Five Fatal Flaws of Trading
On the hourly chart, the RSI is diverging drastically from prices. This doesn't signal when a turn is coming necessarily, but it does suggest underlying weakness and that a pullback is probably the next big move ahead. Also notice that the daily stochastic is starting to trend downward. Again, not necessarily a good timing indicator, but a suggestion that the next big move will be down. To me, the only question is whether or not the upcoming pullback is going to just be a temporary decline before moving higher, or if it's going to be a major top signaling the next major downphase has started. The wave count suggests the latter. But I can't say with any level of certainty when stocks will stop floating higher, so I don't want to just load up on the short side right now since I could encounter a lot of pain if this float higher continues much longer. And I don't want to wait for the decline to jump in short because it may decline overnight several hundred Dow points and I'll miss most of the move if it turns out to just be a short term decline. So I decided to simply just add small short positions as the market moves higher and average into the market on the short side. It's the best way to play this type of market and reduce risk in my opinion.
Learn Elliott Wave Principle (EWP)
Although stocks are boring me to death, the euro is moving around quite nicely, making it good to trade right now. The huge rally we got today was a good opportunity for the bears who may have missed the big previous move. I added short today at 1.2750 and put my stop just above today's high. The chance of a top here is solid, and the risk/reward for the bears here is excellent. So in my opinion, it's worth taking a shot at the short side here. If today's high is broken in the overnight European session, then I'll simply wait for another reversal pattern to reshort as long as 1.2877 remains intact.
PLEASE NOTE: THIS IS JUST AN ANALYSIS BLOG AND IN NO WAY GUARANTEES OR IMPLIES ANY PROFIT OR GAIN. THE DATA HERE IS MERELY AN EXPRESSED OPINION. TRADE AT YOUR OWN RISK.
Thursday, January 12, 2012
Stocks Putting us to Sleep......Before the Collapse? Euro Surprises to the Upside, Shorts Squeezed
Stocks are putting me to sleep. Thank goodness for currencies which have been moving sharply lately. NYSE volume was a whimpy again today with only 768 million shares traded, and uppers vs downers slightly tilted toward the bulls' advantage. Nothing to really make of this though with such light volume and little price movement. Both the bulls and the bears appear to have better things to do, or they're all in room with a carbon monoxide leak. Either way, when volume re-enters, the downtrend should resume. Until then, try to stay awake.
The European Debt Crisis and Your Investments
The S&P continues to defy gravity and as a result, it's starting to concern me slightly as a bear. I would have thought the market would have tanked by now but it's been holding up fairly well, albeit without any volume which is still significant. Price is near the comfortable maximum retracement level of 78%, so a decline now would be nice. I still doubt the market will push much higher from current levels, a pullback of some kind is warranted before any further significant push. So the short term advantage goes to the bears to enter on weakness as soon as it arises in my opinion....especially if volume accompanies the move down. The count above remains valid and my top choice.
Learn Elliott Wave Principle (EWP)
Momentum indicators above slightly favor the short term topping outlook the wave count suggests. The RSI has a very slight divergence in place right now to where a decline from current levels would confirm the divergence and open the door to the possibility that a very large decline is underway, such as the wave count suggests. Also, the stochastic has been grinding away in overbought territory for a while. Another sign of at least a short term pullback is near.
With the evidence at hand, it seems quite clear that at least a short term pullback is coming soon. So if I were to play this market short term I would be looking to short on weakness any minute. And if high volume accompanies the move, I'd load up even more short. If I were to play this market more long term, I'd wait for the structure and strength of the upcoming pullback, mainly to see if volume consistently accompanies it and the decline is impulsive. If so, I'd get short for a longer term position. It's important for the longer term traders to be patient if a decline comes because the market may be simply "recharging" before surging higher again.
Download "The Most Important Investment Report You'll Read for 2012" Now.
With a high confidence euro count still eluding me, I have to rely on basic technical indicators. And for the past several months, despite their simplicity, these indicators have worked very well for me. The key element to the euro is the impulsive structure of the declines, and the series of lower highs and lower lows which has been the theme lately. Unfortunately for the bears. last night broke that pattern, and the bulls did so with strength. You can see the area where I marked the euro's bullish candles on the above chart. You have a long wicked bullish candle immediately followed by a long bullish candle. And what's significant is that this big strong move occured at the previous swing high. So the bulls broke the downtrend with conviction last night, at least for the short term.
I personally think this was just a short squeeze. I think there were just too many euro bears in the market and they got squeezed last night. But nonetheless, the basic trend following I'm using suggests a bottom is in for the euro for the time being. Until another big reversal pattern occurs to the downside, or an hourly close beneath 1.2700 occurs to negate the big bullish move last night, I'm on the sidelines.
PLEASE NOTE: THIS IS JUST AN ANALYSIS BLOG AND IN NO WAY GUARANTEES OR IMPLIES ANY PROFIT OR GAIN. THE DATA HERE IS MERELY AN EXPRESSED OPINION. TRADE AT YOUR OWN RISK.
Tuesday, January 10, 2012
Stocks Float Higher, Should Reverse Sharply Soon; Euro Still Correcting Before Collapsing
The S&P continues to float higher, but nothing changes from the previous forcast. There are numerous internal divergences to price occurring, along with momentum divergences like the RSI as seen above. Volume remains very light as well. There is really nothing behind this rally at all in my opinion. Those types of rallies usually end with a big reversal, so be aware in the coming days. With the evidence at had, it seems clear to me that this move is part of a correction, and probably the final stages of a correction. The bears are lying low and waiting for a good opportunity to strike. Meanwhile, the few people in the market are able to float it higher. Look for a sharp reversal at any moment, that will bring a good shorting opportunity in my opinion. I will get short as soon as I can and place my stop just above the top of that reversal.
Download "The Most Important Investment Report You'll Read for 2012" Now.
The euro has managed to get of the matt a bit here and push a little over 100 pips higher from its low. But you can see that after the initial push to 1.2780, the rally has lost steam and moved choppy and almost sideways. Today the rally appears to be faltering and is trading right at the top of that initial surge at 1.2780. A solid break below that level will be the first sign the rally MIGHT be at an end. A sustained break below 1.2720 would most likely signal another major top is in. But I'm not waiting for that. I'm already adding short right now, and if it rallies higher then I'll short some more. Nothing about the euro's charts or the overall European and US economies suggest a euro bottom (US dollar top) is in place. So I'm focused on the short side big time right now.
Learn Elliott Wave Principle (EWP)
PLEASE NOTE: THIS IS JUST AN ANALYSIS BLOG AND IN NO WAY GUARANTEES OR IMPLIES ANY PROFIT OR GAIN. THE DATA HERE IS MERELY AN EXPRESSED OPINION. TRADE AT YOUR OWN RISK.
Download "The Most Important Investment Report You'll Read for 2012" Now.
The euro has managed to get of the matt a bit here and push a little over 100 pips higher from its low. But you can see that after the initial push to 1.2780, the rally has lost steam and moved choppy and almost sideways. Today the rally appears to be faltering and is trading right at the top of that initial surge at 1.2780. A solid break below that level will be the first sign the rally MIGHT be at an end. A sustained break below 1.2720 would most likely signal another major top is in. But I'm not waiting for that. I'm already adding short right now, and if it rallies higher then I'll short some more. Nothing about the euro's charts or the overall European and US economies suggest a euro bottom (US dollar top) is in place. So I'm focused on the short side big time right now.
Learn Elliott Wave Principle (EWP)
PLEASE NOTE: THIS IS JUST AN ANALYSIS BLOG AND IN NO WAY GUARANTEES OR IMPLIES ANY PROFIT OR GAIN. THE DATA HERE IS MERELY AN EXPRESSED OPINION. TRADE AT YOUR OWN RISK.
Thursday, January 5, 2012
Stocks Trying to Breakout, But Still No Volume; Euro Tops
Stocks have done nothing the past two days so I wasn't going to even post anything today but the action in the euro demands attention. Looking at today's internals you can see that volume is still declining and overall very light, and that there is a general malaise amongst market participants after the New Year surge. So the New Year kicked off with a typical bullish day, but there's been no follow-through to the rally. That's overall bearish in my view. When volume re-enters, stocks should fall soon afterward, if not immediately.
Why Choose the Wave Principle?
Nothing has changed from my last post, so see my comments and wave count below in the previous post for context of today's thoughts. Stocks have been range bound for a while now, albeit not perfect at all. I don't recommend trading off this since it is quite imperfect, but it is something to watch. On the daily chart you can even see what some call a "pennant", but we wavers call a "triangle". Only it doesn't fit EWP's rules for a triangle so I'm not posting it here. But it's still worth noting that this pennant formation has made it onto CNBC where some analysts have mentioned it looks like we're breaking out to the upside. The contrarian in me would love that. A sharp rally out of the "pennant" would most likely lead to a quick reversal, and probably mark another major top.
Stocks are trying to break out of the range they've been in the past couple months, but will have a hard time doing so without any volume to fuel the move. Like I said above, a sharp rally and reversal would be a welcome sign for the bears to jump in with a clear stop level just above the top of point of reversal. The action in the euro also lends itself to the near term bearish outlook for stocks as well.
Learn Elliott Wave Principle (EWP)
And speaking of the euro, it got a little sneaky the other day as it topped and sold off sharply before I had a chance to get in fully short. I added a small amount to my core short position yesterday around 1.2925, but only about 10% of what I wanted to add altogether. It may be tough to add shorts at this point, but if we're fortunate enough to a big bounce after what appears to be a nice 5 wave decline, I'll be adding shorts ferociously since it looks like another big top in the euro has occurred. And this bearishness also lends itself to the bearish outlook for stocks as well.
PLEASE NOTE: THIS IS JUST AN ANALYSIS BLOG AND IN NO WAY GUARANTEES OR IMPLIES ANY PROFIT OR GAIN. THE DATA HERE IS MERELY AN EXPRESSED OPINION. TRADE AT YOUR OWN RISK.
Tuesday, January 3, 2012
Stocks Surge to Kick Off 2012, But Volume Doesn't; Euro Correcting Higher
The new year kicked off with a bang for the bulls as there was strength through most of the day with the Dow closing up almost 200 points. Not a surprise really since many people engage in fresh buying to start off the year usually. But volume is key here. Volume remains very light on the rally the past few weeks and only 853 million shares were traded on the NYSE today. So all-in-all, today's rally didn't have much teeth in my view.
Preparing Your Finances for 2012
In addition to the light volume on the rally, the market is fractured at the moment. The Dow has exceeded its October high, while the S&P has not (see below chart). The Dow's structure fits well into a WXY "combination correction" for its Intermediate wave (2) which means a top will occur at any minute. The ensuing decline will be massive, and fast.
Learn Elliott Wave Principle (EWP)
Here's what I mean about the divergence in the Dow and S&P. You can see here that the S&P has failed to exceed its October high, so far. And so the wave count for the correction is more complex than the Dow's. A big reversal while this divergence is in place would be a great risk/reward opportunity for the bears in my opinion because it would suggest a major top might be in. But patience is key. The S&P may also want to continue higher to exceed its October high along with the Dow. This would not negate the longer term bearish view, but it would just make it harder to get as aggressive on the short side. So I'm simply waiting for the market action to unfold, and make it prove to me a top is in and that I should get short.
Looking at this hourly euro chart may be concerning for the bears. The structure looks strong, and can even be counted as impulsive, suggesting that the larger trend is now up. But.....
....looking at the daily chart above, you can see that the recent rallying is just another bump in the road on its way lower. The reversal candlestick in the 1.2850 area along with the big daily candle yesterday suggest a temporary bottom may be in for at least a few days. But all that means is that I lightened up my short position a bit, and will re-enter fully short when I feel the downtrend has resumed. Until then, I'm shorting into rallies and waiting for a big reversal day to the downside. The euro's larger trend remains down.
PLEASE NOTE: THIS IS JUST AN ANALYSIS BLOG AND IN NO WAY GUARANTEES OR IMPLIES ANY PROFIT OR GAIN. THE DATA HERE IS MERELY AN EXPRESSED OPINION. TRADE AT YOUR OWN RISK.
Monday, December 26, 2011
Stocks Float Higher on Light Volume; Euro Still Very Bearish
I want to take a moment to thank you all for another pleasant year here on the blog. I feel I'm very fortunate to have such an intelligent and friendly group of folks here who read the blog and post their comments for all of us to read. Also, many of you have clicked the sponsor's links I post here, signed up for Elliott Wave International's free Club Memberships, and even ordered some of their high quality products. All of the above keep me motivated to continue posting throughout the year. Hopefully we can continue to get more high quality readers and comments through 2012, and if so I can assure you that I'll be here, posting my thoughts and engaging in discussions with you all so we can help each other navigate these markets better, and learn off each other. I wish you all a very happy and successful 2012!
Speaking of the holiday season, I hope you're all enjoying it as much as I am. I'm pretty much just sleeping 9 hours a day, stuffing my face with tons of leftovers which segues nicely into my noon time nap where I wakeup to watch football, eat again, watch a movie and then go to bed. My goal is to get so fat that I need to be rolled around the house to do basic stuff. Then, I get back into shape after the New Year.
The market action doesn't mean much to me right now since volume is so light and end of year maneuvering is occurring. The wave count remains the same with the option of one more new high to around 1300 to mark the end of Intermediate wave (2). This is not required although it would make more sense as far as the wave count goes. The move down from my first proposed Intermediate wave (2) high (1292 on Oct 27th) is clearly a 3 wave move, and the behavior since that move has been far from being "wave 3 like" since it has just flopped around sideways on light volume since then. Another new high around 1300, or just above it, to mark wave (2)'s end followed by sharp selling on high volume would be a much more ideal scenario. So I'll wait for that to occur to ramp up my short position again.
"Market Manipulation" Is Not Why Most Traders Lose
Looking at the S&P's SPDR you can see how volume has fallen off a cliff during the recent rise. The market can continue to do this for a few more days into the New Year, but I wouldn't be piling up on the long side here. Once volume re-enters the market after the New Year, stocks should fall. Until then I wait.......and eat......then take a nap....eat again.....and roll over to the TV to watch the football games.
Learn Elliott Wave Principle (EWP)
The euro has been a cash cow for the bears the past couple months, again not failing me for the bearish November/December scenario I've talked about the past few years. The trend remains firmly down. There is a nice long reversal candlestick wick at the 1.3200 area that suggests strong resistance at that level. I have my aggressive short position set to stop out on a move just above that level.
Happy New Year to you all!!
PLEASE NOTE: THIS IS JUST AN ANALYSIS BLOG AND IN NO WAY GUARANTEES OR IMPLIES ANY PROFIT OR GAIN. THE DATA HERE IS MERELY AN EXPRESSED OPINION. TRADE AT YOUR OWN RISK.
Subscribe to:
Posts (Atom)


