Thursday, November 4, 2010

The Final Surge Higher? (Euro Update for Friday)


In looking for a top in equities I'm watching the euro closely.  The decline today can be counted as a 5 wave impulse move suggesting a top may be in.  Unfortunately it's not a very compelling structure since it can also be counted as an ABC as well due to the relative lengths of subwaves.  But it may clear up a bit as the session moves on.  But I just wanted to post the possibilities of a euro top here as I see it.


Today's move higher both in price and internally was impressive.  Total volume was high at 1.37 billion shares on the NYSE, up volume represented 90% of total volume, and advancers well exceeded decliners.  Moves like this often act as launching pads for sustained moves higher.  Only a close below today's low will negate the bullish outlook and suggest a top may be in.  Until then, expect higher levels.

My guess is that some folks shorted the market or stayed on the sidelines expecting a "sell the news" event after the Fed announcement yesterday.  When the market held stable after the announcement and into the global sessions overnight, the shorts covered and the sidelined folks jumped in with full force.  This is what I feel was behind the move higher today.  Is it just a capitulation move before a reversal?  Or the foundation of a sustained move higher in the coming months?  Hopefully next week we'll get our answer so we can trade accordingly.

The Next Major Disaster Developing for Bond Holders


Well the inevitable happened today as the blue chips followed the Nasdaqs to new highs on the year with today's surge.  The past week or so I've assumed this would occur since the uptrend remained well intact and the Nasdaqs had already made new highs on the year, and they tend to lead the overall market.

Today's rally to new highs was done on big volume with a move that closed on the highs.  Quite convincing indeed for a larger sustained bull run.  But we'll see.  The current rally that started in August has taken little breathers other than sideways chops, making it feel a lot like a 3rd wave.  But unfortunately for the bulls the rally certainly doesn't subdivide on the intraday charts well as a 3rd wave, nor do momentum indicators support this case well either.  So it could easily be a C, or a larger zig-zag forming in my view. 

The XLF (financials ETF) was on fire today, well exceeding the market's gains again.  It gapped higher and made a new high today as well.  If the XLF continues to outpace the S&P's gains higher for a long time it may catch up to it's rally the past few months, eliminated the divergence they've had, as well as some of the best evidence the bears have to a longer term bear picture.  So I'm watching the XLF closely.

With tomorrow being Friday, I doubt a heavy bear stampede will enter the market going into the weekend, but if early next week we can get a gap down reversal in the XLF creating an island pattern, and the major indices can close below today's intraday lows, then we'd have our first solid signs that Primary wave 2 has topped and that perhaps Primary wave 3 has started.  But until that happens, we must continue to understand that the market is showing no signs of stopping its push higher and that until the above action occurs, higher levels should be expected.

"Market Manipulation" Is Not Why Most Traders Lose


Of course the euro rallied, and the dollar sank, in conjunction with the stock market rally today.  I'm counting the euro as thrusting in a Minor wave 5 from a Minor wave 4 triangle right now.  Once its thrust tops and reverses, it should mark a major top and move down to parity with the US dollar eventually.  There are no signs of reversal yet htough, but when they arise I'll certainly mention them here.  A top in the euro and bottom in the US dollar should occur about the same time equities top and reverse.


DJIA Priced in Gold: What It Means for the Long-Term Trend

Of the many forward-looking market indicators we at EWI employ, one of the most interesting tools (and least discussed in the financial media) is the DJIA priced in gold -- "the real money," as EWI's president Robert Prechter calls it. What implications might the present position of Dow/gold have for the long-term trend of the nominal Dow? In this video, Elliott Wave International's Steven Hochberg shows you several revealing charts that answer this question.
(Discover why deflation is the biggest threat to your money -- download your FREE 90-page eBook now.)

Download your FREE deflation eBook now. Newly updated for 2010, Prechter's 90-page eBook reveals why deflation is the biggest threat to your money right now. You will learn how to prepare for deflation, survive it, and maybe even prosper during it, so you'll be ready for the next buying opportunity of a lifetime when deflation is over. PLEASE NOTE: THIS IS JUST AN ANALYSIS BLOG AND IN NO WAY GUARANTEES OR IMPLIES ANY PROFIT OR GAIN. THE DATA HERE IS MERELY AN EXPRESSED OPINION. TRADE AT YOUR OWN RISK.

Wednesday, November 3, 2010

Fed and Elections Out of the Way; Back to the Basics Again


Well, the elections and the Fed QE2 nonsense are finally out of the way.  And the markets didn't really do much as a result, did they?  At least not yet.  The elections were a non-event.  I suspect this is because the outcome was what was expected, i.e. Republicans take back the House but not the Senate.  The result should be a gridlocked government attacking itself the next two years, leaving corporate America alone for a little bit.  I'm sure Wall Street likes that.  But it was already priced into the market.  So that's done.  Then the Fed's QE2 burning of $600 billion is now out of the way and also pretty much in line with what was expected, hence the virtually flat result at the end of the day in the markets.

Today's internals were modestly bullish, but nothing to do a cartwheel over.  The internals and price action the rest of the week, and probably into next week should be more telling about where we're at in the wave structure.  In looking for a top, I'd like to see a sharp rally, maybe a gap-up open, tomorrow morning and then a sharp reversal into negative territory closing on the lows.  That would be as good of time as any to get short and place stops above the high on the day.  If anything, the pure risk/reward of the trade is compelling enough to take the trade.

"Market Manipulation" Is Not Why Most Traders Lose


The uptrends remain intact and I see no reason to short this market, or to assume that a decline is coming anytime soon.  That of course can change in a blink of an eye with a break and close below these uptrend lines and lower lows.  But that hasn't happened yet.  What has happened is that the market has continued making higher highs and higher lows.  That's an uptrend.  Since at the moment, it appears the major indices are headed to new highs on the year, don't forget to check out my longer term bullish count I posted a couple weeks ago for my bigger picture perspective.  Until the evidence shifts away from the bullish view, this count remains valid, and my top choice. 

On another note, the XLF (financials sector ETF) has been consolidating in a triangle like pattern and today's candlestick looks bullish.  It exceeded the overall market's gains today by rallying 1%.  So we need to watch this sector carefully, and monitor its performance relative to the overall stock market.  If financials catch up to equities in their rally, then we'll know that it was the stock market leading financials.  But if the XLF continues to lag the rest of the market, then it still leaves a deadly bearish picture for stocks in the longer term.

I know the market is stretched and many folks are waiting for the top and big reversal.  And that certainly may happen now that the Fed and elections are out of the way.  But playing a top and bearish reversal at this point here is no more than a guess in my opinion.  And I rarely trade on "guesses".  The evidence currently suggests higher levels ahead.  Once that evidence changes to suggest the uptrend is broken, I'll analyze the downside potential from there.  One way we can determine the strength of the market and when a top in stocks may occur is in the action of the euro, or the US dollar.  The euro's count is clearer than stocks, and it appears to have finished up a triangle that led to a new high during its thrust.  That thrust should be quickly and completely reversed, marking a major top in the euro.  When the euro tops, so should stocks.

The Fed and "Plunge Protection Team": Are They Manipulating Stocks?


A triangle appears to have completed Minor wave 4, leaving Minor wave 5 underway at the moment in the form of a thrust.  Thrusts are finishing moves that are quickly completely retraced.  A euro break below 1.3733 would confirm a top and suggest it is moving aggressively lower towards parity in the coming months in my view.  It should also result in a top in stocks.


DJIA Priced in Gold: What It Means for the Long-Term Trend

Of the many forward-looking market indicators we at EWI employ, one of the most interesting tools (and least discussed in the financial media) is the DJIA priced in gold -- "the real money," as EWI's president Robert Prechter calls it. What implications might the present position of Dow/gold have for the long-term trend of the nominal Dow? In this video, Elliott Wave International's Steven Hochberg shows you several revealing charts that answer this question.
(Discover why deflation is the biggest threat to your money -- download your FREE 90-page eBook now.)

Download your FREE deflation eBook now. Newly updated for 2010, Prechter's 90-page eBook reveals why deflation is the biggest threat to your money right now. You will learn how to prepare for deflation, survive it, and maybe even prosper during it, so you'll be ready for the next buying opportunity of a lifetime when deflation is over.


PLEASE NOTE: THIS IS JUST AN ANALYSIS BLOG AND IN NO WAY GUARANTEES OR IMPLIES ANY PROFIT OR GAIN. THE DATA HERE IS MERELY AN EXPRESSED OPINION. TRADE AT YOUR OWN RISK.

Tuesday, November 2, 2010

Fed Manipulation? Buckle up, the Rest of the Week Should be Wild


Internals today were strong, matching price at the close.  I don't think much of the action one way or another the past week or so since it's all been leading up to expectations of the elections tonight, and more importantly QE2 tomorrow.  The market's uptrend remains intact, the Nasdaq Composite came within less than 1 point today of making a new high on the year to confirm the new high in the Nasdaq 100, and the rest of the market seems to want to go higher to probably make new highs on the year before topping as well. 

With the Nasdaq 100 making a new yearly high weeks ago, and the Composite poised to do the same very soon, it seems like the Nasdaq 100 was telling us something when it made that new high.  These Tech heavy indices tend to lead the market, but the new high to the bears was interpreted as a "non-confirmation" and therefore bearish for the overall market whereas I have mostly been cautious of the action.  I would have been much more bearish if it was the S&P or Dow that made new highs and the Nasdaqs lagged instead of the other way around. 

Anyway, the market is stretched to the upside and internally appears ready for a major decline.  But with the uptrends intact and new highs on the year in arms reach, we still have to leave room for the market to continue higher from here.  The volatility and action tomorrow afternoon should break this slow directionless action, and get us back on track to counting waves better on an intraday level.

"Market Manipulation" Is Not Why Most Traders Lose


Just because the Composite and the blue chips indices make new highs on the year doesn't mean all is lost for the EWP bears.  The daily chart above tells us a lot about the long term picture.  The financials continue to lag the overall market very badly.  The market cannot sustain a long bull market without the financials.  Our economy is not fueled by production or manufacturing, it's fueled by credit since all we really do is consume in the US.  So we're dependent on borrowing money from banks to live the American dream.  So what would fuel economic expansion when credit and bank balance sheets are contracting?  As long as financials lag the overall market, it paints a deadly picture for stocks over the longer term.

The Fed and "Plunge Protection Team": Are They Manipulating Stocks?


The latest down up move in the euro puts the bearish count as a much less likely possibility here.  The 4th wave triangle count is now top choice.  I'm looking for a thrust higher out of the triangle to make a new high which should be quickly and completely reversed.  That should be a good shorting opportunity with stops just above the thrust's high.  A top in the euro should translate to a top in stocks soon after.


PLEASE NOTE: THIS IS JUST AN ANALYSIS BLOG AND IN NO WAY GUARANTEES OR IMPLIES ANY PROFIT OR GAIN. THE DATA HERE IS MERELY AN EXPRESSED OPINION. TRADE AT YOUR OWN RISK.

Monday, November 1, 2010

The Euro

The elliott wave count on the euro has two possibilities; one of which should be eliminated from contention by Wednesday at the latest. 


The above count is very bearish, suggest a Minute wave ((3)) is now underway.  If correct, the euro should be headed aggressively lower.  A break below the Minute wave ((1)) low at 1.3733 would put this count as top choice, and leave a great door open for monster gains for the bears in the months ahead.


The other count is just as likely in my view.  It has the euro in a triangle.  It's currently in Minute wave ((e)) of Minor 4th wave triangle which when complete, will lead to a sharp thrust to new highs before being quickly and completely reversed.  That new high the thrust makes should mark the end of the euro rally for a very long time.  Again, the bears should be in firm control from then on.  A break below 1.3733 would make a triangle count here very unlikely.

I'm not too concerned with stocks at the moment.  I want the elections and the Fed's QE2 announcement Tuesday and Wednesday out of the way before reading into anything to much.  The market surged higher this morning but has pulled back since.  It seems that the power players in the market don't want prices drifting too far away from current levels since selloffs and rallies keep getting reversed to a near flat market the past week.  So waiting for the news to pass seems wise.  But the uptrends in the major indices remain intact so I have to expect higher levels until those uptrends are broken.  An S&P close below 1172 would be a good start to breaking that uptrend, and a move below 1160 would  strongly suggest the trend has changed to down.  If anything of interest occurs in trading later today, I'll put up another post.  Otherwise, the information here remains unchanged.

DJIA Priced in Gold: What It Means for the Long-Term Trend

Of the many forward-looking market indicators we at EWI employ, one of the most interesting tools (and least discussed in the financial media) is the DJIA priced in gold -- "the real money," as EWI's president Robert Prechter calls it. What implications might the present position of Dow/gold have for the long-term trend of the nominal Dow? In this video, Elliott Wave International's Steven Hochberg shows you several revealing charts that answer this question.
(Discover why deflation is the biggest threat to your money -- download your FREE 90-page eBook now.)

Download your FREE deflation eBook now.
Newly updated for 2010, Prechter's 90-page eBook reveals why deflation is the biggest threat to your money right now. You will learn how to prepare for deflation, survive it, and maybe even prosper during it, so you'll be ready for the next buying opportunity of a lifetime when deflation is over. Download your FREE deflation eBook now.

PLEASE NOTE: THIS IS JUST AN ANALYSIS BLOG AND IN NO WAY GUARANTEES OR IMPLIES ANY PROFIT OR GAIN. THE DATA HERE IS MERELY AN EXPRESSED OPINION. TRADE AT YOUR OWN RISK.

Sunday, October 31, 2010

The Week Ahead: Wild

There was no post on Friday since the markets didn't do anything that day.  As I said on Thursday, it was doubtful that anyone would take big bets going into the weekend prior to a big election and Fed meeting week.  That proved true.  Seeing the S&P futures up 10 points tonight and a gap higher in the euro that's been filled and is now pushing higher, I see a wild week ahead. 

Where the market's move Monday through Wednesday is anybody's guess.  But I think a well thought out strategy of entry and exit points employed with unflinching discipline, no matter whether you're bullish bearish, is a good idea here.  I think the market could get quite wild this week and those who try to play the market on short term moves might get quite burned versus those who think out the possiblities and calculate risk ahead of time. My opinion.

The uptrend the market has held for several weeks is still intact, yet has numerous signs of exhaustion.  Until the uptrend is broken, we should be looking for higher levels. We'll see if the elections and Fed announcement on QE2 leads to a reaction that breaks the bulls' back, and the uptrend in the process.

PLEASE NOTE: THIS IS JUST AN ANALYSIS BLOG AND IN NO WAY GUARANTEES OR IMPLIES ANY PROFIT OR GAIN. THE DATA HERE IS MERELY AN EXPRESSED OPINION. TRADE AT YOUR OWN RISK.

Thursday, October 28, 2010

Euro Correction May be Complete, Aggressive Selling Just Around the Corner


Market internals were quite flat, well in line with the finishing action in the markets.  Nothing stands out to me here.  Again the bears tried to push this market lower but by the end of the day the bulls rallied the market back.  It seems that those in control of the market right now want it at current levels going into the important week coming up with the elections and Fed announcement on QE2.  I'm not sure we'll get much movement until those events are out of the way, but the market loves to surprise us.  There's a fair amount of economic data coming out tomorrow, but seeing as that it's a Friday, and the week ahead could be very volatile, I'm not sure we'll get big volume wild moves going into the weekend the way the market has been trading. 

Bob Prechter's New Report: The Next Major Disaster Developing for Bond Holders


As far as the elliott wave structure goes, the S&P seems like it's in an ending diagonal or 4th wave correction since a series of 3 wave moves are ruling the market on an intraday basis.  I highlighted the 3 wave declines, but rallies have also been in 3 waves, or some combination of 3 waves, making it look like one big mess the past 10 days as the 15min chart shows.  To me, it looks and feels like the market is on pause, with neither the bears or bulls willing to let the market move too much in one direction until next week.

As a side note, financials continue to lag and are still moving sideways despite the major indices grinding higher the past couple weeks.  Also, the VIX is trying to shoot higher and is making higher highs and higher lows, suggesting it may have bottomed all the way back on October 13th.  This of course would be deadly for stocks.


The one thing that makes me hesitant in being so complacent about equities holding up until next Wednesday is the euro.  The euro traced out 5 wave decline recently, and has so far rallied in 3 waves to just above the prior 4th wave as you can see in the above chart.  There are bullish alternates, but I want to be mindful of the bearish ones here since the evidence suggests the next big move for the long term should be a decline to at least parity in the EUR/USD.  The above count suggests that a turn lower in the euro here would result in a very strong and aggressive move for Micro wave ((3)) coming soon.  With the stock market count unclear, I'm watching the euro for signs of a top in equities.  As long as 1.4079 holds in the EUR/USD, the bears have a great opportunity here to stick it to the euro, and as a result put a lot of pressure on equities.

DJIA Priced in Gold: What It Means for the Long-Term Trend

Of the many forward-looking market indicators we at EWI employ, one of the most interesting tools (and least discussed in the financial media) is the DJIA priced in gold -- "the real money," as EWI's president Robert Prechter calls it. What implications might the present position of Dow/gold have for the long-term trend of the nominal Dow? In this video, Elliott Wave International's Steven Hochberg shows you several revealing charts that answer this question.
(Discover why deflation is the biggest threat to your money -- download your FREE 90-page eBook now.)

Download your FREE deflation eBook now.
Newly updated for 2010, Prechter's 90-page eBook reveals why deflation is the biggest threat to your money right now. You will learn how to prepare for deflation, survive it, and maybe even prosper during it, so you'll be ready for the next buying opportunity of a lifetime when deflation is over. Download your FREE deflation eBook now.


PLEASE NOTE: THIS IS JUST AN ANALYSIS BLOG AND IN NO WAY GUARANTEES OR IMPLIES ANY PROFIT OR GAIN. THE DATA HERE IS MERELY AN EXPRESSED OPINION. TRADE AT YOUR OWN RISK.

Wednesday, October 27, 2010

All Eyes on the Euro (and US dollar)


Today's internals showed decent volume at 1 billion shares on the NYSE and uppers vs downers was what I'd expect from a day like this for the S&P and NYSE.  So nothing glaring out at us here.  The market fell hard this morning, in line with what the euro has been telling us should happen this week, but then stocks rallied hard into the close.  So the uptrend remains intact.

Bob Prechter's New Report: The Next Major Disaster Developing for Bond Holders


The euro has continued to subdivide lower and has completed the minimum requirements for an impulsive move down.  It may continue to subdivide lower from here for wave (5), but it's not required.  Last night I cited that 1.3981 was key to the bearish euro case.  But with 5 waves down in the euro possibly complete now, we have to raise that key level to the start of the 5 wave decline at 1.4079.  If I were not able to have a stop that high on my short position here, then I would cover enough of my short position to allow me to place a stop just above 1.4079. 

The euro has declined impulsively, although it has been a far from stellar move from a major top.  I'd expect a much sharper move lower.  So I'm a bit skeptical here of the implications this 5 wave drop has.  But nonetheless, we use EWP to give us clues of market directions so with that in mind the euro looks poised to continue moving gradually lower. 

But just to keep us honest, we can't ignore the other signs of this just being part of a larger correction.  Remember that the original move from the top was a 3 wave move, suggesting all this declining action is just part of a correction.  I see it likely that perhaps a triangle is unfolding.  If so, then the euro cannot fall below 1.3695.  Doing so would make the triangle all but impossible.  It's also possible the euro is completing a combination correction with a flat occuring in the second position which would have a slight new low beneath 1.3695 before bottoming and reversing. 

So a solid break below 1.3695 would eliminate the highest probably bullish scenario (triangle), and a continued decline well beneath 1.3695 would put the last bullish count on very thin ice (combination).  The action in the euro should be telling for equities.  If the euro has topped, equities will do so soon.


The choppy 3 wave up, 3 wave down mess is not worth guessing on a wave count in my view.  I want to see a 5 wave move somewhere so I can get oriented better on this EWP map.  But with all these 3 wave moves, it's possible an ending diagonal or 4th wave triangle is forming.  If it's an ending diagonal, then the bearish euro story lately is very telling.  It means the euro has topped and stocks will soon violently follow.  But this is all high speculation here since there is no solid evidence to support this other than the euro's 5 wave decline.


The uptrend lines remain intact, and so the uptrend remains intact.  The market has been having a tough time making gains lately, causing a real test of the trendlines in the Composite and S&P on the daily charts.  A solid close beneath the trendlines on solid volume that holds more than a day would be a good sign that some degree of top is in.  Again, the elections and Fed meeting (QE2 announcement) early November is on everyone's minds here.  I doubt any top will be as easy as selling equities on November 3rd, so I expect either an early selloff this week,  next Monday, or the second week of November to surprise us........that is, if the uptrend will be broken at all.  The bullish alternate I've been discussing here are still on the table and should be focused on until the bears prove they're making another move to take control of the market.

DJIA Priced in Gold: What It Means for the Long-Term Trend

Of the many forward-looking market indicators we at EWI employ, one of the most interesting tools (and least discussed in the financial media) is the DJIA priced in gold -- "the real money," as EWI's president Robert Prechter calls it. What implications might the present position of Dow/gold have for the long-term trend of the nominal Dow? In this video, Elliott Wave International's Steven Hochberg shows you several revealing charts that answer this question.
(Discover why deflation is the biggest threat to your money -- download your FREE 90-page eBook now.)

Download your FREE deflation eBook now.
Newly updated for 2010, Prechter's 90-page eBook reveals why deflation is the biggest threat to your money right now. You will learn how to prepare for deflation, survive it, and maybe even prosper during it, so you'll be ready for the next buying opportunity of a lifetime when deflation is over. Download your FREE deflation eBook now.

PLEASE NOTE: THIS IS JUST AN ANALYSIS BLOG AND IN NO WAY GUARANTEES OR IMPLIES ANY PROFIT OR GAIN. THE DATA HERE IS MERELY AN EXPRESSED OPINION. TRADE AT YOUR OWN RISK.

Tuesday, October 26, 2010

Euro Declining Impulsively

Nothing new to report on the market since it essentially did nothing today, and still appears poised to continue its weak upward chop for now.  Until the uptrend is broken with a decline beneath 1159.71 in the S&P (for starters), then I have to conclude the market is poised to continue higher.  It's possible the bears will remain on the sidelines until sometime after the elections and Fed meeting early November, but we need to still be vigilant as a major top can occur at any time.

Bob Prechter's New Report: The Next Major Disaster Developing for Bond Holders


Elliott Wave Forex

To continue with my euro count from yesterday, it has subdivided lower in an impulsive manner into today's US session.  The previous decline from the high at 1.4159 was in 3 waves so it makes me suspicious of the implications these current 5 wave declines bring to us.  But as long as they continue to unfold impulsively downward, I want to be bearish in the short term.  It may be tracing out a large triangle which would leave us with a series of 3 wave moves up and down that subdivide into impulsive waves like we see above, but we still need to see more action to put that at a higher probability.  Right now, 1.3981 remains the key level for the bears to hold.

PLEASE NOTE: THIS IS JUST AN ANALYSIS BLOG AND IN NO WAY GUARANTEES OR IMPLIES ANY PROFIT OR GAIN. THE DATA HERE IS MERELY AN EXPRESSED OPINION. TRADE AT YOUR OWN RISK.

Monday, October 25, 2010

Market Again Sets up for a Slam Dunk by the Bears; Will They Step up?


So the market surged higher this morning as I expected, but then spent most of the day declining off the highs.  As I said late last week, we knew the market would surge higher this morning, but what happened after the rally was more important.  The action off the highs is not encouraging for long term bears.  Although the rallies continue, and are persistent, they continue to show signs of weakening internally that show the rally cannot be sustained for a long period of time. 

Today's internals were a little better than I expected them to be with the reversal off the highs and modest up close.  Volume was solid today relative to the past few weeks and advancers and up volume was quite solid as well.  So the internal picture is not a bearish one in my view at all.


I'm starting my wave count withe euro tonight because it leaves the potential for very bearish action in the AT LEAST the short term.  The euro did not make a new high against the dollar, and with the decline from 1.4159 being a 3 wave affair, it keeps me skeptical that a top in the euro is in.  However, with a major top coming at any time in the euro and equities, we need to be on high alert for any signs of topping action.  The 15min EUR/USD chart shows a 5 wave impulse decline suggesting the larger trend is down now.  As long as it continues to subdivide impulsively lower while staying beneath 1.4080, I'm very bearish the euro and bullish the US dollar.  This, of course, could translate to a very bearish picture for equities as well.  But equities have not unfolded in an impulsive manner from the highs though.  So watch the euro and the US dollar for signs!

Although not all momentum indicators are diverging as long as the stochastics, it's still worth showing what some indicators are doing with the current rally.  The daily stochastics on the S&P are ready to fall, and the weekly stochastices are overbought, waiting for a turn lower.  Today's smushed candlestick may be a signal of a top, but it's just a guess at this point.  With the uptrend still well intact technically, I have to expect the market to go higher.  The market will have to break that uptrend in order to prove to me it wants to move lower.  Breaking below 1159.71 would be a good start to breaking down the uptrend.

Free article: October Curse vs. Objective Analysis: The Choice Is Yours.


And lastly, the XLF continues to diverge drastically from the S&P.  The XLF spent most of the day in negative territory despite the big rally in the S&P.  And so on the daily charts, you can see the massive separation continuing here.  The stock market cannot sustain a long term rally without the financials.  As long as this divergence continues, it paints a very bearish picture for the overall stock market.

So the setup for the bears to take control is again present.  We'll see if the bears can step up tomorrow and break the uptrend.

Get Your Free Report: How to Use Bar Patterns to Spot Trade Setups


PLEASE NOTE: THIS IS JUST AN ANALYSIS BLOG AND IN NO WAY GUARANTEES OR IMPLIES ANY PROFIT OR GAIN. THE DATA HERE IS MERELY AN EXPRESSED OPINION. TRADE AT YOUR OWN RISK.

Friday, October 22, 2010

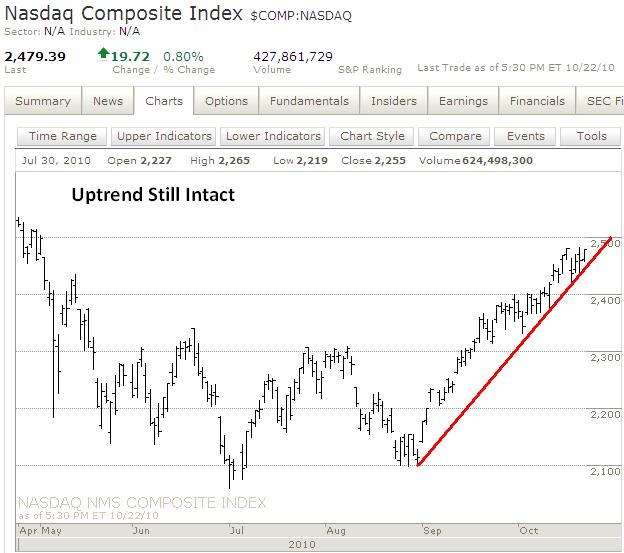
Uptrend Still Intact

Complimentary Report: Revealing new perspective on China and Japan 


Did people know the market was open today?  Sure didn't feel like it.  Other than the Nasdaqs, it was a snoozefest today.  There was no real news out today, low volume on the uptrend has been the situation the past few months anyway, and the fact that it's a Friday may all lend itself today's lackluster day.  But in my opinion, having a light volume day like this after such a big uptrend is like a boxer putting his hands behind his back for a few seconds.  It was a good opportunity for the bears to strike since the bulls were light today. But the bears didn't strike, and the uptrend remains intact from a technical perspective, so I have to conclude that we're looking at higher levels ahead. 


Other than the Nasdaqs, the market didn't do anything to change my charts from yesterday so I'm just posting my primary long term count from yesterday again.  Just to reiterate, until the market proves to me the bears are in control, I'm looking for new highs on the year in at least some indices/sectors before Primary wave ((2)) tops.  If the bulls do not allow a meaningful decline beforehand, and alleviate the severe overbought condition the market's in right now, it means that new highs should be short lived and sharply reversed.  But that's later on and very speculative.  As for the short term, I'm looking for higher levels.

In the short term, the 3 wave drops and 5 wave rallies are still front page on my radar.  And the Nasdaq Composite would end up sporting a triple top if it were to fall from current levels.  Triple tops are extremely rare.  So it appears the Nasdaq will shoot higher from here.


On the daily Nasdaq Composite chart you can see what I mean when I say the uptrend is still intact.  The series of higher lows and higher highs continues, and an uptrend line remains well intact.  Only a breakdown of that trendline, preferably impulsively, and lower lows will start the wheels in motion to move towards calling a top.  But right now, the evidence suggests higher levels ahead.

Free article: October Curse vs. Objective Analysis: The Choice Is Yours.


The VIX wave count still remains intact but is running out of room to fall.  I don't hold wave counts in the VIX very reliable as I've said before, but the 5 wave rally last week combined with other signs of a top in equities made it a compelling at the time.  But the slow choppy grind lower has been quite extended and I'd expect sharp rallies and declines if the VIX had formed a major bottom.  But without a new low, the count is still technically valid, and is one piece of evidence that might suggest the top in equities isn't as far away as I may think.

Nothing has changed in my analysis of the euro and it barely moved since last night.  The 3 wave drop and sharp rally this week make it appear we need another test of the highs before a top can called.  We should get some movement early next week after the G20 meeting, and as we get closer to the elections and the Fed meeting and more of the delicious QE2 everyone loves (input sarcasm here).

Speaking of the G20 meeting over the weekend, with the evidence appearing that we still need more new highs in at least some participants in the equity markets to even consider finding a top, I suspect Monday will be a strong up-day early as a result of that G20 meeting.  But the action following the big upward spike Monday will be even more telling.  So we watch.....and we wait....

Video: The Versatility of the Wave Principle
Timeless Trading Lesson
In the video below, EWI senior analyst and trading instructor Jeffrey Kennedy shows how the Wave Principle can help you identify a high-probability trade set up regardless of the direction of the larger trend.

This timeless educational video was taken from Jeffrey's renowned Trader's Classroom series and is being re-released because of its valuable lesson. If a few minutes isn't enough, get more FREE practical trading lessons from Jeffrey Kennedy in his latest eBook.

PLEASE NOTE: THIS IS JUST AN ANALYSIS BLOG AND IN NO WAY GUARANTEES OR IMPLIES ANY PROFIT OR GAIN. THE DATA HERE IS MERELY AN EXPRESSED OPINION. TRADE AT YOUR OWN RISK.

Thursday, October 21, 2010

There is Still no Evidence of a Top, All Short Term Signs Point Higher for Now


The action today was interesting since we made another slight new high with diverging momentum and then a sharp reversal in price and internals.  Early this morning on the rally I noticed that internals were strong with well over 400 S&P stocks trading higher and NYSE volume coming in solidly higher than declining volume.  But notice how the internals closed today.  Down volume ended up exceeding up volume and a big wave of S&P stocks ended up moving into the negative.  Also note that the Nasdaq Composite, XLF, small caps and NYSE were all significantly weaker than the Dow.  So again, although the bulls are still in full control, their climb higher continues to weaken.  And remember the strength and conviction the bears brought to the internals of the market on just one down day Tuesday.  When the bears finally gain control and take advantage of the opportunity to strike, they will be fresh and strong and going against an exhausted and stretched bull run.  The result should be a fast and ferocious decline.  The challenge is not “if?” it’s “when?”

If the wave count is correct in that Primary wave ((2)) topped in April, and Minor wave 1 completed in May and the action ever since then is Minor wave 2, then we’re not looking good as far as probabilities go.  The daily chart of the S&P illustrates what I’m saying.  The proposed Minor wave 2 rally is extremely stretched in both price and time.  And with it now trading well above the maximum comfortable retracement level of 78.6%, it’s time to start considering other counts to apply to our overall strategy in my view.


My current daily count is quite simple, which is how I always start my counts…..by keeping it simple and working it more complex only as required. The rally from August has been quite strong and somewhat impulsive looking, so it most likely is a 3rd or C wave.  I would think that a 3rd wave would be a little sharper and more impulsive looking, although it’s not required.  But it’s all about probabilities.  And I think it’s more probable that it’s a wave C.  Of course this would mean a Minor wave C of Intermediate wave (Z) of Primary wave ((2)).  It means that new highs in some, or all, of the major indices are coming in the near future, most likely for the rest of 2010.  If the bulls do not push the market down in a sustained correction to work off the severely overbought condition before it makes new highs on the year, then I think I can state with high certainty that those new highs would be short lived, and probably be accompanied by various intermarket and momentum divergences when it tops and reverses sharply.  So although we could certainly top and reverse at any time, the Nasdaq 100 has already made new highs on the year, and a few others appear to be on their way there as well.  But with that said, the risk is still to the downside and I personally would not be long equities unless I had 100% put protection.

Going back to the basics, I labeled the 15min chart to show what we’re dealing with at the current time.  You can see we’re still in an uptrend because declines are 3 wave moves and the recent rally is a 5 wave move.  Today’s reversal was nice, but there is still only a 3 wave move down in place.  It needs to continue downward and subdivide into a 5 wave move to even consider a top possibly being in.  And the bigger long term picture suggests higher levels to come.  So without any definitive evidence that a top is in, the proof lies with the bullish argument and higher levels until the bears can produce evidence that the uptrend is broken.

The 6 month daily chart of the S&P and XLF continue to paint a very bearish picture for overal equities.  The financials are not only sustaining their multi-month divergence from the S&P, but it seems to be accelerating it as it’s making more and more lower highs consistently while the S&P makes higher highs.  Eventually, one of these markets has to give way and join the other one.  The larger big picture evidence suggests that it will eventually be the S&P that drops and joins the XLF.  But again, the “when?” is the key question.  Right now, I see no signs of it happening.  So we have to continue to wait.


The break above 1.4005 last night in the euro busts the impulsive decline count I've been tracking and leaves a 3 wave move instead, suggesting new highs are on the way.  Although I can't be certain this will occur since this rally is stretched in sentiment, price, momentum and the wave count.  It's possible a truncated 5th wave will occur, or other currency majors will make new extremes and not the euro.  I just don't know for sure at this point.  But right now, the evidence suggests the euro uptrend is still intact.  Until I see something different, we have to assume the euro will move higher, for now.

Lastly, a look at the gold ETF (GLD) shows a nice clear 5 wave decline from the high, and there’s also one arguably in silver as well.  Of course this suggests that the trend in the metals has turned down.  It would be bearish for stocks as well as the euro, so we’ll have to watch these metals since they are the only short term bearish pieces of evidence I find compelling.


Video: The Versatility of the Wave Principle
Timeless Trading Lesson
In the video below, EWI senior analyst and trading instructor Jeffrey Kennedy shows how the Wave Principle can help you identify a high-probability trade set up regardless of the direction of the larger trend.

This timeless educational video was taken from Jeffrey's renowned Trader's Classroom series and is being re-released because of its valuable lesson. If a few minutes isn't enough, get more FREE practical trading lessons from Jeffrey Kennedy in his latest eBook.


PLEASE NOTE: THIS IS JUST AN ANALYSIS BLOG AND IN NO WAY GUARANTEES OR IMPLIES ANY PROFIT OR GAIN. THE DATA HERE IS MERELY AN EXPRESSED OPINION. TRADE AT YOUR OWN RISK.

Wednesday, October 20, 2010

The Market Give'th, and the Market Take'th Away;


Yesterday I mentioned that the action AFTER the selloff was probably more important than the selloff itself.  Well the fact that the bulls took back their losses from yesterday in just a couple hours speaks well for the bullish case.  But all is not bullish, far from it.  The bears have their troops lined up for a fight as well.  There is a lot of evidence right now that supports both the bullish and bearish cases.  I won't drone on about all of these things which will only lead to the conclusion that "the market may go up, but it may also go down."  So I'm going to discuss what I feel is important here at this juncture.

Internals today snapped back and tried to return fire from yesterday's big bearish decline.  But the bulls did not succeed in matching the bears' intensity.  Yesterday the bears moved the market down big with 1.27 billion shares and today the bulls could only muster up 1.1 billion shares; the bears had 89% of NYSE volume to the downside while the bulls only got 74% to the upside today; yesterday's NYSE decliners were at 2484 for the bears while today the bulls only had 2283 advancers; and the bears got 460 S&P stocks to close lower while the bulls had 429 close higher today.  So the intensity of the two moves belongs more to the bears than with the bulls.  I know this is only one day and it may not speak well to the bigger picture in and of itself.  But when you combine this evidence with the fact that over the past several months declines usually have big volume and the rallying has lighter volume, then it shows an internally weaker bullish underpinning to the rally.  And that often means the move is corrective in nature.

With that said, we've been talking about a weakening uptrend for months and the market has continued higher.  So we have to drill down the evidence deeper to get the specifics of where the market is moving in the short term.


The break above the key levels I cited yesterday (Dow 11,068 and S&P 1177) signal that the decline from Monday was just a 3 wave move, which is a correction.  Also note that the Dow is looking like it's heading to a resistance area at 11,150 that's been tested twice already (see a 10 day chart).  For it to stop again around that area would make it a triple top, and triple tops are extremely rare.  The evidence for the short term action suggests the bulls are still in control.  Even if the market doesn't make new highs and reverses from current levels, it could just mean that the above labeled ABC zig-zag correction is unfolding into a "combination correction" which would have it work its way lower in another ABC zig-zig correction to new lows in the coming days before surging higher to new highs.

Only an extremely sharp and deep impulsive move lower would put this current unfolding downward corrective count in jeopardy.  The bullish count above is my primary count right now.


This is the alternate count that is aggressively bearish.  For those who are Elliott Wave Principle "purists", you'll notice this leading diagonal does not have overlapping 4th and 1st waves so it's not possible to count it this way.  That's fine, it can simply be counted as a 5 wave decline without the diagonal labeling.  But it would be a real stretch if that were the case since it would not have EWP's guideline for the "right look", and the ensuring corrective rally is extremely sharp and deep. 

The reason I like this count being of at least a diagonal-like structure is because the waves lower get smaller and smaller and weaker and weaker as the market moved lower, then had a huge sharp straight up rally today.  All of which is typical behavior of the action during and following diagonals.  Also, the bearish 5 wave count lower remains valid since after the intitial surge this morning, the bulls hit a wall and could not accelerate it higher into the close.  Combining this with the weaker internals that accompanied yesterday's big bearish move helps support this above wave count as well. 

For this account to remain in contention, a sharp impulsive move lower must occur from near current levels very soon.

Free article: October Curse vs. Objective Analysis: The Choice Is Yours.


Although the divergence of financials from the rest of the market is front page news on the financial media and blogosphere, it's still a significant development and should be noted.  The financials continue to lag the blue chip indices drastically as the daily chart comparison with the Dow shows.  Eventually, one of these two will have to give way and move in line with the other's trend.  At this juncture, it seems that the blue chips will turn lower and follow financials eventually.  But when??? That has been the challenge for the bears.


The euro rallied with stocks today.  In fact, early in this morning's US session the euro was surging higher while stocks where just treading sideways-to-up slowly.  Stocks eventually followed the euro aggressively higher where both markets hit a brick wall and halted for the rest of the day.  Stocks broke their key levels today (1177 S&P and 11,068 Dow), but the euro did not exceed its key level at 1.4005.  At least not yet.  I don't have much confidence that this high will hold, but if it doesn't it probably means a test at the 1.4150 level in the near future.  I believe China is putting some data out at 10pm EST tonight, so perhaps this will move the euro, and the futures, strong enough in a direction that can give us some answers to help clear up the short term bull/bear arguement and hint what we can expect tomorrow.


Video: The Versatility of the Wave Principle
Timeless Trading Lesson

In the video below, EWI senior analyst and trading instructor Jeffrey Kennedy shows how the Wave Principle can help you identify a high-probability trade set up regardless of the direction of the larger trend.

This timeless educational video was taken from Jeffrey's renowned Trader's Classroom series and is being re-released because of its valuable lesson. If a few minutes isn't enough, get more FREE practical trading lessons from Jeffrey Kennedy in his latest eBook.

PLEASE NOTE: THIS IS JUST AN ANALYSIS BLOG AND IN NO WAY GUARANTEES OR IMPLIES ANY PROFIT OR GAIN. THE DATA HERE IS MERELY AN EXPRESSED OPINION. TRADE AT YOUR OWN RISK.

Bulls Quickly Regain Control


Well, once again the bulls wasted know time showing the market who's boss as they quickly came in and regained control of the market after a selloff.  This has been the trend the past several weeks, and it continues today.  The break above the key levels I cited yesterday make the drop from Monday's highs look like a 3 wave move, which is a correction. Now the market can fall from here to new lows, but it would probably just mean the correction downard is subdividing lower.  So that would have the markets pointed higher in the coming days/weeks, and probably a test and break above the highs on the year.  With new highs perhaps on the way, the market's failure to follow through with the April decline makes the entire move more like a correction and puts the bullish alternates I've been mentioning on the front page.  If there is not a sharp reversal downward sometime today, we need to consider the longer term bullish potential of the market while at the same time being aware and prepared for a top and collapse at any time.


All is not full blown bullish so I'm not getting long by any means.  The financials are again lagging this rally and the euro is still far off from its highs.  In addition, there is a slight chance that the decline in equities from Monday is a leading diagonal.  This would explain the sharp rise today, but obviously it must stay below Monday's highs to remain intact.  This is a much more unlikely scenario at this point though, that's why I didn't mention it before, and the key level of 1177 in the S&P marked the highest probability "kill point" for the bearish case.

So in summary, the market looks like it's probably resumed its uptrend since the wave structure suggests it.  Doing so means that the correction after the April top and reversal is extremely stretched in price and time and those highs will eventually be tested soon.  But I'm waiting for the close before I make any moves.  A sharp reversal downward would still keep the short term bearish case on track.  But holding these gains, or accelerating them, into the close will put me neutral for sure.


In addition, the currency majors I follow have not exceeded their key levels that would confirm a 3 wave drop from the highs.  The euro is awefully close, but if the aussie and the pound fail to do so, we can put them in the same column as the financials with their lagging behavior compared to the rest of the market.

PLEASE NOTE: THIS IS JUST AN ANALYSIS BLOG AND IN NO WAY GUARANTEES OR IMPLIES ANY PROFIT OR GAIN. THE DATA HERE IS MERELY AN EXPRESSED OPINION. TRADE AT YOUR OWN RISK.

StatCounter