Wednesday, November 24, 2010

Turkey Update!!


I've started my Thanksgiving with family and friends already, so today's post will be brief.  I'll be back  Monday.  Happy Thanksgiving all!!

Today's internals show a very bullish day right in line with price, however volume was obviously low with the day just before Thanksgiving.  The flip flop nature of the market and internals the past week or so is symbolic of a triangle which I'm counting for Minute wave ((iv)).


The market rallied strong off the descending trendline that I've been tracking the past few days as expected.  Today's rally should continue Friday and maybe early next week to complete Subminuette wave c of Minuette wave (b) within the Minute wave ((iv)) triangle.  My target area of Subminuette wave c to top is at the 1214 area of the S&P.  The triangle scenario suggests a net sideways move for the next several weeks, so be positioned accordingly, at least until the triangle scenario is complete, or busted.

Learn Elliott Wave Principle


Despite the stock market's strength, the euro remained weak as well, and the US dollar strong.  The typical Thanksgiving time euro weakness and dollar strength is back in action this year.  Although it appears Minuette wave (i) might be complete since 5 waves can now be counted down from the Minor wave 2 high.  So a sharp Minuette wave (ii) rally MAY be on the horizon.  I certainly would not get long the euro here, but for those who want to enter short, or add to their shorts, you might have an opportunity coming soon.  But the larger trend is still firmly down, so the path of least resistance remains to the downside.

Now go enjoy turkey time!!

Free eBook teaches you how to apply Moving Averages to your trading or investing

PLEASE NOTE: THIS IS JUST AN ANALYSIS BLOG AND IN NO WAY GUARANTEES OR IMPLIES ANY PROFIT OR GAIN. THE DATA HERE IS MERELY AN EXPRESSED OPINION. TRADE AT YOUR OWN RISK.

Tuesday, November 23, 2010

Stocks Should Bottom Soon if Triangle is Correct; Euro Decline Looks to be Just Getting Started


The market sold off apparently because North Korea is trying to start a fight, and banking issues in Europe that keep lingering, and even deteriorating in some cases (Ireland).  However despite the market’s selling today, volume was still a bit quiet as just over 1 billion shares were traded on the NYSE.  So people didn’t find the news important enough to disrupt their Thanksgiving vacations and rush to a computer to sell.  I will say that the weakness so far on this holiday week is a bit of a surprise.  But if the big picture results in a triangle during this period and into the new year, then it will all make sense.
The bears were in full control today since 90% of volume today was to the downside, and 464 stocks on the S&P closed down.  The bears clearly ruled the day.  But as I’ll discuss later, the S&P is still trading on the descending trendline, the VIX has a triple-bottom in place which would be rare if it holds, and we’ve still yet to see follow-through or a breakout trend setting move get established yet.  And with tomorrow and Friday expected to be very light trading days, I’m not sure we’ll get that decisive trend setting move until next week.
Although the market continued lower today, it did not close below the descending trendline I’ve been tracking since this decline started early this month.  And the decline today still fits in well with finishing off a Subminuette wave b within a larger triangle.  If the above count is correct, the next big move in the market should be a sharp shot higher towards the 1210-1220 area.  But if the market continues lower instead, and especially if it closes beneath the descending trendline, then it will severely damage the likelihood of the triangle from occurring and force us to look at other more likely wave counts.  But keep in mind that the choppy decline from the highs this month signals it’s still a correction, so I’d still be focused on a corrective pattern unfolding until 1129.24 is broken.
Learn Elliott Wave Principle

To follow up on the XLF action I’ve been tracking, I wanted to point out that it closed below the apex of a previous triangle.  So the financial sector is tip-toeing towards giving us a very bearish signal here.  You can see that it’s currently trading at a very congested area right now it’s no surprise it’s struggling here.  So I want to see a daily close beneath 14.25 to give the signal that a significant top is already in place.  One more big down day from here should do it.

I mentioned before that triple bottoms are extremely rare, and for the VIX to not continue lower to a new low would be a big surprise.  Today’s surge higher filled a gap left open from last week so it seems quite likely that the VIX will continue lower from near current levels.  This would of course mean that stocks will shoot higher.  This fits my above wave count on the S&UP calling for a sharp Subminuette wave c rally from near current levels.
Free eBook teaches you how to apply Moving Averages to your trading or investing


The euro has fulfilled expectation both in its typical Thanksgiving holiday weakness, and with the wave count.  The wave count yesterday suggested that the small 5 wave decline it traced out early this week was a sign that the euro had topped and more selling was on the way.  If it was a Minor wave 2 top like I suggested yesterday, that would mean that it would have to fall very hard very soon in order to fulfill the expectations of a Minor wave 3.  And today it did just that.  But if the count is correct, Minor wave 3 is far from over.  I expect further weakness in the euro and a quick move toward 1.30 at least, if in fact it’s in a Minor wave 3 down right now.  Euro weakness of course means dollar strength, and dollar strength of this magnitude would put a lot of pressure on stocks and commodities.  I know this conflicts with the call for higher stock prices from here, but I have to call each market as I see it independently.  We’ll see which one prevails.
Robert Prechter Explains The Fed, Part II

PLEASE NOTE: THIS IS JUST AN ANALYSIS BLOG AND IN NO WAY GUARANTEES OR IMPLIES ANY PROFIT OR GAIN. THE DATA HERE IS MERELY AN EXPRESSED OPINION. TRADE AT YOUR OWN RISK.

Monday, November 22, 2010

Markets at Crossroads; Euro Completing Impulsive 5 Wave Decline


The S&P declined to the top end of the descending trendline I've been following since this pullback started.  However it's having trouble breaking below it, so far.  Failure to break below it, and establish a daily close beneath the trendline leaves the possiblity open that it is merely a "retest" of a recently broken trendline and will surge higher soon; which is a typical behavior after breaking through a significant trendline.  So the S&P is at a crucial juncture here, and the short term movement from here could easily define the trend in the coming days/weeks.

The wave count can easily have today's decline be a Subminuette wave b of Minuette wave (b) of a triangle that I've been tracking.  So bouncing off the top end of the descending trendline I mentioned earlier would fit well with a sharp Subminuette wave c rally to complete Minuette wave (b) of the triangle.

It's important to keep this triangle pattern in mind as we grind forward here into the holidays because the sharp up-down moves, especially the sharp surprise moves like this morning, can drive traders insane for weeks.  But if we're aware that a triangle might be forming, we'll be ahead of the game while others are running around in circles and frustrated as they pull their hair out.  Until the triangle possibility is eliminated, it needs to be respected.

Learn Elliott Wave Principle


The financial ETF (XLF) also appears to be back at a decision point as well.  It's decline today puts it right back at the apex of what looks like a previous triangle.  A sharp short term move in either direction from here should define the larger trend going forward.  So this will be interesting to watch here.

Free eBook teaches you how to apply Moving Averages to your trading or investing


Minor wave 2 in the euro may have topped last night.  The bulls made a fatal mistake Sunday afternoon when they gapped up at the open and failed to close that gap for several hours.  Leaving that gap open into the european session told me that a sharp reversal would likely be coming soon.  Remember the Thanksgiving dollar bullishness I've been talking about?  (Dollar bullishness means euro weakness).  So now is not the time for the euro bulls to get lazy or sloppy, and leaving a wide open gap at Sunday's open was sloppy, and today they paid for it as the euro bears came in strong.


Minor wave 2 looks a bit shallow so I can't eliminate the possibility of a rally to new highs coming later on.  But the evidence and risk/reward strongly favors the bears so much here, that I'm still going to focus on the bearish potential here.  I count a nice 5 wave decline from the Minor wave 2 high occurring, which strongly suggests that the euro has topped, and the US dollar has bottomed.  If so, the Minor wave 3 potential here is great for the euro bears and dollar bulls, with risk limited to the Minor wave 2 extreme.

A top in the euro would make it very interesting to see how stocks and commodities react.  With stocks apparently in a triangle it may make it difficult to achieve that goal.  But we'll see.

Robert Prechter Explains The Fed, Part II


PLEASE NOTE: THIS IS JUST AN ANALYSIS BLOG AND IN NO WAY GUARANTEES OR IMPLIES ANY PROFIT OR GAIN. THE DATA HERE IS MERELY AN EXPRESSED OPINION. TRADE AT YOUR OWN RISK.

Friday, November 19, 2010

Grinding Sideways for a While; But Watch the Euro (or USD)


Internals today were slightly strong, providing better follow-through for the bulls after a big move which is more than what the bears could muster up after their big move earlier in the week.  Options expiration day probably contributed to volume making it above 1 billion shares, but overall it was still a quiet day nonetheless.  It should get even quieter next week with Thanksgiving on Thursday and a half trading day on Friday.  I don’t expect much action to occur in stocks, and usually the market floats higher during this time, so that would fit nicely with the wave count looking for Minuette wave (b) of a triangle forming.  But I will be watching the dollar intensely.  Thanksgiving is often a very volatile time for currencies, and the dollar is usually the benefit of big moves.  We’ll see if this turkey season keeps the dollar bullish trend alive.

Free eBook teaches you how to apply Moving Averages to your trading or investing


After breaking through the descending trendline to the upside yesterday, the S&P tested the top end of the trendline before bouncing the rest of the day.  This is typical behavior of a trend reversal in the making.  This doesn’t mean the market is a straight shot higher from here, but it does imply the Minuette wave (a) bottom will hold for quite a few more weeks.  I suspect a triangle is unfolding right now, and perhaps another down-up move will complete Minuette wave (b) of that triangle.  I tried to place a general projection of prices in the coming weeks for a Minute wave (iv) triangle in the above chart.  I didn’t place the triangle barrier lines in the chart because I thought it would just add clutter to an already cluttered chart.  But you get the idea; a sideways chop is ahead for us.
The bottom line: unless we get a sharp move below Minuette wave (a), I expect a fairly sideways market in the coming weeks.  1129.24 is the key level the bulls need to hold, and it’s quite far from current levels so they don’t have much to worry about at this time.


The VIX has been crushed lately.  And today was no exception.  With options expiration today, and a flat week most likely ahead of us, I’m sure options investors know that a bet for low volatility is a good choice.  The VIX chart doesn’t follow typical technical analysis as well as the major indices do, so take this VIX call with a grain of salt: the VIX is at a previous floor that has repelled it before, but if we’re hoping for a triple bottom here then I think it’s a fool’s errand.  Triple bottoms are extremely rare, and the action in the VIX suggests it will move lower soon.  This should be bullish for stocks in the short term.

The financials ETF (XLF) is at an interesting juncture here.  Although the larger wave count eludes me, it does appear to have formed a triangle in October, and then thrusted from that triangle early November surrounding the QE2 hype.  Since then it has behaved just one would expect it to after a triangle and thrust, which is retrace back to the apex of the triangle.  Now this is where it’s interesting.  A move lower here beneath the lowest point on the triangle will signal that a significant top may be in for the XLF and that further selling is coming for weeks, maybe months ahead.  However, a reversal higher from the apex of the triangle would suggest just the opposite, that the XLF is headed higher in the coming weeks.  So any sustained decisive move from here should provide momentum to continue in that direction for the foreseeable future.  I’ll be watching this closely.
Nothing new to report on the euro.  My currency software is acting whacky so I’m not posting a chart.  No real need anyway, the euro didn’t do much today anyway.  It appears it’s about half way done correcting higher.  If so, I’d love for the euro to make some progress higher early next week because once the Thanksgiving lull hits the currency markets, it opens the door for the big US dollar rally, and euro decline, that I’ve been talking about.  So of all the markets I’m watching next week, I think the setup and action in the euro will be the most interesting.

PLEASE NOTE: THIS IS JUST AN ANALYSIS BLOG AND IN NO WAY GUARANTEES OR IMPLIES ANY PROFIT OR GAIN. THE DATA HERE IS MERELY AN EXPRESSED OPINION. TRADE AT YOUR OWN RISK.

Thursday, November 18, 2010

Strong Rally Today Suggests a Temporary Bottom Might be in


Internals today were very strong.  Bulls managed a 1.2 billion share day today on a strong looking rally.  Bears managed a slightly higher 1.3 billion share day on the big decline earlier this week.  So the bulls are trying to regain control of the market here.  So far, the rally looks impulsive with a breakaway 3rd wave gap occurring this morning, and the flat sideways movement the rest of the day being a 4th wave.  Looking at the internals, the bulls were in full control as up volume and advancers overall were very strong.

As I mentioned in today’s addendum, the rally in the S&P today broke above the descending trendline I’ve been tracking the past few days.  It failed to close back under it, and when you combine that with the strong internals we saw today, we need to be prepared for more rallying ahead.  The only thing that will negate this view is a strong decline and close back beneath the trendline Friday or Monday. 

So what are our wave count options?  The triangle count looks best to me.  With the sharp decline for Minute wave ((ii)), EWP’s guideline for alternation suggest a more sideways correction for Minute wave ((iv)), and a triangle at this point seems to be the most likely scenario.   Above you can see my preferred count mapped out for the Minute wave ((iv)) triangle.  Minuette wave (a) lower completed yesterday, and now we’re in Minuette wave (b) higher.  We’ll chug along sideways through the holidays and into the new year where we should thrust higher from this triangle and into the Primary wave ((2)) top.  From there we should find ourselves another great attempt to catch the top of a lifetime.  There are other possible corrections besides the triangle, but I’ll discuss them if the triangle seems to become less likely.
Free eBook teaches you how to apply Moving Averages to your trading or investing

As for the bears, I don’t think there’s anything to get too excited about in the long term prospects here.  Above is my attempt at calling Primary wave ((2)) already complete, and a series of 1s and 2s lower from there.  My experience as an elliott waver tells me that whenever I have to label a count as a bunch of 1 and 2 waves for it to try and be impulsive, then most likely the count is wrong and it’s just a correction.  Well that certainly applies here.  Although it’s possible this count is correct, it just looks very unlikely at this point.  Although a sharp and deep decline, preferably below 1129.24 in a hurry, might raise this count to higher probability.  But as it stands now I think this above count is doubtful.  A break above 1207 would eliminate this count completely.

I cannot put an impulsive wave count on the euro with high confidence at this point.  Perhaps it needs to subdivide further, or I just need to be more creative.  But I will say that the slope and speed of the decline does seem impulsive.  It appears perhaps at least a short term bottom might be in, so I placed the Fibonacci retracement levels to watch for the correction to top out at.  It’s currently already finding resistance at the 23% retracement, but if it’s correcting the entire decline from the October high then it probably will continue higher to the 1.3862-1.3962 area before topping.

Euro's Twists and Turns: What's Next for the Currency?

(Note: This video was recorded on November 5, 2010)
Since the November 4 high, the euro has declined sharply against the U.S. dollar. Does this mean that it's time for a trend change in the dollar? Watch the free video below to get Elliott Wave International's Senior Currency Strategist Jim Martens' take on what he thinks is coming next.

EWI's Forex FreeWeek is happening now! For an entire week you get free access to EWI's intensive Currency Specialty Service. Hurry! Forex FreeWeek ends Thursday, Nov. 18..

PLEASE NOTE: THIS IS JUST AN ANALYSIS BLOG AND IN NO WAY GUARANTEES OR IMPLIES ANY PROFIT OR GAIN. THE DATA HERE IS MERELY AN EXPRESSED OPINION. TRADE AT YOUR OWN RISK.

Wednesday, November 17, 2010

Bears Rest, Bulls Fail to Strike; Dollar Unchanged

THURSDAY'S ADDENDUM


The rally today is quite strong but has so far stalled at its peak.  It appears the GM news is getting everyone excited again.  But the optimistic extremes in sentiment measures still suggest there's not much room left to the upside.  The S&P broke above the descending trendline I've been following, but has not made a new swing high above 1207.  A reversal and close beneath that trendline, that sits around 1192 at the end of the day today, would signal that today's rally was just a fakeout and that more selling was coming our way in the following days.  But another surge higher above 1207 would confirm that the decline from 1227 was just a series of overlapping corrective waves, and that at least one more new high should occur to cap off Primary wave ((2)).

So in summary, a move above 1207 would confirm that the decline from 1227 was just a correction and that eventually a new high above 1227 is on the way to finish off Primary wave ((2)).  But as long as the S&P stays below 1207, more selling pressure is certainly possible, and a close beneath 1192 today would be a strong signal that the short term trend remains firmly down.

WEDNESDAY'S POST


Internals today were slightly positive yet price in the major indices was basically flat.  Volume drop significantly today compared to yesterday so there was little interest in "buying the dip".  Just another sign of the trend having changed from up, to down. 


Not much to discuss as far as the market structure goes since today was a dud.  Seems like a 4th or B wave at some degree.  The short term wave count is unclear, so I'm sticking to the basics.  As long as the series of lower highs and lower lows continues, I'm bearish this market.  So the bears must defend 1207 until an impulsive decline can be counted from the early November highs. 

The bears appeared to take a breather today after selling off the market hard yesterday, but the bulls failed to step up and take advantage of it.  Volume was low and the market barely moved.  I think this is a morale killer for the bulls so I expect some more selling to enter the market as the week winds down here.  As long as 1129.24 remains intact, then we have to expect at least one more new high for Primary wave ((2)) to top.  But for the short term, staying below 1207 still keeps the trend pointing lower.

More free trading tools: Free eBook teaches you how to apply Moving Averages to your trading or investing


The US dollar barely moved today, giving us the flat charts you see above.  The euro's downtrend remains well intact and the british pound may be in a 3rd wave suggesting that we'll see new lows soon.  This means the US dollar still has a lot of bullish potential still.  Doing so will keep a lot of pressure on stocks and commodities. 

PLEASE NOTE: THIS IS JUST AN ANALYSIS BLOG AND IN NO WAY GUARANTEES OR IMPLIES ANY PROFIT OR GAIN. THE DATA HERE IS MERELY AN EXPRESSED OPINION. TRADE AT YOUR OWN RISK.

Short Term Downtrend Remains Intact

PLEASE NOTE: EWI's Forex FreeWeek is now live and ends next Thursday, November 18 at noon EST. They're giving away full access to their intraday and end-of-day Forex forecasts.


The selling pressure in the stock market today was quite intense, and fits the model of a 3rd wave at some degree.  But we need the market to play out a little more to get a high probability wave count where that 3rd wave fits in.  Volume was a solid today at 1.35 billion shares on the NYSE, down volume was 93% of total volume, and there were 6.5 decliners for every advancer.  So the bears came in and took full control of this market.  And this comes after Monday morning's big surge that was reversed by the end of the day.  This market smells of exhaustion and this is just another sign that the bears are now coming in stronger than the bulls now; something we haven't seen for a long time.  Note: just ignore the S&P data on the right side of the internals.  It's showing the Nasdaq Composite's data and won't roll over into the S&P's data for some reason.

As always, the key now is follow through.  We could get a mild rally tomorrow, but ultimately the bears want the market to continue down again by at least tomorrow afternoon or Thursday. 


So the bears need to keep the short term downtrend intact to remain in firm control of this market.  Of course the bears want the market to just continue lower from here, but rallies are going to occur regardless.  The key is that rallies don't break the series of lower highs.  So the 1207 swing high here remains important for the bears to defend here.  It's critically important for the bears who believe that Primary wave ((2)) has already topped because we don't have an impulsive decline from the highs yet.  So if you believe Primary wave ((2)) has topped already (which I don't), then it's important for swing highs to remain intact until a full impulsive wave count can be established, otherwise a new high will create a series of overlapping waves and just confirm that this decline is a correction.  Ulitmately, only a break below 1129.24 would signal that Primary wave ((2)) has probably topped already.

The action in the US dollar was encouraging for the bulls today as it continues to surprise to the upside and break down resistance.  This means that the euro and british pound are falling against the dollar.  As long as this trend continues, it should continue to put pressure on stocks and commodities.  For more details and some wave counts, please see my addendum in my prior post.

PLEASE NOTE: THIS IS JUST AN ANALYSIS BLOG AND IN NO WAY GUARANTEES OR IMPLIES ANY PROFIT OR GAIN. THE DATA HERE IS MERELY AN EXPRESSED OPINION. TRADE AT YOUR OWN RISK.

Monday, November 15, 2010

Stocks, Euro Continue to Work Lower, No Reason to Expect that to Change any Time Soon


PLEASE NOTE: EWI's Forex FreeWeek is now live and ends next Thursday, November 18 at noon EST. They're giving away full access to their intraday and end-of-day Forex forecasts.


TUESDAY ADDENDUM, 1:30pm EST


The euro smashed through 1.3560 convincingly in the US session, giving the bears the advantage again.  Doing so opens the door for more euro losses.  I think the key for the short term is for the bears to get a strong daily close beneath 1.3560 to give even more evidence that the short term downtrend is still firmly intact.  The more surprises to the downside, and barriers broken on the downside, the more likely it is that the euro has formed a major top over the long term.  Even if you're not a currency trader, understanding the impact of the euro and the US dollar is still key for equities and commodities.  A major top in the euro, and major bottom in the US dollar, will put tremendous pressure on stocks and commodities over time.


The british pound is getting punished against the dollar this morning, hinting that some degree of 3rd wave is unfolding.  As long as this holds, it suggests that the dollar is going to continue surging higher and has most likely put in a significant bottom already.  What's also of note is the the US dollar has made a new high.against the swiss franc this morning at .9970, eliminating a previous impulsive looking decline from contention.  Oftentimes when these "barriers" are established in the majors it will either lead to some sharp follow through, or a sharp temporary reversal.   So whether the dollar pulls back a bit from here is not that relevant at this time since it seems that it has most likely formed a long term bottom already.  Any dollar pullback will just be an opportunity for dollar bulls again.


Internals today reflected the closing price action in the market well.  Early this morning they were very bullish, right in line with the big surge in price.  But as the day wore on, there was little follow-through to the happy Monday bulls’ early buying, and the market was faded into the close, leaving it flat.  The Nasdaqs were the worst hit of the major indices, while the financials actually did quite well.  Volume was very light today, only 877 million shares on the NYSE, and uppers vs. downers and up to down volume was relatively flat just as price was.
So nothing really stands out here other than the usual crew of Monday bulls that like to surge this market higher early in the week were unable to sustain that push higher by the end of the day.  And not only did price break down, but so did the internals.  This market is trading very heavy right now, and it suggests buying interest is exhausted and that the path of least resistance is down.

If you look at my daily chart from yesterday you’ll know that I’m expecting a “flat” or “triangle” correction for Minute wave ((iv)).  So far, this outlook is well on track.  So far, selling and volume has been quite tame, suggesting this is just a pullback to a larger trend bull move.  Also, the lack of any impulsive decline yet also prevents us from calling any significant top with a high amount of certainty at the moement.  Only a break below 1129.24 would mean that it’s highly likely that Primary wave ((2)) has already topped and that we should be looking for aggressively lower levels.
The 15min S&P chart above shows the opposite of what I was tracking on the previous uptrend.  Many of you may remember that I said for a few weeks that although the wave count may not be clear for the rally, the serious of higher lows and higher highs tells us that we were still in an uptrend and that we should expect higher levels until that trend breaks down.  Well now on the 15min time frame we see the start of that “breaking down” I mentioned.  Now we have a series of lower highs and lower lows being established.  They’re too close together to be counted impulsively, at least so far. But as long as this trend continues of lower highs and lower lows continues, I expect price to continue to work lower in the near future.

How Analyzing Forex with Elliott Wave Can Help You Catch Both Rallies and Declines

The euro appeared that it formed an impulsive rally on Friday, but today’s deep retracement to a new low erased that potential and keeps us eyeing lower levels.  Although the wave count does not appear fully developed to label it impulsively yet, the steep slope of the decline sure suggests that a top is in and that the euro is declining impulsively much lower, probably for many months.  Right now, there’s strong support at 1.3560, and downward momentum is waning, so I’d like to see a strong sustained break below 1.3560 to instill confidence in the bearish case for the short term.  Without that happening, we have to be prepared some degree rally coming soon.

PLEASE NOTE: THIS IS JUST AN ANALYSIS BLOG AND IN NO WAY GUARANTEES OR IMPLIES ANY PROFIT OR GAIN. THE DATA HERE IS MERELY AN EXPRESSED OPINION. TRADE AT YOUR OWN RISK.

Sunday, November 14, 2010

Key Levels in Stocks and the Euro

PLEASE NOTE: EWI's Forex FreeWeek is now live and ends next Thursday, November 18 at noon EST. They're giving away full access to their intraday and end-of-day Forex forecasts.


Stocks continued their correction Friday as a Minute wave ((iv)) takes hold.  According to elliott wave principle's guideline for alternation between correcting waves, since Minute wave ((ii)) was a sharp correction, then wave ((iv)) should be more of a sideways correction.  So I'm projecting a "flat" or triangle correction now.  The timing of a sideways correction here is good too.  As the Thanksgiving, Christmas and New Year's holidays approach, less and less market participants will be in the market, usually bringing a general malaise to the markets.  If we're forming a triangle, a good guess is to move sideways into the new year, then thrust higher from that triangle in early 2011, only to complete Primary wave ((2)) and reverse sharply to the downside for a long long time.

Only a break below 1129.24 would suggest that perhaps a top is already in.


Just an update here on the XLF vs. the S&P.  Financials made a valiant attempt surrounding QE2 to catch up to the overall stock market, but as you can see, once the QE2 euphoria dissipated the financials continued to aggressively decline again leaving a lot of separation from the S&P.  A long term stock market rally cannot be sustained without the financial sector participating; at least that's my opinion.


The euro failed to pick up speed to the downside which it should be doing since a 3rd of a 3rd wave is likely the next move if a top is in.  But Friday we got a very sharp rally off the lows, making me slightly concerned for the bearish outlook here.  What's of even more concerning is the 5 wave rise off the lows, then 3 wave setback.  A break above 1.3728 would confirm that late Friday's decline was a 3 wave correction and that at least one more impulsive rally should be in the cards.  That may complete a 5-3-5 zig-zag correction higher for some degree of wave 2, but it also may be the first signs that the euro has not topped and it may continue to rally impulsively to new highs on the year.  So we need to watch the action in the euro carefully here.  With stocks looking to be in a correction for several weeks/months, and silver look to have just completed a blowoff top, I still think the euro's bearish potential here is quite high.  So I remain bearish on the euro in both the long short term until it proves to me otherwise.


PLEASE NOTE: THIS IS JUST AN ANALYSIS BLOG AND IN NO WAY GUARANTEES OR IMPLIES ANY PROFIT OR GAIN. THE DATA HERE IS MERELY AN EXPRESSED OPINION. TRADE AT YOUR OWN RISK.

Thursday, November 11, 2010

Big Picture: Euro, Stocks

PLEASE NOTE: EWI's Forex FreeWeek is now live and ends next Thursday, November 18 at noon EST. They're giving away full access to their intraday and end-of-day Forex forecasts.


Looking at the bigger picture wave count in stocks we might be in for a flat few months ahead as a Minute wave ((iv)) takes hold.  There was a pretty big and sharp move for Minute wave ((ii)) and elliott wave principle's guideline for alternation suggests we'll see a more flat correction for wave ((iv)).  This means we'll most likely have a triangle or "flat" correction take us into 2011.  My best guess at this point is a sideways move in stocks into the first or second week of January 2011 where buying interest is usually strong which might give us Minute wave ((v)) and finish off Primary wave ((2)) once and for all.  I would love to see a triangle form at this point because it would be a clear sign of a topping formation occurring, and the ensuing sharp thrust and reversal will in fact finish off the previous trend.

It's still important to note that the XLF's lagging behavior, silver's apparent blow-off top, and the US dollar perhaps having put in a major bottom, we must be vigilant in watching for stocks to top Primary wave ((2)) at any time.  I'll be focusing a lot on the euro and the XLF in the coming weeks because I feel those two markets can give us the best clues as to whether or not Primary wave ((2))'s top is near or not.  Also note that tech giant Cisco is down almost 16% at the time of writing, and they are often a leading indicator of where the overall market is heading for the next quarter.  I'm not saying the market will drop 16% as well, but the overwhelming weakness is Cisco seen today may be a sign of weakness ahead for the stock market.  Also note that today is the Veteran's Day holiday so perhaps not all market participants are fully engaged in trading and may not return until Friday or Monday.  So the selling we see in the overall market right now may not even be near complete.


Speaking of the euro, I'm posting the daily chart here of the euro vs the US dollar.  It shows a clear 5 wave decline I'm labeling an Intermediate wave (1), followed by a Minor ABC correction for Intermediate wave (2).  The triangle, thrust and reversal for Minute wave ((iv)) and ((v)) was our first clue of a major top being at hand.  If the above count is correct, the euro should be well on its way to parity with the US dollar, and probably much further.  A euro decline of this magnitude would mean a major rally in the US dollar would put significant pressure on commodities and stocks in the process.  So even if you don't trade currencies, it's worth at least tracking the euro and the dollar for clues to the future movement of commodities and stocks.

PLEASE NOTE: THIS IS JUST AN ANALYSIS BLOG AND IN NO WAY GUARANTEES OR IMPLIES ANY PROFIT OR GAIN. THE DATA HERE IS MERELY AN EXPRESSED OPINION. TRADE AT YOUR OWN RISK.

Wednesday, November 10, 2010

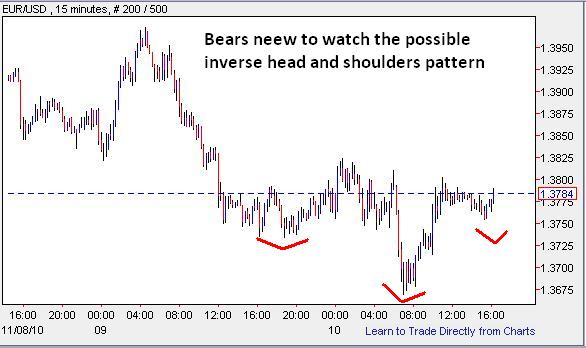
Cisco Making Futures Grumpy; Euro Bears Need to Watch for Inverse H&S


Internals today were quite bullish, and other than the Dow, the S&P, Tech, small caps and financials did quite well which explains the positive internals we see at today's close.  It seems highly possible that the stock market has formed a short term top though since silver appears to have finished a blow off top and the euro appears to have top as well.  How big of a top in stocks will only be determined as the wave structure unfolds in the coming days/weeks.  But looking Cisco down 12.5% in afterhours at the time of writing, and the S&P futures getting hammered right now as well, it's possible we'll see some more downward pressure tomorrow.


Nothing really compelling to note in the stock market as far as the wave count goes.  It seems that a Minute wave (iv) is probably unfolding which will eventually give wave to a Minute wave (v) rally that should finally cap off Primary wave ((2)) (see long term count).  Right now the Nasdaq Composite appears to be bumping up against resistance and prior congestion so a reversal from current levels would make sense.  And considering Cisco's 12.5% after hours drop it makes the reversal in Tech seem imminent.


The euro failed to pick up speed and continue its descent lower.  But the impulsive count still remains valid so I strongly favor the downside here since the profit potential is so great here.  I'd like to see the euro keep a 4hr (or higher) close beneath 1.3824 to keep my bearish stance comfortable.  A quick poke above 1.3824 and reversal doesn't count.  But a strong sharp shot and close above 1.3973 would get my attention and have me look at other markets and indicators to try and determine if the bears are still in control.

Elliott Wave Video Crash Course


On the 15min chart it gives some reasons for concern for the bears.  I don't like the sharp dip to a new low then reversal higher to trade sideways at prior congestion.  This is classic bottoming behavior, and know as an inverse head and shoulders pattern here.  This is another reason I'd like to see the euro remain well below 1.3824, because a close above that level on the 4hr chart or above may signal a sharp shot higher.  The best thing for the bears would be to see a sharp shot lower, preferably below today's low, during tonight's Asian or European sessions.  So tonight's action may be telling for the euro in the days to come.

Tomorrow is the Veteran's Day holiday.  It's on a wierd day, Thursday, but I still think a lot of folks will be taking time off and relaxing, perhaps the rest of the week like I am.  So we may not see much action or volume in the markets the rest of the week. 


PLEASE NOTE: THIS IS JUST AN ANALYSIS BLOG AND IN NO WAY GUARANTEES OR IMPLIES ANY PROFIT OR GAIN. THE DATA HERE IS MERELY AN EXPRESSED OPINION. TRADE AT YOUR OWN RISK.

Tuesday, November 9, 2010

Euro Should Continue its Decline; Stocks May be Rolling Over


Interesting market day today as it basically declined all day and formed a “rolling-over” look on the 10 day charts.  Looking at the internals we see quite a bearish picture with about 80% of stocks trading down on the NYSE at today’s close.  Volume was decent but nothing alarming.  So it seems that the uptrend may be showing signs of exhaustion and some bears may be coming in to take profits.  Looking at my daily count from yesterday we are set for a Minute wave (iv) decline, so perhaps we’re seeing the early signs of that today.  And looking at the very bearish euro count below, and the fact that it looks like the XLF (financial ETF) has finished a thrust from a triangle, it strengthens the outlook of a stock decline coming in the next few weeks.

NEW! Get 32 pages of FREE practical trading lessons in EWI's new Trader's Classroom eBook.

The above 15min S&P chart shows the rolling over action I mentioned earlier.  If Minute wave (iv) has started, I’d expect a slow, choppy and sloppy grind lower to sideways over the coming weeks.  This fits nicely with the holidays coming up which tend to bring a general malaise to the markets anyway.  Perhaps early January we’ll get the final Minute wave (v) with the beginning of the year buying in order to finish off Primary wave 2 once and for all.  But that’s pure speculation at this point.  What seems more likely is the short term picture suggesting a decline or sideways grind for at least a few weeks.

The euro continues to look extremely bearish and the US dollar looks bullish.  The euro thrusted from a triangle after the QE2 announcement but has now retraced that thrust and is testing a new low beneath 1.3696, which is all typical behavior of a finishing move.  In this case we’re looking for a finishing move that will mark a major top in the euro, and a major bottom in the dollar.  The decline so far has been very impulsive-looking so I’m expecting lower levels for the foreseeable future with the highs of last week remaining intact.

Elliott Wave Video Crash Course

It’s key to not that if the euro has topped and reversed, and the dollar bottomed and reversed, and financials continuing to lag badly, it will put pressure on stocks over the long term.  The XLF appears to have thrusted from a triangle which is now reversing itself and is now outperforming the overall market to the downside again.  A long term euro decline and dollar rally, combined with a severely lagging financial sector, spells bad news for stocks over the long run.
PLEASE NOTE: THIS IS JUST AN ANALYSIS BLOG AND IN NO WAY GUARANTEES OR IMPLIES ANY PROFIT OR GAIN. THE DATA HERE IS MERELY AN EXPRESSED OPINION. TRADE AT YOUR OWN RISK.

Monday, November 8, 2010

Euro May Have Topped, But Stocks Look Higher


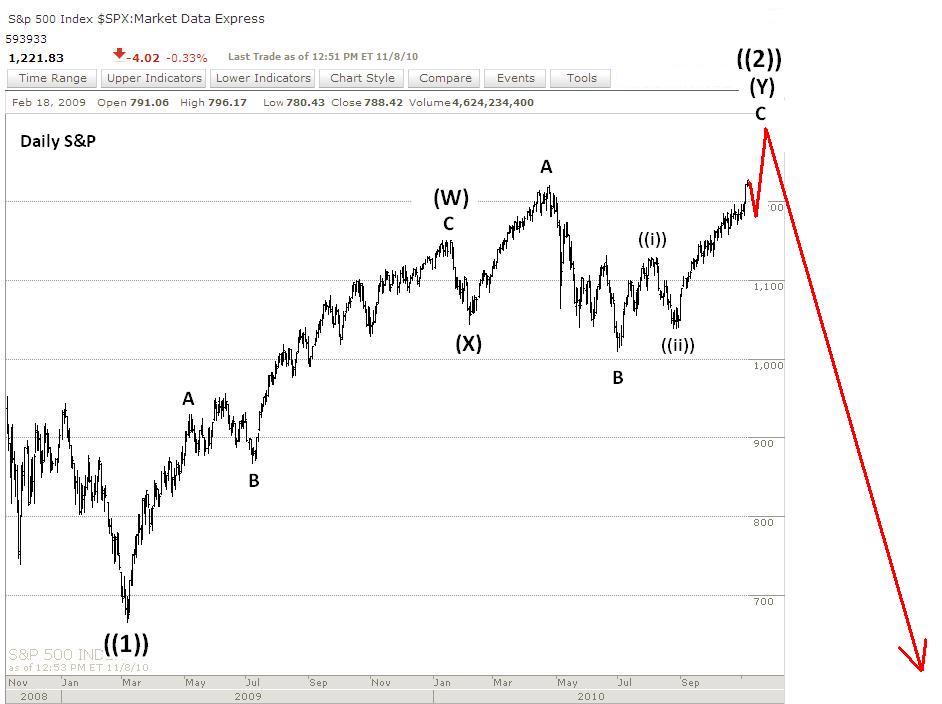
The new highs in the major indices make the bullish interpretation I've been tracking for the past couple weeks well on track.  I adjusted some of the wave labels so it fits better with the big picture.  The market appears to be completing Minute wave (iii) of Minor wave C of Intermediate wave (Y) of Primary wave ((2)).  So the market subdivisions suggest some more sideways to up action on the daily/weekly charts in the coming weeks, most likely carrying us into 2011.  We're approaching a seasonally positive time for stocks after Thanksgiving and into Christmas and New Years, so timing fits well with the bullish wave count here.

Although financials have picked up some significant ground last week to the upside, in the bigger picture they still continue to lag the overall market.  And it appears the XLF has thrusted from a triangle formation which means a sharp reversal to the downside should occur soon.  Also, the euro may have topped and US dollar may have bottomed.  All these underlying elements to the overall stock market seem to be setting up a significant decline.  But we still see no signs of the uptrend breaking, and the wave count does not appear complete, so higher levels should still be expected.

"Market Manipulation" Is Not Why Most Traders Lose


Last week I noted the possible 5 wave decline in the euro after the thrust from the triangle surround the Fed's QE2 announcement.  The decline has continued from last night's Europe and Asian sessions into the US session.  Although it's declining impulsively, it's not very sharp.  We've seen these declines in the euro on the intraday charts before where it drops impulsively but not with much conviction, and it turns out to just be a correction that leads to new highs.  We'll see if that occurs here as well, but the setup is certainly in place for the bears because if the euro has topped against the US dollar then the euro she be on its way to parity; leaving the bears with a great risk/reward opportunity here.

Also note that Thanksgiving time near the end of November tends to be a very bullish time for the US dollar and has market several major reversal over the years.  So I'll keep an eye on that timeframe to see if the wave count sets up nicely for a turn, or an acceleration in the US dollar.  A significant dollar rally will eventually put a lot of pressure on stocks.


Video: The Real-Time Power of Elliott Wave Analysis

Mainstream financial analysts always look for ways to explain market action through news stories and events. Conventional wisdom states that news and inter-market correlations cause market booms and busts, but such explanations rely on selective presentation of the data. In this video, Elliott Wave International's Asian-Pacific Financial Forecast Editor Mark Galasiewski shows you how Elliott wave analysis was able to predict Hong Kong's late '90s mania and its aftermath in real time -- without looking at the news or the market's "fundamentals."

Watch More about the Power of Elliott Wave Analysis in this FREE Video
Discover how Elliott wave analysis gives you a consistently logical explanation -- and debunk one of the major myths of what caused the Asian Financial Crisis -- in the free video, "The Real-Time Power of Elliott Wave Analysis: Debunking the Myths of the Asian Financial Crisis." Access Your FREE Video Now.


PLEASE NOTE: THIS IS JUST AN ANALYSIS BLOG AND IN NO WAY GUARANTEES OR IMPLIES ANY PROFIT OR GAIN. THE DATA HERE IS MERELY AN EXPRESSED OPINION. TRADE AT YOUR OWN RISK.

Thursday, November 4, 2010

The Final Surge Higher? (Euro Update for Friday)


In looking for a top in equities I'm watching the euro closely.  The decline today can be counted as a 5 wave impulse move suggesting a top may be in.  Unfortunately it's not a very compelling structure since it can also be counted as an ABC as well due to the relative lengths of subwaves.  But it may clear up a bit as the session moves on.  But I just wanted to post the possibilities of a euro top here as I see it.


Today's move higher both in price and internally was impressive.  Total volume was high at 1.37 billion shares on the NYSE, up volume represented 90% of total volume, and advancers well exceeded decliners.  Moves like this often act as launching pads for sustained moves higher.  Only a close below today's low will negate the bullish outlook and suggest a top may be in.  Until then, expect higher levels.

My guess is that some folks shorted the market or stayed on the sidelines expecting a "sell the news" event after the Fed announcement yesterday.  When the market held stable after the announcement and into the global sessions overnight, the shorts covered and the sidelined folks jumped in with full force.  This is what I feel was behind the move higher today.  Is it just a capitulation move before a reversal?  Or the foundation of a sustained move higher in the coming months?  Hopefully next week we'll get our answer so we can trade accordingly.

The Next Major Disaster Developing for Bond Holders


Well the inevitable happened today as the blue chips followed the Nasdaqs to new highs on the year with today's surge.  The past week or so I've assumed this would occur since the uptrend remained well intact and the Nasdaqs had already made new highs on the year, and they tend to lead the overall market.

Today's rally to new highs was done on big volume with a move that closed on the highs.  Quite convincing indeed for a larger sustained bull run.  But we'll see.  The current rally that started in August has taken little breathers other than sideways chops, making it feel a lot like a 3rd wave.  But unfortunately for the bulls the rally certainly doesn't subdivide on the intraday charts well as a 3rd wave, nor do momentum indicators support this case well either.  So it could easily be a C, or a larger zig-zag forming in my view. 

The XLF (financials ETF) was on fire today, well exceeding the market's gains again.  It gapped higher and made a new high today as well.  If the XLF continues to outpace the S&P's gains higher for a long time it may catch up to it's rally the past few months, eliminated the divergence they've had, as well as some of the best evidence the bears have to a longer term bear picture.  So I'm watching the XLF closely.

With tomorrow being Friday, I doubt a heavy bear stampede will enter the market going into the weekend, but if early next week we can get a gap down reversal in the XLF creating an island pattern, and the major indices can close below today's intraday lows, then we'd have our first solid signs that Primary wave 2 has topped and that perhaps Primary wave 3 has started.  But until that happens, we must continue to understand that the market is showing no signs of stopping its push higher and that until the above action occurs, higher levels should be expected.

"Market Manipulation" Is Not Why Most Traders Lose


Of course the euro rallied, and the dollar sank, in conjunction with the stock market rally today.  I'm counting the euro as thrusting in a Minor wave 5 from a Minor wave 4 triangle right now.  Once its thrust tops and reverses, it should mark a major top and move down to parity with the US dollar eventually.  There are no signs of reversal yet htough, but when they arise I'll certainly mention them here.  A top in the euro and bottom in the US dollar should occur about the same time equities top and reverse.


DJIA Priced in Gold: What It Means for the Long-Term Trend

Of the many forward-looking market indicators we at EWI employ, one of the most interesting tools (and least discussed in the financial media) is the DJIA priced in gold -- "the real money," as EWI's president Robert Prechter calls it. What implications might the present position of Dow/gold have for the long-term trend of the nominal Dow? In this video, Elliott Wave International's Steven Hochberg shows you several revealing charts that answer this question.
(Discover why deflation is the biggest threat to your money -- download your FREE 90-page eBook now.)

Download your FREE deflation eBook now. Newly updated for 2010, Prechter's 90-page eBook reveals why deflation is the biggest threat to your money right now. You will learn how to prepare for deflation, survive it, and maybe even prosper during it, so you'll be ready for the next buying opportunity of a lifetime when deflation is over. PLEASE NOTE: THIS IS JUST AN ANALYSIS BLOG AND IN NO WAY GUARANTEES OR IMPLIES ANY PROFIT OR GAIN. THE DATA HERE IS MERELY AN EXPRESSED OPINION. TRADE AT YOUR OWN RISK.

StatCounter