This Elliott Wave blog is dedicated to sharing Fibonacci ratios and other technical analysis for forex signals, index futures signals, options signals, and stock signals. Elliott Wave Principle puts forth that people move in predictive patterns, called waves. Identify the wave counts, and you can predict the market.
Thursday, June 2, 2011
Headlines are Doomy and Gloomy
News headlines are looking awfully bleak this morning. I said yesterday that I expected some follow through to the downside this morning and I'd take profits when that happened. Well that's exactly what we got, and taking profits seems like a good idea with these gloomy headlines above. I'd still keep some position on short, but I'd trail the stop down with the market. It's approaching oversold on at least a short term basis pretty soon.
Bottom line: The market has fallen so much so fast that we are approaching oversold on a short term basis. When you combine that with the gloomy news headlines we see this morning, I'd like to take some profits here to protect gains, and then trail my stop lower as the market heads lower.
PLEASE NOTE: THIS IS JUST AN ANALYSIS BLOG AND IN NO WAY GUARANTEES OR IMPLIES ANY PROFIT OR GAIN. THE DATA HERE IS MERELY AN EXPRESSED OPINION. TRADE AT YOUR OWN RISK.
Wednesday, June 1, 2011
Stocks Punished After Hitting Resistance; Euro Poised to Fall Hard
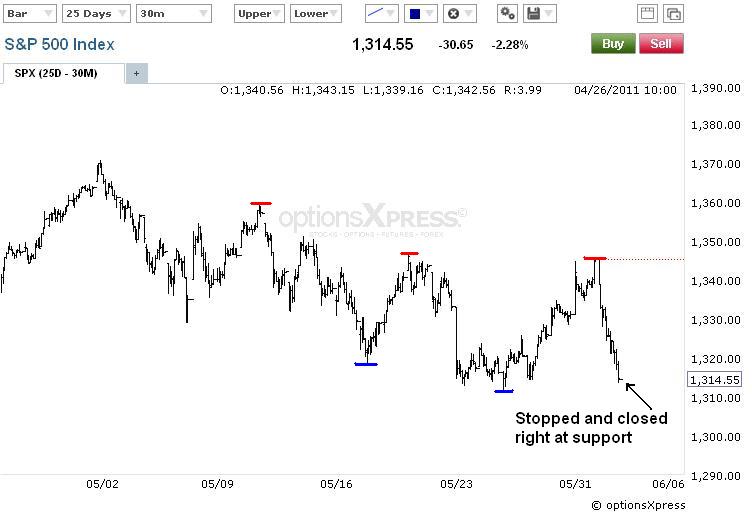
Stocks took a pounding today with the Dow losing almost 300 points and S&P losing over 30 points and closing on their lows. It was an across the board selloff as all the major indices/sectors were punished with exception of the safe haven sectors Staples, Utilities and Health Care down the least. Internals in the overall market were also bloody as declining stocks, and declining volume, well exceeded the advancers. Normally there is a relief rally after such a bloodbath internally, especially since today is the first day of a new month. But seeing as that the downtrend was held intact yesterday by failing to make a new swing high, and today's S&P close was right at support, it's quite possible we'll get some good follow-through to the downside tomorrow, especially in the morning.
Yesterday the market's rally came dangerously close to making a new swing high which would break the series of lower highs, and therefore put the overall downtrend in serious jeopardy. After that failed new high, the market sold off sharply today. Those of you who took advantage of the bearish side for a short term risk/reward trade like I mentioned yesterday did real well. And I think the market will continue lower through the current support level at least through tomorrow morning. From there, getting an over 300 point Dow drop in less than two days would be good enough for me to exit at least some of that short term trade. Since the longer term trend still seems to be up since we don't have an impulsive decline yet, I'm still leary about getting too aggressive on the bearish side too long. So very short term, I'm still bearish, but longer term I'm cautiously bullish.
I changed the degrees of waves up one notch since the flat correction I've been tracking has really expanded here. I mentioned yesterday that I wanted to see if the euro followed through higher, or reversed and broke down lower, in the overnight session. Well it didn't really do either last night, but today it showed some shakey legs before finally falling late in the trading day. Other counter US dollar pairs like the AUD/USD and GBP/USD were punished much more than the euro, so looking at the EUR/USD alone for overall US dollar action wouldn't give you a comprehensive picture. Looking at the big picture, the US dollar appears to be getting its legs back again and poised to rally hard here which means the euro should fall hard. And looking at the euro's wave count here it suggests that a wave ((ii)) top is in. This means heavy selling directly ahead for wave ((iii)) down. I remain firmly bearish this pair as long as yesterday's high remains intact.
How to Put the Wave Principle to Work
In the video below, EWI Senior Commodity Analyst Jeffrey Kennedy walks you through a basic checklist of how to put the Wave Principle to work. This clip was taken from The Wave Principle Applied webinar, originally recorded for Futures Junctures subscribers.Get 45 pages of FREE practical lessons in Elliott Wave International's Best of Trader's Classroom eBook
Would you like to learn more about trading with the Wave Principle? Get 45 pages of FREE practical lessons in Elliott Wave International's Best of Trader's Classroom eBook . Taken from Jeffrey Kennedy's renowned Trader's Classroom series, this FREE 45-page collection offers 14 actionable lessons that will help you determine entry points, stop levels and price targets for the markets you trade.
Download The Best of Trader's Classroom now
PLEASE NOTE: THIS IS JUST AN ANALYSIS BLOG AND IN NO WAY GUARANTEES OR IMPLIES ANY PROFIT OR GAIN. THE DATA HERE IS MERELY AN EXPRESSED OPINION. TRADE AT YOUR OWN RISK.
Tuesday, May 31, 2011
Stock Downtrend Tested Today; Euro Extends Correction
Stocks' downtrend remains intact by the skin of their teeth. Today's rallys stopped short of making a new high above 1346.82 in the S&P. So the series of lower highs and lower lows is still in place, and therefore the downtrend remains in place. Shorting here against 1346.82 would be a good risk/reward trade for the bears. Although in the bigger picture, with no clear wave count in place, and certainly nothing impulsive looking, I think this downward action lately is all part of a correction that will result in a move to new highs on the year eventually. So if I were short, I'd play it tight here and only for the short term action. Longer term the market still seems bullish.
Get 45 pages of FREE practical lessons in Elliott Wave International's Best of Trader's Classroom eBook
Get 45 pages of FREE practical lessons in Elliott Wave International's Best of Trader's Classroom eBook . Taken from Jeffrey Kennedy's renowned Trader's Classroom series, this FREE 45-page collection offers 14 actionable lessons that will help you determine entry points, stop levels and price targets for the markets you trade. Download The Best of Trader's Classroom now
The euro's rally has gone much deeper than I would have liked to see for my impulsive count to remain in high confidence. Breaking out to a new high makes this structure shown above look very similar to what we saw in November 2010 to January 2011 where most wavers were trying to label a clear 3 wave move as an impulsive decline. The result was a confirmation of the 3 wave decline being a correction and a sharp and long rally to new highs ensued for months. Well this structure above on the 8hr chart is starting to look a lot like that structure on the daily chart I just mentioned. If correct, then my count above is wrong and the euro is getting ready to blast off higher again. But we'll see. I'm not as convinced of the euro's bullish potential like I am for stocks. So I want to see how the euro trades the rest of the day and into the overnight session tonight. Follow through to the upside would knock me out of the short side and put me on the sidelines. But a reversal lower would keep me firmly bearish.
PLEASE NOTE: THIS IS JUST AN ANALYSIS BLOG AND IN NO WAY GUARANTEES OR IMPLIES ANY PROFIT OR GAIN. THE DATA HERE IS MERELY AN EXPRESSED OPINION. TRADE AT YOUR OWN RISK.
How to Put the Wave Principle to Work
In the video below, EWI Senior Commodity Analyst Jeffrey Kennedy walks you through a basic checklist of how to put the Wave Principle to work. This clip was taken from The Wave Principle Applied webinar, originally recorded for Futures Junctures subscribers.Get 45 pages of FREE practical lessons in Elliott Wave International's Best of Trader's Classroom eBook
Get 45 pages of FREE practical lessons in Elliott Wave International's Best of Trader's Classroom eBook . Taken from Jeffrey Kennedy's renowned Trader's Classroom series, this FREE 45-page collection offers 14 actionable lessons that will help you determine entry points, stop levels and price targets for the markets you trade. Download The Best of Trader's Classroom now
The euro's rally has gone much deeper than I would have liked to see for my impulsive count to remain in high confidence. Breaking out to a new high makes this structure shown above look very similar to what we saw in November 2010 to January 2011 where most wavers were trying to label a clear 3 wave move as an impulsive decline. The result was a confirmation of the 3 wave decline being a correction and a sharp and long rally to new highs ensued for months. Well this structure above on the 8hr chart is starting to look a lot like that structure on the daily chart I just mentioned. If correct, then my count above is wrong and the euro is getting ready to blast off higher again. But we'll see. I'm not as convinced of the euro's bullish potential like I am for stocks. So I want to see how the euro trades the rest of the day and into the overnight session tonight. Follow through to the upside would knock me out of the short side and put me on the sidelines. But a reversal lower would keep me firmly bearish.
PLEASE NOTE: THIS IS JUST AN ANALYSIS BLOG AND IN NO WAY GUARANTEES OR IMPLIES ANY PROFIT OR GAIN. THE DATA HERE IS MERELY AN EXPRESSED OPINION. TRADE AT YOUR OWN RISK.
Wednesday, May 25, 2011
Stock Trend Remains Down, Although a High Confidence Wave Count is Elusive; Euro Trend Down
Today's action was bearish in my view. The internals showed mild total volume, but not as light as earlier in the week when we were in the 800s million shares. But up vs down volume was only slightly bullish and the advancers vs decliners were mildly bullish. Yet you'd think the market would look stronger than that internally since the whole trading day seemed like it had its rally jets on as it continually floated higher. But it didn't. Today' rise appears corrective when looking at it internally compared to the price action. And when you add the fact that the gains the market made today fell apart sharply at the end of the day, price action also lends itself to a bearish day. So even though the markets closed up today, it was not an impressive move higher by any means.
There's not much new to add here from Monday's post. Tuesday was a nothing day, and today wasn't much better in helping us get a high confidence wave count. Today's move higher looks corrective, and although it may float higher tomorrow and Friday, as long as it stays below 1346.82 then I'm short term bearish overall.
5 Ways the Wave Principle Can Improve Your Trading
The euro appears to be completing a 3 wave rise for wave ii within wave (iii). IF the euro continues higher, it should be short lived and give way to immediate sharp selling well below 1.4000. On a short term basis I'd be shorting rallies against the wave (ii) high at 1.4344.
PLEASE NOTE: THIS IS JUST AN ANALYSIS BLOG AND IN NO WAY GUARANTEES OR IMPLIES ANY PROFIT OR GAIN. THE DATA HERE IS MERELY AN EXPRESSED OPINION. TRADE AT YOUR OWN RISK.
Monday, May 23, 2011
Stocks Slump; Euro Falls
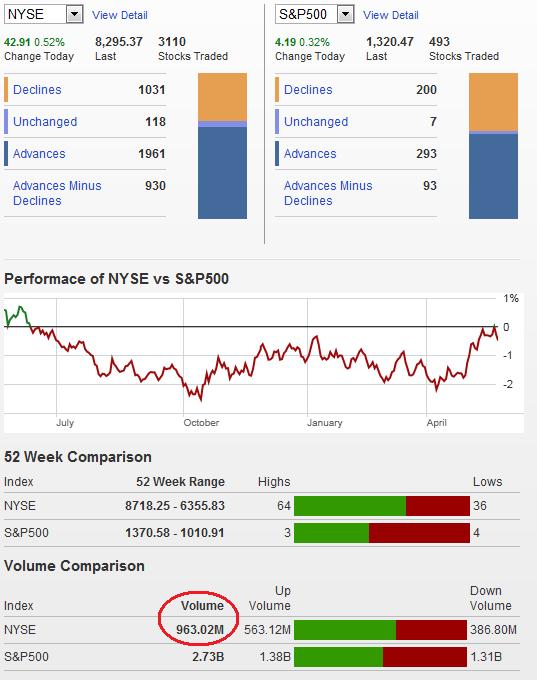
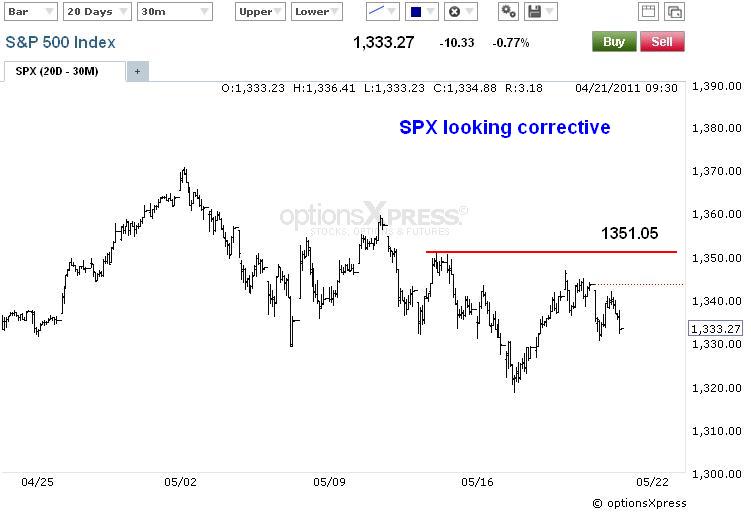
Internals were very bearish today with down volume well exceeding up volume and advancers vs decliners on the NYSE and S&P heavily negative. But total volume on the NYSE was quite light at only 865 million shares. In the bigger picture, the internal structure of the decline over the past several weeks feels corrective. But that doesn't mean it can't continue lower in the short term.
5 Ways the Wave Principle Can Improve Your Trading
As I mentioned Friday the structure in the blue chip indices is very choppy and filled with 3 wave moves suggesting it's corrective. But this correction can continue lower and develop into a WXY combination correction which it's hinting it now wants to do. Without a confident impulsive count to focus on here, I'm going to stick to the very basics. There is now a series of lower highs and lower lows in place from the high. This will define the downtrend until I can better assess the short term wave count. As long as the series of lower highs and lower lows remain in place, I have a bearish bias. I am not getting short though until I get a good impulsive decline with supportive internals.
Market Trends Trading Made Easy - Learn How
Last Wednesday I put forth an impulsive count with a flat correction to unfold before the resumption of the downtrend (click here for count). The market has fulfilled the forecast so far, and in doing so it has given me confidence in my wave count labeling here. Expect the euro to continue lower, and the US dollar to rise for the foresable future.
PLEASE NOTE: THIS IS JUST AN ANALYSIS BLOG AND IN NO WAY GUARANTEES OR IMPLIES ANY PROFIT OR GAIN. THE DATA HERE IS MERELY AN EXPRESSED OPINION. TRADE AT YOUR OWN RISK.
Friday, May 20, 2011
Stocks Indecisive, but Price Action Looks Corrective; Euro Resumes Downtrend
Internals today were fairly bearish and volume hit the 1 billion share mark on the NYSE, no doubt options expiration played a big part in puffing that number up The first and last 30 minutes of trading pushed the market down towards the triple digit level on the Dow, closing barely in double digits at -93. The first and last 30 minutes are usually when options expiration factors are the strongest. Outside of those two timeframes, the market was fairly flat. Tough to get any solid conclusions from this action in my view.
5 Ways the Wave Principle Can Improve Your Trading
Wednesday I said, "The euro appears to be in a flat correction. Wave c should finish shortly after it exceeds the wave a high. Once it does so it will be open for a sharp reversal to the downside." Well that's exactly what happened. When the price action fits the forecast it usually means we're on the right track in wave labeling. I'll stick with the count above so expect sharp selling in the near future for wave (iii), with today's high remaining intact.
Market Trends Trading Made Easy - Learn How
Also worth noting, the euro had a very choppy and sloppy slow grind higher, typical corrective behavior, which led to today's big and sharp impulsive looking decline. Today's action formed a nice bearish engulfing formation where the high exceeded yesterday's high but then closed well below yesterday's intraday low. This is bearish and a good signal that a top is in place.
PLEASE NOTE: THIS IS JUST AN ANALYSIS BLOG AND IN NO WAY GUARANTEES OR IMPLIES ANY PROFIT OR GAIN. THE DATA HERE IS MERELY AN EXPRESSED OPINION. TRADE AT YOUR OWN RISK.
Thursday, May 19, 2011
Stocks Failing to Follow Through to the Upside; Euro Looking Vulnerable
Internals posted above. You can see there is light volume today suggesting a lack of enthusiasm towards moving the market higher after yesterday's surge. But closing higher on the day has kept me on the sidelines from getting short. The short term has a slight bullish bias to it while the longer term indicators are slanted to the bearish side (especially momentum). Below is what was posted mid-day today.
Stocks so far are failing to follow through with yesterday's rally. A sharp reversal and new swing low would be a welcome sign for the bears, but right now we don't have it. Still watching, waiting.
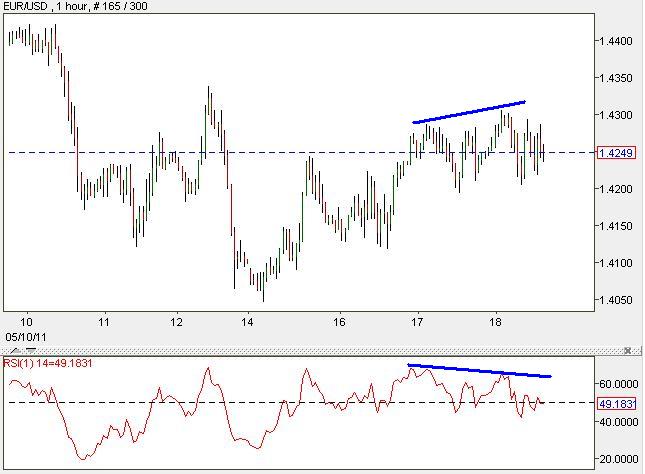
The euro on the other hand is looking very weak and vulnerable to a selloff as you can see from the above chart. The price action is choppy and starting to struggle significantly. The RSI reflects that struggle as it is now diverging from price on the hourly chart. I like shorting this pair on a break below 1.4200 and then placing a stop just above 1.4300. I think that breaking down below 1.4200 would be a good enough sign that the pair is probably breaking down to where I can put some money on it and potentially get some huge gains real quick with minimal risk.
EUR/USD: Falling on "Risk Aversion"? Let's Look at the Timeline First
PLEASE NOTE: THIS IS JUST AN ANALYSIS BLOG AND IN NO WAY GUARANTEES OR IMPLIES ANY PROFIT OR GAIN. THE DATA HERE IS MERELY AN EXPRESSED OPINION. TRADE AT YOUR OWN RISK.
Wednesday, May 18, 2011
Stocks Close Back Above Support; Euro Finishing up Flat Correction
Internals were strong as far as advancers vs decliners although volume was light at 881 million NYSE shares, much less than yesterday. Regardless of total volume, the strength seen internally today suggests further upside. But we'll see.
5 Ways the Wave Principle Can Improve Your Trading
I like to keep things simple. My philosophy is that when I start overcomplicating analysis it's usually because I'm trying to justify my current bias. In other words, if I'm bearish and have a short position I will push aside bullish evidence and continue to grind down the charts and indicators until I get a bearish view, which often includes make things more and more complicated. This is done to convince myself that I was originally right by going short. So a long time ago I removed this basic human emotion of always wanting to be right by just using the simplist conclusion as top choice.
This thinking applies here. EWP is centered on the fact that 3 waves are corrective (counter trend), and 5 waves are impulsive (with the trend). Looking at the above chart it's quite clear that there are only 3 waves down from the high, and that it's a choppy mess to boot. Looking at this chart alone, and keeping things simple, it tells us that most likely this decline is just a correction and may have completed. There is a lot of bearish evidence out there right now on the larger timeframe charts, but because they're on such larger timeframes it is easier for those bearish indicators to remain in place for many days, or weeks, while the market moves higher.
If we're keeping things simple, then we should conclude that we're in a downward correction that probably has ended, and the market's uptrend is now back in force. This goes strongly against what I thought earlier in the week. But I have to call it as I see it. I don't want to get too caught up here with a decisive bullish or bearish stance since the picture is a bit mixed here. So I'll wait until tomorrow and see if today's rally has any follow through before I take a definitive stance.
Market Trends Trading Made Easy - Learn How
In addition to what I just mentioned, the S&P reclaimed the previous support level convincingly, confirming that it was just a false breakout before.
So the longer term evidence is bearish, the short term evidence suggests a bullish bias. I'm not getting long here though, I want to see what happens tomorrow, and see if the rally has follow through first.
The euro appears to be in a flat correction. Wave c should finish shortly after it exceeds the wave a high. Once it does so it will be open for a sharp reversal to the downside. Risk is wide here since wave (ii) can retrace up to 100% of the entire previous decline so proper money management should be followed here to make sure you don't get blown out in case this pair moves against you to the upside.
PLEASE NOTE: THIS IS JUST AN ANALYSIS BLOG AND IN NO WAY GUARANTEES OR IMPLIES ANY PROFIT OR GAIN. THE DATA HERE IS MERELY AN EXPRESSED OPINION. TRADE AT YOUR OWN RISK.
Tuesday, May 17, 2011
Stocks Should Continue Lower; Euro Finding Support, but Should be Short Lived
Internals today don't tell me much. Volume was farely quiet at under 1 billion NYSE shares, and the rest of the internals were slightly bearish just like the overall market was. What is of note is the fact that the Dow took the biggest hit today and closed with the biggest losses of the major indices. The S&P and Nasdaqs didn't do nearly as bad, so looking at the Dow alone for overall market performance today would not be wise. It was basically a flat day with a slight bearish slant. Whether the S&P and Nasdaq strength is a sign of a just a temporary relief rally, or the start of a more established floor and resultant rally is yet to be seen. The evidence is still overwhelming that at least a decline of a few more weeks should be underway though. I still favor the bearish side right now.
Learn Elliott Wave Principle
The S&P is looking like a choppy mess. Tough to label this impulsive at this point. Right now it's looking more corrective in nature. But a lot of big impulse waves often start out imperfectly, so I'm not going to hold this too much against the bearish scenario right now. But it is on my radar. As a waver, I'd like to see a sharp drop lower soon so I could label it a 3rd wave and see how the rest of the waves fit in from there. But right now, I'm seeing only a choppy grind lower on the 30min chart.
Stock Research and Trading Alerts - Click Here
The S&P easily brokeout to the downside with its convincing move, and then close, below 1329.51. Now I know that it basically closed right on that support level, but technically it did close just below it. The S&P shot through the 1329.51 level sharply, and then did a slow choppy rally back near that level again where it closed today That tells me the breakout to the downside has some conviction, and the move higher was just the typical retest of prior support before it turns lower. So I expect more selling tomorrow to follow through with this downside breakout. But if I'm wrong, and the market moves higher and closes well above 1329.51 then it was probably just a "false breakout", which would have bullish implications in the coming days.
Get Big Picture Index and Commodity Forecasts Here
The euro is finding support around the 1.4200 level, but the bulls have so far been unable to sustain a rally or even make a new high. Until that happens, the trend is still firmly down in my view. Making new highs and rallying sharply here wouldn't necessarily remove the bearish bias I have, it would just lessen my conviction of it a little.
PLEASE NOTE: THIS IS JUST AN ANALYSIS BLOG AND IN NO WAY GUARANTEES OR IMPLIES ANY PROFIT OR GAIN. THE DATA HERE IS MERELY AN EXPRESSED OPINION. TRADE AT YOUR OWN RISK.
Monday, May 16, 2011
S&P Gives us Clear Breakout Levels; Euro Topped
Internals posted after the US session ended. The rest of this post below was posted around midday through the US trading session.
With that said, I see some big picture signs here that may mean that this downturn is more than just a simple one or two week event. For the short term I posted the breakout levels I see are important to watch. A solid break above 1359.44 should signal a shot higher to new highs on the year soon after. But a solid break below 1329.51 should signal an acceleration of the current downtrend for at least a few weeks. And by "solid break" I mean a break that lasts more than a few hours and with strong internals.
Learn Elliott Wave Principle
Earlier I mentioned bigger picture signs that something big might be unfolding to the downside. One of the reasons I said this is because of the weekly momentum picture as seen here through the RSI and stochastics. Both diverged from price at the latest high, the stochastics have now crossed and are trending down nicely, and the RSI has turned down as well. The larger the time frame, the more reliable I see these indicators, and right now, both of these indicators have lots of room to run to the downside on their weekly charts before reaching oversold. So the market is sure primed for a selloff to last at least a few more weeks.
Stock Research & Trading Alerts - Click Here
Also of note, the Nasdaq 100 and financials ETF (XLF) have dipped out of the stock market rally early. The NDX has already broken out to the downside, and normally the blue chip indices like the S&P 500, follow the higher risk Nasdaqs. If so, the NDX's price action suggests that the breakout for the S&P will be to the downside. So look for 1329.51 in the S&P to get taken out soon. It's also worth noting that the financials dipped out of the stock market's rally months ago, perhaps an even more deadly sign for stocks.
So the market hasn't yet given us any conclusive signs of a major top that will last several months or even years, but the door is certainly open for that to occur in the coming weeks. As a trader, until that happens I'll continue to the play the short term as I see it. That means I'm watching the breakout levels I posted above and will play the market accordingly to what happens to those levels in the coming days.
Get Big Picture Index and Commodity Forecasts Here
The euro top is looking good here. We had several daily dojis occur that was followed by sharp selling in an impulsive manner that suggests a major top might be in. I'm playing the short side every chance I get. Today's rally allowed by to start getting my feet wet on the short side.
PLEASE NOTE: THIS IS JUST AN ANALYSIS BLOG AND IN NO WAY GUARANTEES OR IMPLIES ANY PROFIT OR GAIN. THE DATA HERE IS MERELY AN EXPRESSED OPINION. TRADE AT YOUR OWN RISK.
Thursday, May 5, 2011
Be Back the 16th
Stocks appear to be undergoing the pullback I've been suspecting the past two days and the euro has declined sharply while remaining shy of new high on the weekly charts, and doing so just after an overbought and diverging RSI took place. Tops appear to be in place in both stocks and the euro. Not sure to what degree these tops are as of yet, but tops nonethless. I'd favor the short side in the next few days.
I'm taking time off from the markets. I'll be back the 16th. Good luck all!!
Todd
I'm taking time off from the markets. I'll be back the 16th. Good luck all!!
Todd
Monday, May 2, 2011
Stocks Pause; Euro Rally Struggling - Where to from here?
Internals today were slanted towards the bearish column, but not substantially. Stocks surged out of the gate higher but could not sustain that upward push very long. The market closed flat on the day with the Nasdaq faring the worst. Not the kind of internals I'd expect to see on a big reversal day, but it is the kind of action I'd expect to see on mild profit taking as a result of the Osama bin Laden killing since I'm sure traders are going to be a bit on guard until they see what might happen to the stability of the Middle East, oil interests, and US security measures before they pump a lot more cash into stocks. So we might get a lethargic or down week as a result of profit taking and slight risk aversion.
The daily chart shows a mild reversal bar that might have move credibility if it closed beneath 1360.14 or especially below 1358.69, and if there was high volume today. None of that happened though. So I don't want to read too much into this pattern here, but if we continue to slide lower in the overnight session then it might be worth taking a tight risked stab at the short side........TIGHT RISK.
The shorter the chart's timeframe, the less reliable the wave count will be, at least that's how I view things. With that in mind, it can be concluded that a small Submicro impulsive decline finished up today, along with it's corrective Submicro wave (2). If correct, the market should fall hard tomorrow in Submicro wave (3). Like I said earlier, a decline into the late night session tonight might indicate a short term trend change to the downside.
Learn Elliott Wave Principle
Above is the Euro's weekly big picture count I keep refering to when I say that the larger trend is down so that's why I'm always looking for shorting opportunities. But Intermediate wave (2) is running out of room to remain valid. So if this count is correct, the euro better get to topping soon.
The daily euro chart shows us an RSI that is overbought, and several doji candlesticks that often signal a reversal in trend is coming. But nothing conclusive at this point unfortunately.
Get Big Picture Index and Commodity Forecasts Here
The 4hr RSI is telling a bearish story that might make its way to affecting the daily timeframe soon. This 4hr chart shows a divering RSI compared to price, a very bearish development, especially if this behavior moves into the daily charts.
So the euro is running out of room for the larger bearish count to remain intact. There are some momentum signs of exhaustion starting to hit the euro, but no real compelling evidence that a top is in place to where I'd want to get short here. I think the best strategy is to just sit and wait for a sharp move lower, preferably a 5 wave move, and get short that decline with a stop just above the recent swing high. Until then, I'm on the sidelines doing what I do best, sitting on the couch, watching the NBA playoffs, drinking lots of beer and annoying my girlfriend.
PLEASE NOTE: THIS IS JUST AN ANALYSIS BLOG AND IN NO WAY GUARANTEES OR IMPLIES ANY PROFIT OR GAIN. THE DATA HERE IS MERELY AN EXPRESSED OPINION. TRADE AT YOUR OWN RISK.
Thursday, April 28, 2011
Stock Uptrend Remains Solid; Dollar Decline Today Looks Suspicious
Internals were similar today as to what they were yesterday, i.e. strong bullish bias on volume just under 1 billion shares on the NYSE. The market's float higher continues with no end in sight here. The bears are simply non-existent and have no purpose or will right here.
Get Big Picture Index and Commodity Forecasts Here
The S&P count I have for a WXY combination correction is getting quite elongated here. But so far it seems the most likely candidate in my view if we look at present data, or perhaps simply an ABC flat correction. At this point, it doesn't matter. You'll notice that so far we have two 3 wave moves on our hands with an abc decline and rally, so far. The reason I'm skeptical of this rally being an impulse wave where it's currently in a 3rd wave of that impulse is because volume and momentum indicators (RSI) are at overbought levels and showing a bearish divergence. This is definitely NOT the characteristics expected at the early stages of 3rd waves. There are certainly other potential wave counts, but with 3 waves down and then 3 waves up on weak volume and momentum, it suggests it's part of a correction.
The other possibility is that it's a very weak 5th wave that might end up truncated at some point, or perhaps it's an ending diagonal. If the market holds up a few more days then this current WXY count I'm tracking is going to get bumped by a count suggesting a truncated 5th wave, or ending diagonal pattern forming. But all-in-all, there are no signs of a top here. So I expect higher levels ahead.
Learn Elliott Wave Principle
The US dollar is still dribbling lower into what will eventually be a substantial bottom and resultant monster rally. There's been a sharp increase in volume the past week or so, a big part has to do with the Fed meeting this week of course. But there was more volume on the dollar index today than there was on yesterday's "Fed day", and more than there's been in several months. There was also a modest reversal bar in place today. Nothing really convincing unfortunately, but still, something to be aware of. With sentiment towards the dollar so extremely bearish right now, today's strong uptick in volume that's the result of a seemingly endless slow choppy dribble lower, may be a sign of capitulation and that a bottom is at hand.
I'm waiting for confirmation. The evidence today is not nearly enough. I want to see a sharp 5 wave rally and some swing highs broken. Until then, I'm neutral.
PLEASE NOTE: THIS IS JUST AN ANALYSIS BLOG AND IN NO WAY GUARANTEES OR IMPLIES ANY PROFIT OR GAIN. THE DATA HERE IS MERELY AN EXPRESSED OPINION. TRADE AT YOUR OWN RISK.
Wednesday, April 27, 2011
Stocks Traded Well Today; Dollar Downtrend Remains Well Intact
Stocks traded very well today. They started off floating higher and continued a slow methodical and healthy move higher without much volatility during and after the Fed action today. This is either a great stepping stone for the bulls, or a big fakeout made to lull the unsophisticated bulls to sleep as the bears pull the rug out from under this market tomorrow. I see no evidence of that happening though, so saying it will happen would simply be a guess. Right now the evidence suggests the uptrend is still intact and higher levels will be achieved.
Trading Market Sentiment
With diverging momentum on the RSI, weak volume, and fairly optimistic sentiment, it's hard to think that the S&P is at the start of a 3rd wave higher which the bullish count might suggest. Instead it still fits well with the combination WXY correction I've been tracking the past few weeks. The X wave is a flat correction that will give way to a sharp 3 wave drop for wave Y. But with the market looking strong at the moment, I'm not going to gamble on a short position here though. I'd rather be long here with a VERY tight stop if I absolutely had to take a position. But I don't, so I'm neutral at the moment.
Learn Elliott Wave Principle
The dollar's slow choppy grind to new lows the past several weeks has been quite tidious to watch since I'm waiting for a major dollar bottom and reversal. But as you can see here, there are no signs of reversal at the moment. Today's big volume was a result of the Fed action, and a nice sharp rally tomorrow might be a sign that today's decline was a capitulation move, meaning that a bottom is in place. So a sharp rally in the dollar (sharp decline in the euro), would get me long the dollar and/or short the euro. Until then, I'm neutral the buck.
PLEASE NOTE: THIS IS JUST AN ANALYSIS BLOG AND IN NO WAY GUARANTEES OR IMPLIES ANY PROFIT OR GAIN. THE DATA HERE IS MERELY AN EXPRESSED OPINION. TRADE AT YOUR OWN RISK.
Tuesday, April 26, 2011
Market Should Float Until Fed Time; Euro Position Stopped Out
Waiting on shorting stocks until I got more evidence of a top proved to be a wise move. However rolling the dice on the euro and shorting it prematurely yesterday was NOT a good choice. Volume today was light overall, but much higher than yesterday's almost non-existent volume which was under 700 million shares on the NYSE. Trader's are waiting for the Fed tomorrow before big volume moves occur I'm sure. Tomorrow we get an early morning Fed announcement followed by Bernanke's face and speech. So there should be increased volatility tomorrow and Thursday. Be ready.....I'm looking to short when the opportunity arises. At the moment, I am not short stocks or the euro though. But that could easily change tomorrow/Thursday. Be ready.
How To Trade Market Sentiment
PLEASE NOTE: THIS IS JUST AN ANALYSIS BLOG AND IN NO WAY GUARANTEES OR IMPLIES ANY PROFIT OR GAIN. THE DATA HERE IS MERELY AN EXPRESSED OPINION. TRADE AT YOUR OWN RISK.
Subscribe to:
Posts (Atom)