This Elliott Wave blog is dedicated to sharing Fibonacci ratios and other technical analysis for forex signals, index futures signals, options signals, and stock signals. Elliott Wave Principle puts forth that people move in predictive patterns, called waves. Identify the wave counts, and you can predict the market.
Friday, October 7, 2011
Key Level For S&P; Euro Bumping Up on Trendline
Stocks continue to move higher after that big reversal that got my attention a few days ago. Although it seems likely that 5 Minor waves down have completed and therefore finished Intermediate wave (1), the market still has work to do to prove a major bottom is in. The series of lower lows and lower highs on the daily chart is still intact. So it's possible we'll still get another drop lower to a new low in a choppy grinding torturous 5th wave. I am not projecting that move, but I'm simply sayings it's still on the table until a new swing high can be established, breaking the series of lower highs. So getting too aggressively bullish here for a swing trader like me does not seem wise. That new high is above 1195.86 in the S&P cash. A strong break and close above that level will probably get me to finally go long in anticipation of a long and deep Intermediate wave (2) correction higher. Until then, I'm neutral and I wait.
Bob Prechter's EWI is Offering a Free Trading eBook Until October 17th - "Trading the Line"
The euro continues higher but it too has not made a new high to break the series of lower highs and convince me the trend has turned up. You can see I drew a hasty trendline where the euro is currently bumping up against. I wouldn't be surprised that a strong break above that trendline will lead to an imminent breakout to a new swing high above 1.3700 shortly after. From there, 1.4000 is the target. I'm still unsure of the short term direction of the euro so I'm only holding a long term short position here. A strong move above 1.3700, and 1195.86 in the S&P, will probably get me looking at the long side though for short term trading.
Learn Elliott Wave Principle
PLEASE NOTE: THIS IS JUST AN ANALYSIS BLOG AND IN NO WAY GUARANTEES OR IMPLIES ANY PROFIT OR GAIN. THE DATA HERE IS MERELY AN EXPRESSED OPINION. TRADE AT YOUR OWN RISK.
Wednesday, October 5, 2011
Stocks Continue Higher, Continue to Build Case for a Bottom; Euro Fills Gap at 1.3385, is that it for the rally?
Today's move was solid, and while the percentage of volume to the upside was similar to yesterday's at 84%, overall volume decreased today to 1.2 billion shares, down from 1.7 billion shares. So this alone is not a confirmation that a bottom is in and Intermediate wave (2) is underway. But the structure of the decline is far from perfect for an impulsive 5th wave, if that's actually what's occurring. So the outlook right now is mixed, which is just another reason in my view to be neutral here and reduce risk on the short side.
Stocks: Buying Opportunity or "Free Fall" Ahead? Bob Prechter's Free Report Expires October 7th
If Minor wave 5 is in fact in right now you can see that it's a very imperfect wave, and would probably have to be labeled as an ending diagonal even if it's not symetrically correct. This would be a good illustration of what I meant by 5th waves unfolding unpredictably and imperfect, making them very difficult and stressful to trade especially when you know a major reversal of the entire 5 wave move is about to occur at any time.
But is Minor wave 5 and Intermediate wave (1) complete? I can't say so with a high degree of confidence. A week or so ago I said I had little doubt that we'd get a new low in stocks before a major rally phase got underway. And we in fact finally got that new low this week. But now what? What I can say is that I feel good being neutral here, and that the downside looks very risky while trying to find a good time to get long is more appealing.
Put EWP aside for now. Notice that yesterday and today the Nasdaq has been on fire compared to the blue chips. Again this is a bullish sign as long as it exists. And when you combine that with the divergence between the Composite's new low not confirmed by the 100 this week, it makes me think a larger move higher might be getting underway. Also notice the price action the past 2 months. Price has been choppy and sideways, creating a push-pull battle between bulls and bears. Then a break down to a new low Monday, followed by two fairly strong days Tuesday and today which took price comfortably back into the congestion area. In my opinion, that tells us that the bears threw everything they had into pushing the market lower to continue the prior Minor wave 3's work. But it took everything the bears had to make a slight new low before the bulls pushed the market back almost immediately to close back with the "battleground" area again today. That tells me that it's quite possible the bears have run out of steam and momentum to push this market much lower at this point, and if the bulls choose to strike here they have a good chance of taking out the exhausted bears with a continued surge higher. Again, the theme here is to reduce risk on the short side.
Bottom line: the risk seems to be to the downside and I'm looking to get long for a big Intermediate wave (2) rally that should last a few months. A move above 1195.86 would be a good sign that Intermediate wave (2) up is underway, depending on the internal strength of the move.
Learn Elliott Wave Principle
Yesterday I said the euro would charge toward 1.3400 and close the gap from Sunday and we could say that it has done so with its move to 1.3385. I'm unsure it will continue higher from here though so I like being only 50% short with my long term position. Any follow through higher should lead to an eventual attack of 1.4000 again. A break down from here would probably mean new lows were just around the corner to get it to 1.3000 at least. And it will probably take stocks down with it.
PLEASE NOTE: THIS IS JUST AN ANALYSIS BLOG AND IN NO WAY GUARANTEES OR IMPLIES ANY PROFIT OR GAIN. THE DATA HERE IS MERELY AN EXPRESSED OPINION. TRADE AT YOUR OWN RISK.
Tuesday, October 4, 2011
Stock Reversal MIGHT Have Legs; Euro Charging Toward Gap Near 1.40
Today's late day reversal was impressive as far as the price action goes and internally it was quite strong as well since with only 1 hour of rallying the NYSE had about 85% of volume trade to the upside and almost 1.7 billion total shares traded. This rally got my attention.
Stocks: Buying Opportunity or "Free Fall" Ahead? Bob Prechter's Free Report Expires October 7th
Yesterday I said I lightened up my short positions because with the new low in the S&P it satisfied EWP's requirments for a 5th wave in an overall impulsive move. And with 4th and 5th waves being so unpredictable I feel it's too risky to get greedy here. Today's early morning decline looked good for the bears and the wave count I've been tracking since it suggested an acceleration of the downtrend was underway. But when you peeled the onion back deeper you'd notice that the euro was flat and the Nasdaqs were trading much stronger than the Dow and S&P, a bullish sign. Two big divergences in the euro and Nasdaq compared to the blue chips is an important indicator since the euro and especially the Nasdaqs tend to lead the overall stock market.. Then when I saw the market rip higher at the end of the day it was enough for me to see to get me fully out of my short positions. I'm all about reducing risk when in a profit and that's what I'm doing. Sure the market can cascade lower like the wave count suggests, but the risk here of a major longer term reversal higher is too great, and so I'm neutral now.
I'm not posting the wave count today because it suggests major selling ahead, which may still be true. But the theme of tonight's post is that of caution for the bears and I don't want to have a chart with a wave count that suggests major selling ahead while saying that I'm being cautious and have removed all my short positions. That will only cause confusion.
Tomorrow's action will tell us a lot. If the market stays firm and even follows through to the upside on solid volume, then I'll be looking to get long soon since Intermediate wave (2) up might be underway. But if today's big rally is completely reversed tomorrow, then it's game on again for the bears. So tomorrow's action is important. Right now, I have no equity positions at all.
Learn Elliott Wave Principle
Yesterday I mentioned that the euro is getting oversold and that I lightened up some of my short positions and with today's rally I lightened up a little more. The euro may be simply heading higher to close its gap just below 1.3400, or it may have put in a big reversal that will drift the euro higher towards 1.4000 during the next several weeks. Either way, the euro was oversold and bounced sharply today which screams at me to reduce risk and take profits. I do still have 50% of my original short position on, but that is more of a long term play.
PLEASE NOTE: THIS IS JUST AN ANALYSIS BLOG AND IN NO WAY GUARANTEES OR IMPLIES ANY PROFIT OR GAIN. THE DATA HERE IS MERELY AN EXPRESSED OPINION. TRADE AT YOUR OWN RISK.
Monday, October 3, 2011
Stocks' 5th Wave in Full Force; Euro Getting Oversold
Today was a solidly bearish day with decent volume at over 1.4 billion NYSE shares traded and about 97% of all shares traded going to the downside. But again, this is not as intense as we saw on Minor wave 3 down which had about 2.5 billion shares traded and 99% of volume trading to the downside. So the lightening up of intensity fits well for this being a 5th and final wave as we're counting it since 5th waves have decreasing momentum compared to the previous 3rd wave at the same degree.
Stocks: Buying Opportunity or "Free Fall" Ahead? Bob Prechter's Free Report Expires Soon
The way I'm counting the S&P above suggests the major downside for Minor wave 5 is just getting underway. However, as I've said many times, 5th waves are tricky and often imperfect. Since I had such success shorting Minor wave 3 and some of this Minor wave 5 as of today's close, I took a lot of profits on my short position late today. I wanted out of the S&P around 1100 in the cash market and we closed almost right on that number, which is perfect for me. Sure the market can fall hard like the count above suggests, but since this is a 5th and final wave, and that once Minor wave 5 is over it means that a very large and long Intermediate wave (2) rally will get underway, I'm protecting my profits and minimizing risk here.
For those who are aggressive and vigilantly watch the markets they might want to hang on short with a clear and disciplined exit strategy. Those who are more like me and take a more conservative swing trade approach might want to consider lightening up short positions considerably with hard stops on the short positions left in. My opinion.
Learn Elliott Wave Principle
Shorting the euro the past several weeks has been very profitable. Price action and structure does not suggest the euro is oversold, but common sense and the RSI do suggest it's oversold. I covered half of my short positions at a hefty profit and will watch the action closely for a bullish reversal so I can exit the rest of my short positions. This is only a short term move, I will again reshort the euro at a later time since I feel long term the euro is bearish and the US dollar is bullish.
PLEASE NOTE: THIS IS JUST AN ANALYSIS BLOG AND IN NO WAY GUARANTEES OR IMPLIES ANY PROFIT OR GAIN. THE DATA HERE IS MERELY AN EXPRESSED OPINION. TRADE AT YOUR OWN RISK.
Thursday, September 29, 2011
Thursday's Action - Stocks Working Lower; Euro May be Topping
The S&P is moving more as less as planned so there's not much to add from my last set of comments. The S&P carried higher to the maximum comfortable retracement level at 78.6% fibonacci at 1197 before reversing sharply. Yesterday's decline was much stronger internally than the preceding rally the day prior suggesting the larger trend is down. Today's big rally should fade away by the end of trading. The Nasdaq has been traversing in and out of negative territory all day despite the Dow being up triple digits all day. This is a telling sign that favors the bears. Rallies are weaker internally and fractured whereas declines are internally strong to the downside and moving uniformly. That's bearish. And the wave count above suggest big moves lower if it's correct.
Even though the structure right now may not be ideal for the resumption of the downtrend being underway, this type of imperfect movement is typical for 4th and 5th waves, i.e. 4th waves are often very choppy and unpredictable, and the following 5th wave can be even more unpredictable and imperfect. We have been seeing that play out the past few weeks. Yesterday's high should not be broken so I'm shorting into rallies against yesterday's high.
Read Excerpts From Robert Prechter's Newest Theorists in This Free Report
I thought the euro would charge toward 1.4000 again before topping but it's possible a top is already in, at least in the short term. There's a near head and shoulders pattern in place now, but besides it not being textbook it still tells the same story, a rally that is in trouble. I favor the short side here against 1.3700.
Learn Elliott Wave Principle
PLEASE NOTE: THIS IS JUST AN ANALYSIS BLOG AND IN NO WAY GUARANTEES OR IMPLIES ANY PROFIT OR GAIN. THE DATA HERE IS MERELY AN EXPRESSED OPINION. TRADE AT YOUR OWN RISK.
Even though the structure right now may not be ideal for the resumption of the downtrend being underway, this type of imperfect movement is typical for 4th and 5th waves, i.e. 4th waves are often very choppy and unpredictable, and the following 5th wave can be even more unpredictable and imperfect. We have been seeing that play out the past few weeks. Yesterday's high should not be broken so I'm shorting into rallies against yesterday's high.
Read Excerpts From Robert Prechter's Newest Theorists in This Free Report
I thought the euro would charge toward 1.4000 again before topping but it's possible a top is already in, at least in the short term. There's a near head and shoulders pattern in place now, but besides it not being textbook it still tells the same story, a rally that is in trouble. I favor the short side here against 1.3700.
Learn Elliott Wave Principle
PLEASE NOTE: THIS IS JUST AN ANALYSIS BLOG AND IN NO WAY GUARANTEES OR IMPLIES ANY PROFIT OR GAIN. THE DATA HERE IS MERELY AN EXPRESSED OPINION. TRADE AT YOUR OWN RISK.
Tuesday, September 27, 2011
Stocks on Fire, Will They Cool? Euro Correcting 5 Down
Today's internals give me a mixed conclusion on what they represent to the short term action. However price action suggests a possible reversal is at hand with today's late weakness. If the bearish count I posted this morning is correct, then today's high should remain intact. Regardless of the wave count at this point, with today's high being the risk level to stop out at, I'd be shorting into any rally I get tomorrow morning with a stop just above today's high.
THIS MORNING'S POST IS BELOW:
Read Excerpts From Robert Prechter's Newest Theorists in This Free Report.
The euro appears to have completed 5 waves down and is now correcting higher. I'm looking for the euro to possibly push to just above its prior 4th wave high to the 1.4000 area again before it tops and reverses lower.
Learn Elliott Wave Principle
PLEASE NOTE: THIS IS JUST AN ANALYSIS BLOG AND IN NO WAY GUARANTEES OR IMPLIES ANY PROFIT OR GAIN. THE DATA HERE IS MERELY AN EXPRESSED OPINION. TRADE AT YOUR OWN RISK.
Friday, September 23, 2011
Stock Rally Reversal Targets
Stocks had trouble getting off the mat to follow through with yesterday's big end of day rally. Markets flip flopped in and out of positive territory all day but closed in the green. This was the result of a somewhat fractured market though since it was primarily technology and banks that pulled the market higher today from what I saw. Volume was quite strong for a Friday rally at 1.2 billion shares, but still much lighter than what we've seen on declines the past several weeks. More importantly, like I said earlier, the market rally was fractured internally with only 67% of total volume to the upside. Far from impressive after a big hopeful surge in late day trading yesterday for the bulls. An accross the board buying spree with solid volume would give the bears some pause, or should I say "paws" (get it? a play on words there: pause = paws. Yeah I know, it was stupid). Anyway, so far, this rally is starting off looking corrective. So if we get higher levels I'll use it as an opportunity to add short.
Read Excerpts From Robert Prechter's Newest Theorists in This Free Report.
As for the euro, it too appears to be correcting in a choppy overlapping move higher right now. The larger trend still appears to be down so I'd be shorting into rallies.
Learn Elliott Wave Principle
PLEASE NOTE: THIS IS JUST AN ANALYSIS BLOG AND IN NO WAY GUARANTEES OR IMPLIES ANY PROFIT OR GAIN. THE DATA HERE IS MERELY AN EXPRESSED OPINION. TRADE AT YOUR OWN RISK.
Thursday, September 22, 2011
Triangle Now Looking Unlikey, Look Lower for Stocks; Euro Downtrend Back on
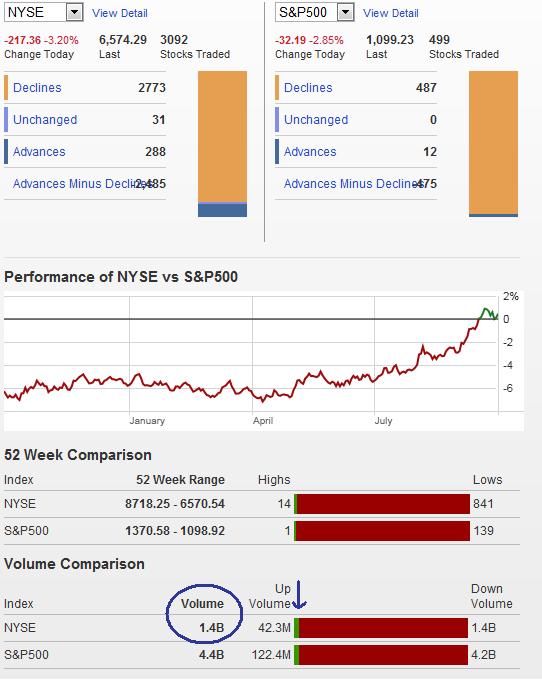
Internals today were very bearish indeed. And I'm sure that's little surprise considering the market's price action today. 1.7 billion NYSE shares traded today which is substantially higher than what we've seen accompany the rally the past few weeks, and 95% of total volume was to the downside. Clearly an overall across the board bearish today. But looking at the bigger picture for proper wave degrees is key here. Although today's internals were solidly bearish, they are not nearly as bearish as what we saw in Minor wave 3 down. This further strengthens the current wave count we're tracking which suggests the current decline is a Minor wave 5 since EWP states that 5th waves are often accompanied by reduced momentum compared to the previous 3rd wave at the same degree.
The S&P declined in 5 waves into today's low suggesting a relief rally is possible tomorrow. Although I would definitely not get long here, I'd just prepare for a quick wave (ii) rally possibly. The S&P also paused near the end of Minor wave 3 as well as round number support at the 1100 area. I have little doubt this level will be broken soon so any rally we get Friday or Monday would be a good opportunity to add short in my opinion, as long as the wave ((ii)) high is not broken.
Learn Elliott Wave Principle
MY POST FROM THIS MORNING:
The S&P broke beneath the wave ((b)) low proposed in the triangle, negating the triangle the way I was recently counting it, and most likely negating the triangle count overall no matter how you want to count it. The Dow and S&P have broken the series of higher lowers this morning suggesting their downtrends are back underway. The Minor wave 3 low has not been broken so stocks should fall further. There's always the possibility that the markets are just undergoing a complex triple zig zag which means more rallying on the way, although I very much doubt it. Either way, with the Dow dropping almost 700 points in less than two days be prepared for a possible relief rally soon, I'm favoring the short side until we get a new low beneath Minor 3 regardless.
Learn Elliott Wave Principle
The financials have already broken down to a new low, perhaps leading the overall market like they often do.
1.4000 has been an important support level for the euro in the past so I thought it would do a better job testing its underside before resuming its downtrend. It didn't even touch 1.4000 before it topped, reversed and made a new low. Perhaps a sign of how strong the current downtrend is. The larger trend in the euro still appears to be down, I see no reason to abandon the short side.
(Video) Bob Prechter Explains 'Triple Top' Forming in U.S. Stock Market
This excerpt from the special video issue of the August Elliott Wave Theorist brings you Bob Prechter’s analysis of the triple top that has been forming in the U.S. stock market over the past 12 years. Watch as Bob himself explains what this pattern means for you and the markets.You can get even more analysis – including an 84-year study of stock values – that will help you gain perspective about the recent market moves with Elliott Wave International’s FREE report, “Reality Check: Studying the Past to Bring Clarity to the Future.”
You’ll get a glimpse into the in-depth analysis Robert Prechter presents each month in his Elliott Wave Theorist with 3 excerpts from his most recent issues.
Don’t let extreme market volatility leave you confused and scared. Prepare yourself for today’s critical market juncture with your FREE report from Robert Prechter.
Read Bob Prechter's FREE report "Reality Check: Studying the Past to Bring Clarity to the Future."
PLEASE NOTE: THIS IS JUST AN ANALYSIS BLOG AND IN NO WAY GUARANTEES OR IMPLIES ANY PROFIT OR GAIN. THE DATA HERE IS MERELY AN EXPRESSED OPINION. TRADE AT YOUR OWN RISK.
Tuesday, September 20, 2011
Triangle Count on Brink; Euro Still Correcting
The triangle scenario is still intact although my confidence in it has weakened. The market held up Friday and although it declined hard yesterday, it did so on light volume (about 900 million NYSE shares). The Fed meets today (whoopie!) and talk tomorrow. The market should be a bit whacky this week as a result. There are numerous corrective options for this rally since the Minor wave 3 low and going over all over them would be tedious and pointless right now and just be a distraction. The triangle above is only one of the options and I still hold it as top choice. The bottom line is that 1258.07, the Minor wave 1 low, should remain intact no matter what correction is actually underway.
The euro continues to correct. Sunday's down gap appears to have been filled today, opening the trap door for further declines in the euro. The larger trend remains down but the short term corrective trend is still up for now.
You can get even more analysis – including an 84-year study of stock values – that will help you gain perspective about the recent market moves with Elliott Wave International’s FREE report, “Reality Check: Studying the Past to Bring Clarity to the Future.”
You’ll get a glimpse into the in-depth analysis Robert Prechter presents each month in his Elliott Wave Theorist with 3 excerpts from his most recent issues.
Don’t let extreme market volatility leave you confused and scared. Prepare yourself for today’s critical market juncture with your FREE report from Robert Prechter.
Read Bob Prechter's FREE report "Reality Check: Studying the Past to Bring Clarity to the Future."
PLEASE NOTE: THIS IS JUST AN ANALYSIS BLOG AND IN NO WAY GUARANTEES OR IMPLIES ANY PROFIT OR GAIN. THE DATA HERE IS MERELY AN EXPRESSED OPINION. TRADE AT YOUR OWN RISK.
The euro continues to correct. Sunday's down gap appears to have been filled today, opening the trap door for further declines in the euro. The larger trend remains down but the short term corrective trend is still up for now.
(Video) Bob Prechter Explains 'Triple Top' Forming in U.S. Stock Market
This excerpt from the special video issue of the August Elliott Wave Theorist brings you Bob Prechter’s analysis of the triple top that has been forming in the U.S. stock market over the past 12 years. Watch as Bob himself explains what this pattern means for you and the markets.You can get even more analysis – including an 84-year study of stock values – that will help you gain perspective about the recent market moves with Elliott Wave International’s FREE report, “Reality Check: Studying the Past to Bring Clarity to the Future.”
You’ll get a glimpse into the in-depth analysis Robert Prechter presents each month in his Elliott Wave Theorist with 3 excerpts from his most recent issues.
Don’t let extreme market volatility leave you confused and scared. Prepare yourself for today’s critical market juncture with your FREE report from Robert Prechter.
Read Bob Prechter's FREE report "Reality Check: Studying the Past to Bring Clarity to the Future."
PLEASE NOTE: THIS IS JUST AN ANALYSIS BLOG AND IN NO WAY GUARANTEES OR IMPLIES ANY PROFIT OR GAIN. THE DATA HERE IS MERELY AN EXPRESSED OPINION. TRADE AT YOUR OWN RISK.
Thursday, September 15, 2011
Stocks Should Reverse in Wave ((d)) Now; Euro Looking at 1.4000
The price action in stocks was strong today but internally it was a weak move. The recent rally has been relentless in price, yet volume and advancers vs decliners has weakened. The rally looks corrective and the next big sustained move should be down. We just have to wait.
Check out the new EWI video on MACD momentum analysis at the bottom of this post, or get a free technical indicators report now.
The limits of the triangle interpretation above are being pressed with today's big rally. Wave ((c)) cannot go above the top of wave ((a)). Doing so would negate the triangle count and create some concern for the bears from an EWP standpoint. But as I said earlier, with internal strength declining as the rally chugs on, the market's larger downtrend appears to still be intact regardless. Wave ((d)) down should start almost immediately.
The 1.4000 appears to be in the euro's sights at this time. Although the euro's rally the past few days has been choppy suggesting it's a correction, it has held its series of higher highs and higher lows. So the short term trend remains up. Until that uptrend is broken, look for the euro to get to the 1.4000 level. I expect firm resistance at that level and believe it will mark a breat area for it to reverse and continue its larger downtrend.
Momentum Analysis Using MACD
Learn more about using Momentum analysis to make Elliott wave trading decisions in this video by EWI European Interest Rate Analyst Bill Fox. Find more lessons on technical indicators in EWI's newest free report. See the information below.Learn the Best Technical Indicators for Successful Trading
In this free report, you will learn the tools of the trade directly from the analysts at Elliott Wave International. This free report uses both video lessons and reports to teach you how to incorporate technical indicators into your analysis to improve your trading decisions. Get your technical indicators report now.
PLEASE NOTE: THIS IS JUST AN ANALYSIS BLOG AND IN NO WAY GUARANTEES OR IMPLIES ANY PROFIT OR GAIN. THE DATA HERE IS MERELY AN EXPRESSED OPINION. TRADE AT YOUR OWN RISK.
Wednesday, September 14, 2011
Wave ((d)) of Triangle Underway
Not much new to add from yesterday's post. I just wanted to put up today's internals that support the 4th wave triangle scenario I mentioned in yesterday's post. 1.1 billion shares traded on the NYSE today and uppers vs downers and up/down volume was bullish but nothing jaw dropping. The late day big decline is probably just wave ((d)) of the triangle getting underway which should continue tomorrow. The range for the market should continue to tighten the rest of the week and probably into early next week before a big surge to new lows for Minor wave 5. A good bottoming range for the S&P is the 1050-1100 area.
I'll post more as things develop or change. Please check out yesterday's post below for an in depth look of how I view the market right now as well as the count I'm tracking.
Tuesday, September 13, 2011
Stocks Might be in Triangle, but does it Matter Right Now?
The up-down nature of the market lately with almost no net result positive or negative combined with weakening volume suggest a triangle might be forming. I labeled it above. A triangle would be very good for wavers because triangles only occur in X, B and 4th waves. So a triangle will significantly help us narrow down the larger wave count with higher probability and help us predict with more certainty of future movement. Triangles also precede terminal thrusts, meaning that a sharp move will occur when the triangle is finished and then reverse completely. So short term traders can make quick profits with little risk on that thrust.
Let's keep tracking this triangle count. Of course it's all about probabilities and I'm not 100% sure the triangle is occurring right now. But it's definitely a tradeable structure for those familiar with the rules for a tirangle. But still, keep in mind we might also be in a 5th wave down and they are often tricky. Many times one or just a few indices will make new lows, or only do so on a closing basis, making it tricky to know when to get out before a big reversal. So I'm keeping a close eye on the overall market looking for any sign that may have us conclude a major bottom is in. Right now it doesn't appear we're there quite yet.
Check out the new EWI video on MACD momentum analysis at the bottom of this post, or get a free technical indicators report now.
Counting waves here would be sloppy and irresponsible in my view. I need more of the structure to unfold before doing so. Labeling the chart now could only be done if I were to be very very creative. And that baiscally means I'm forcing my own bias onto the market and making my wave counts support my bias. I don't want to do that so I'm just looking at chart basics. And those basics say the euro looks broken down here with more to go on the downside. As I said many times the past few weeks, the euro's multi-week consolidation would result in a sharp move in either direction. That direction was down, obviously, and it doesn't appear over. It's probably just taking a breather before falling lower. There's no evidence a bottom is in so I favor the short side.
Momentum Analysis Using MACD
Learn more about using Momentum analysis to make Elliott wave trading decisions in this video by EWI European Interest Rate Analyst Bill Fox. Find more lessons on technical indicators in EWI's newest free report. See the information below.
Learn the Best Technical Indicators for Successful Trading
In this free report, you will learn the tools of the trade directly from the analysts at Elliott Wave International. This free report uses both video lessons and reports to teach you how to incorporate technical indicators into your analysis to improve your trading decisions. Get your technical indicators report now.
PLEASE NOTE: THIS IS JUST AN ANALYSIS BLOG AND IN NO WAY GUARANTEES OR IMPLIES ANY PROFIT OR GAIN. THE DATA HERE IS MERELY AN EXPRESSED OPINION. TRADE AT YOUR OWN RISK.
Thursday, September 8, 2011
Stocks Reverse, but on Light Volume; Euro Accelerates Towards 1.3800
Today's market reversal was nice, and also very predictable in real time. The market surged to get solidly positive after starting the morning sharply lower. So it seemed the bulls were back in control. However I looked at the euro and it was still trading heavy by blazing new lows still. And looking at the bank ETF (XLF), it was almost 0.5% negative while the major indices were surging well into the positive. That divergence was enough to get me to add to my small short S&P position. Immediately after that, the market tanked and didn't look back the rest of the day. Good news for a bear like me. But looking at the end of day data, I'm no longer impressed. Volume stood at only 945 million shares which tells me today's decline might just be some mild profit taking before Obama's speech, and I believe the Fed spoke today too. So I'm unsure if a top is in right now based on the volume I saw today, and the wave count isn't helping much either because it leaves the possibility for one more high before topping. So the door is still open for a short new high tomorrow or Monday.
Those Steely-Eyes of J.P. Morgan: Could They Help Us Today?
The rally from the Minuette wave (i) low looks impulsive. This means that it's probably just the first leg of a longer and larger correction. So today's decline is probably a "b" wave, and wave c will complete Minuette wave (ii). I'm not certian at all this will occur though since the correction is already quite deep. A top may already be in. Either way, the Minor wave 4 high should not be exceeded and the risk/reward favors the bears here shorting into rallies, in my opinion.
Learn Elliott Wave Principle
Ah, Mr. Euro finally does what he's told and falls hard from his consolidation earlier. The move to 1.3800 I've been calling for is near and should be accomplished quite shortly. Whether that level acts as a floor for the euro to bottom at, or just a speed bump it blasts through, I'm unsure of. But the path of least resistance now is still down in my view.
PLEASE NOTE: THIS IS JUST AN ANALYSIS BLOG AND IN NO WAY GUARANTEES OR IMPLIES ANY PROFIT OR GAIN. THE DATA HERE IS MERELY AN EXPRESSED OPINION. TRADE AT YOUR OWN RISK.
Wednesday, September 7, 2011
Stock Rally is Corrective; Euro to Head Lower
Stocks surged big today and held strong all day, closing on the highs. But unfortunately for the perma-bulls, volume again was very light with only 953 million shares traded on the NYSE. This is very light, and tells me that most likely this rally is corrective. When volume returns, the market should fall.
Those Steely-Eyes of J.P. Morgan: Could They Help Us Today?
Today's rally is part of Minuette wave (ii) which should stop short of exceeding the Minor wave 4 high. This means it offers the bears a good risk/reward opportunity here since the potential profits from breaking August's lows are far greater than putting a stop just above Minor wave 4's high.
Minuette wave (ii) may not be over though. Despite light volume, the market was strong all day and closed on the highs suggesting there is more upside to go. Whether that small upside occurs tomorrow morning and then reverses, or we get a slight drop and then some upside, is unknown. Either way, the market looks bearish overall as Minor wave 5 is underway suggesting August's low will be taken out. I would be shorting rallies.
Learn Elliott Wave Principle
After a very long and tightening consolidation the euro has finally broken out and has done so to the downside. I'm looking for this pair to head toward the 1.3800 level in the near future.
PLEASE NOTE: THIS IS JUST AN ANALYSIS BLOG AND IN NO WAY GUARANTEES OR IMPLIES ANY PROFIT OR GAIN. THE DATA HERE IS MERELY AN EXPRESSED OPINION. TRADE AT YOUR OWN RISK.
Tuesday, September 6, 2011
Stocks and Euro Tank
Stocks fell hard today, but volume was modest and advancers vs decliners data was fairly bearish. But looking strictly at internals here, they are not exactly supportive of a resumption of the larger downtrend. That doesn't mean the larger downtrend hasn't resumed, it just means that this piece of data isn't all that supportive.
I think various longer term counts are in play here, although all the major ones I'm tracking have the market heading to a new low before bottoming out. It's because of that fact that I don't want to get too caught up in solidifying a longer term count, and measuring corresponding waves, and looking for exact points of movement. In my opinion, that's a waste of time. It works for a lot of people though, but not me. I just stick to the bottom line and simplist analysis. In that light, the market needs a new low so I'll trade for that to occur and deal with the bigger picture once we see the structure and strength of the move AFTER the new low.
Above is one valid way of counting the decline. Here, Minor waves 2 and 4 are much more proportionate to each other, yet it means the S&P topped much earlier than the Nasdaq 100, and the discrepencies in wave counts will result in serious problems to at least one of the two counts over time. But looking at the S&P on its own, this count above is very much in play.
Learn Elliott Wave Principle
Here is another possible count I'm tracking at the moment. This falls more in line with the top in the Nasdaq 100, which tends to lead the overall market, or at least signal major turns. The problem is that Minor wave 4 is much longer in time than Minor wave 2, making this count a bit undesirable, yet still valid.
This count basically follows the Nasdaq 100 exactly and suggests Intermediate wave (1) actually completed at August's low and the rally that completed last week was Intermediate wave (2). This count would put the Nasdaqs and blue chip Dow and S&P indices right on track with each other. The big problem right now though is volume and internals. If we were now in Intermediate wave (3) down I'd expect to see volume well above 2 billion shares and around 98%-99% down volume. We're not even close to that right now. So this count is also merky at best right now.
The bottom line is that we can go forever developing scenarios and counts that may seem likely what I want to focus on is the bottom line, and what's the simplist way to approach this. The bottom line is that the market should be headed lower to a new low and we have to let the market action play out a little more before we get married to a longer term count. Playing the short term while leaving the longer term open for interpretation for the moment is certainly a viable strategy right now.
The S&P traced out a nice 5 wave decline from the Minor wave 4 high. So the big corrective rally that occurred today was expected, and it might also explain why the internals were only modest at the close since the whole day's data is averaged out, and the big corrective rally diluted the bearish internals from the open. Regardles, once this correction is over, the market should continue its way lower in a hurry, regardless of what the longer term count is.
Those Steely-Eyes of J.P. Morgan: Could They Help Us Today?
The euro is continuing to breakdown, and it's doing it in an orderly fashion as it closed a gap left from Sunday's open before resuming its downtrend. I suspect 1.3800 should be reached rather quickly.
PLEASE NOTE: THIS IS JUST AN ANALYSIS BLOG AND IN NO WAY GUARANTEES OR IMPLIES ANY PROFIT OR GAIN. THE DATA HERE IS MERELY AN EXPRESSED OPINION. TRADE AT YOUR OWN RISK.
Subscribe to:
Posts (Atom)


