Monday, June 11, 2012

Stocks Drop in ((b)) Wave Only; Euro Topped


The market was poised for huge gains today as US futures were up big last night. Although by the time the US cash market opened this morning, the rally had fizzled and stocks were spiraling downard.  Most likely it was up on speculation the Spain bailout would save the world.  But that speculation was crushed, and reality set in with a big selloff most of the day today.  The flip to the downside was big.  Internals were firmly bullish at the open and then flipped to become extremely bearish by the close.  But all-in-all, the important takeaway point here is volume.  Despite the big reversal today, volume was very light with NYSE shares totaling only 739 million.  This is probably a "b" wave down.  That's all.

Listen: EWI's Chief Analyst Hochberg Explains Recent Action in Stocks, U.S. Dollar and More


The daily S&P cash chart shows an outside reversal that would suggest the larger downtrend has resumed, i.e. Minor wave 2 up is complete and wave 3 down is underway.  But with volume so light, and the correction so fast as far as time is concerned, it is tough to have confidence that a top is in.  I think this is a fakeout.  The market may fall a little more short term, possibly even toward 1275, but ultimately it will probably bottom and rally sharply for wave ((c)).  I don't like trading corrections, or putting too much weight into anticipating when they will end since there are so many variables in EWP on how a correction can unfold.  Instead I like to look for basic technical signs of a reversal instead.  Today's internals and price action got my attention, but the volume was just too light, the length of the correction just doesn't look right.  So I'm holding off calling a top and resumption of the downtrend for now.  Only a solid break of the Minor wave 1 low at 1266.74 with increasing volume would have me reconsider that.

Don't miss out on free trading tools.  Elliott Wave International is extending their offer to get their 10 page monthly newsletter, The Financial Forecast, for free. They will offer it free until June 14th. Check it out here.
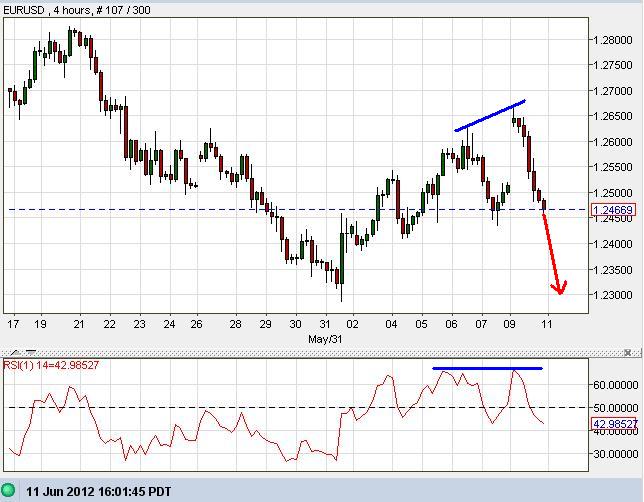

In last post I suggested a top was forming partly because the 4 hour RSI was diverging from price, and since a candlestick topping formation was unfolding.  Unfortunately the EUR/USD popped higher big time Sunday night on a gap which stopped out my short position.  Still having confidence in the bearish outlook though, I re-establish 50% of that short position in anticipation of the gap closing this week.  I just didn't realize the gap would close this quickly.  If it rallied higher I would have slowly added to the position.  But I didn't get the chance.  The EUR/USD appears to have topped now and is headed towards 1.2300 at a minimum.

Learn Elliott Wave Principle (EWP)

PLEASE NOTE: THIS IS JUST AN ANALYSIS BLOG AND IN NO WAY GUARANTEES OR IMPLIES ANY PROFIT OR GAIN. THE DATA HERE IS MERELY AN EXPRESSED OPINION. TRADE AT YOUR OWN RISK.

Thursday, June 7, 2012

Stocks and Euro Due to Pull Back Short Term


Internals today supplement the price action well.  Price was modestly higher throughout the day, but the S&P and Nasdaq lagged the Dow's gains the whole time.  At the close, only the Dow was up.  So far, the stock rally is not firing on all cylinders, nor does it seem like the start of a large new uptrend.  It looks more like a rally to relieve a severely oversold condition.  It seem like a correction.  Volume was light today, showing a lack of enthusiam to buy stocks overall, and despite the Dow closing up, NYSE down volume exceeded up volume.  So a bit of a fractured unenthusiastic market here. 

For those of you that missed it a few days ago, Elliott Wave International is extending their offer to get their 10 page monthly newsletter, The Financial Forecast, for free.  Take advantage of free tools and resources folks.  They will offer it free until June 14th. 


The above count shows a different way to look at the decline and current bounce than what I've showed previously.  But like I said before, no matter what the count, they're mostly all bearish for the longer term.  Here we have Minor wave 1 complete, suggesting a sharp and deep rally for Minor wave 2.  The "sharp" and "deep" element is not required, although according to EWP it is likely.  The current action in the market suggests a pullback is coming.  Most likely it's a ((b)) wave.  Once complete, a sharp ((c)) wave rally should unfold higher to the 1375-1400 area before topping.

This outlook is highly speculative.  What's important right now is that a clear 5 wave decline has occurred from the high on the year.  It can subdivide further like the counts in my prior post suggest.  But the bottom line is that the larger trend is down.  So without getting too caught up in the fine details of each and every move, I want to keep the core thesis in mind which is that the stock market's larger trend is down and I want to find opportunities to align myself with that trend.

Learn Elliott Wave Principle (EWP)


The EUR/USD did in fact bottom and reverse strongly last Friday like I suggested it would.  But the intraday charts suggest the rally is in trouble.  At the top, the 4 hour chart shows that price made a new high and reversed with the RSI confirming that new high.  That's toppish and bearish.  Also notice the 5 hour chart formation suggesting a top is forming if the pattern holds.  You can see I circled a bullish candle, followed by a dragon fly candle (indecisive signal) followed by what might end up being a big bearish candle if it holds.  This type of formation shows a lack of interest in buying the current rally and that the bulls see this and are starting to sell.  This formation, along with the RSI divergence, are often seen at market tops.  Whether this is a short term top or long term top is unknown right now.  But either way, I established a small short position a couple hours ago with a stop just above 1.2625.  With the potential for a major downtrend to be resuming here and a nice tight stop level in sight, I think it's well worth the risk to short here. 


PLEASE NOTE: THIS IS JUST AN ANALYSIS BLOG AND IN NO WAY GUARANTEES OR IMPLIES ANY PROFIT OR GAIN. THE DATA HERE IS MERELY AN EXPRESSED OPINION. TRADE AT YOUR OWN RISK.

Friday, June 1, 2012

Stocks Tank, in Line with Forecast; Euro Daily Candle Warning to Bears


The weakness in stocks continued to a new low as forecast in last post.  There are several different ways to count the decline, most of them are impulsive suggesting the larger trend is firmly down for the foreseeable future.  The only question is at what degree should the waves be labeled?  Above are my top choices.  Both have one thing in common, if the counts are correct prices will stay below the wave (ii) high at 1415.32 (S&P cash index).  So I'd have stops just above that level for now and let the market play itself out.  As the pattern develops more, hopefully I can drop my stop lower to reduce risk. 

Learn Elliott Wave Principle (EWP)


The action on the daily EUR/USD chart is very telling, and is worrisome for the bears.  It shows an RSI that is trying to recover from being deeply oversold accompanied by a daily outside reversal candlestick forming on the daily chart.  If that candle holds up through the close today, the EUR/USD looks to have put in a bottom today.  When you add the fact that the euro has historically made a lot of major reversals on news days like this, it is telling the bears to take be careful.  I've removed half of my short position already and am considering removing more before the close today.  Euro bears beware here.


How a Simple Line Can Improve Your Trading Success
Just to add on to my previous thought, the 4 hour chart above shows a long and drawn out bullish divergence occurring between the euro's price, and the RSI.  Priced continued to make lower lows while the RSI was making higher lows.  This build up has carried over to the daily chart where the RSI is bouncing hard out of oversold territory, and is doing it on a big news event today and an outside bullish reversal candlestick forming.  Euro bears beware.


PLEASE NOTE: THIS IS JUST AN ANALYSIS BLOG AND IN NO WAY GUARANTEES OR IMPLIES ANY PROFIT OR GAIN. THE DATA HERE IS MERELY AN EXPRESSED OPINION. TRADE AT YOUR OWN RISK.

Wednesday, May 30, 2012

Stocks Falling in 3rd Wave; Euro Heads Towards 1.1875


The projected wave iv I had in last post has gotten too big compared to wave ii at the same degree.  Although it breaks no EWP rules, it is not ideal and does not have EWP's "right look".  So I relabeled the waves to what you see above.  This count is aggressively bearish, and I usually like to go with the more conservative and cautious count, but price action demands this count be respected.  And the euro is showing no signs of slowing down on its way to 1.1876, which is also a good setup for stocks to selloff hard with it.  Look out below!

On a side note, don't miss out, only one more day to get Elliott Wave International's free Financial Forecast newsletter.  Offer expires Thursday, May 31st.  Take advantage of free tools everyone:  Download EWI's new 10-page May 2012 Elliott Wave Financial Forecast here .


The euro has solidly broken through 1.2600 support.  As I said in last post, there is nothing really holding up the EUR/USD until 1.1876.  Since last post, the EUR/USD has dropped almost 200 more pips.  Although price action looks extremely bearish, and a waterfall of a decline may occur, be prepared for pops along the way - at least psychologically.  I don't see any reason to abandon the aggressively bearish view at this point.  Longer term, the EUR/USD should make it to the 1.1876, and it's quite possible it will make it there in quite a hurry as the price action suggests. 

14 Elliott Wave Trading Insights You Can Use Now


Also, remember this chart above from my May 12th's post (click here for full post)?  It shows the weekly EUR/USD and the big declines that occurred after big chart gaps.  In the past, there was a 2700 and 1100 pip loss following their gaps.  The most recent gap occurred around 1.3000, and the pair is currently trading at 1.2400, which registers a 600 pip loss so far.  So history is repeating itself.  There still may be plenty more to go, but again, be prepared for sharp rallies and major reversal patterns. *** Momentum on the intraday charts is showing that a bullish divergence is building, and the daily RSI is oversold.  I'm still aggressive in taking big short positions, but am also closely watching for any big reversal patterns that demand I protect my gains. ***


PLEASE NOTE: THIS IS JUST AN ANALYSIS BLOG AND IN NO WAY GUARANTEES OR IMPLIES ANY PROFIT OR GAIN. THE DATA HERE IS MERELY AN EXPRESSED OPINION. TRADE AT YOUR OWN RISK.

Wednesday, May 23, 2012

Stocks Falling in 5th Wave; EUR/USD Headed to 1.1876


The S&P has followed my previous forecast almost exactly.  It popped a little higher for wave iv, and is now collapsing in wave v.  I expect a move toward the 1275 area before a meaningful rally occurs.  But that's not to say it won't continue lower.  The larger trend is down, so surprises will be to the downside.  I will not get long at 1275, but it will just be an area to watch to protect my short position.

On a side note, Elliott Wave International is offering a free Financial Forecast newsletter up until Thursday, May 31st.  Take advantage of free tools everyone:  Download EWI's new 10-page May 2012 Elliott Wave Financial Forecast here .


The EUR/USD has also followed my forecast for a move to the 1.2600 level.  The breakaway action and fierce selling shown on the above weekly chart is very bearish for the euro.  This decline could really pick up steam and shoot toward 1.1876 support very fast.  And that's a long ways away with a lot of pips for the bears to gobble up.  I remain short.

14 Elliott Wave Trading Insights You Can Use Now


Keeping an eye on the shorter term daily chart, you can see a clear descending trendline has been respected by the euro a handful of times.  I expect that trendline to remain intact during the euro's decline.  With 1.2600 breaking down, there is not much holding up the EUR/USD before it gets to 1.1876.  Watch the trendline, and watch the swing highs.  As long as the daily swing highs and the above descending trendline remain intact, I'm firmly bearish the euro.

How a Simple Line Can Improve Your Trading Success

PLEASE NOTE: THIS IS JUST AN ANALYSIS BLOG AND IN NO WAY GUARANTEES OR IMPLIES ANY PROFIT OR GAIN. THE DATA HERE IS MERELY AN EXPRESSED OPINION. TRADE AT YOUR OWN RISK.

Tuesday, May 22, 2012

Quick Euro Update


The hourly EUR/USD chart shows a bearish divergence between price and the RSI at the recent high.  The big selloff immediately afterward confirms the divergence which signals a top is in place.  The outlook for the euro moving forward is very bearish.

How a Simple Line Can Improve Your Trading Success


Today's big bearish candlestick in the euro signals the larger downtrend has resumed as long as today's losses are not completely reversed tomorrow.  I was cautious on the rally before since it was so oversold prior to that, and the reversal higher looked like it might have legs and run higher for a while.  Now it looks like the euro is headed lower in the short term, although it's probably a wave 5 at some degree so I would still be mildly cautious and not be too aggressively short at the moment.  The daily charts are showing a bullish divergence building, but it might not materialize in a sustained rally for quite a long time.  Regardless, the short term is bearish so I added short near 1.2700, but not nearly a full position.  I still have plenty of cash to add short if it rallies from here.  Any rally should be capped shy of 1.2824.


PLEASE NOTE: THIS IS JUST AN ANALYSIS BLOG AND IN NO WAY GUARANTEES OR IMPLIES ANY PROFIT OR GAIN. THE DATA HERE IS MERELY AN EXPRESSED OPINION. TRADE AT YOUR OWN RISK.

Monday, May 21, 2012

Stock and Euro Declines Take a Break


Stocks continued lower as expected, but have bounced a little lately in what is probably a small wave iv.  Once complete, further selling to a new low will be achieved, probably toward the 1275 area at a minimum.  The current rally seems to be just alleviating some of the severe oversold condition the market is in.  I see nothing about this move that signals a significant bottom is in and that a new rally phase is underway.

Learn Elliott Wave Principle (EWP)


Looking at the 5 hour chart you can see two bullish candlestick formations suggesting the bears have run out of gas and that there is solid buying pressure keeping the euro afloat right now.  Right now there are only 3 waves higher, which is a correction.  This could mean that this rally will be short lived.  But I doubt it.  The euro has a bullish divergence with momentum indicators on the intraday charts, and overall was just deeply oversold.  So I would expect the euro to subdivide higher in a 5 wave move, which means the rally will be much higher where we need to look toward previous open gaps for resistance levels.  So euro bears beware here.

The Manic-Depressive Stock Market: What to Make of It


On the daily EUR/USD chart you can see the massive topping pattern around the 1.3300-1.3400 that has taken place over the past several months.  This top and reversal doesn't look like a small hiccup, it looks the start of a major down-move well below 1.2600.  So the short term may look bullish, but the long term looks bearish for the euro.  There is a big open gap just below 1.3100, so if the current rally has some strength to it, we may see prices rise toward that level.  There's no guarantee though, and I am not looking to get long.  I merely lightened up my short position and will be looking for signs of weakness to put those short positions back on.  The rally should be capped below 1.3284.


PLEASE NOTE: THIS IS JUST AN ANALYSIS BLOG AND IN NO WAY GUARANTEES OR IMPLIES ANY PROFIT OR GAIN. THE DATA HERE IS MERELY AN EXPRESSED OPINION. TRADE AT YOUR OWN RISK.

Wednesday, May 16, 2012

S&P and Euro Updated


I don't have confidence in the short term count in labeling waves i and ii.  It suggests a flat correction for a second wave which is very rare.  Also, wave C (not shown) finishing wave ii was a diagonal that was truncated.  This is also unlikely.  But I see no better way to label it at the moment.  I'm concerned I might be trying to shove a round peg in a square hole here.  But regardless of the little EWP nuances for wave i and ii, the overall price action suggests that larger trend remains down for the short term.  So I would be selling into strength with a stop just above 1415.32. 

Learn Elliott Wave Principle (EWP)


The euro is respecting this Jedi Knight and is doing exact what I say.  The forecast continues to call for further selling toward 1.2600, and probably much much further after that.  I'm staying short!

The Manic-Depressive Stock Market: What to Make of It


PLEASE NOTE: THIS IS JUST AN ANALYSIS BLOG AND IN NO WAY GUARANTEES OR IMPLIES ANY PROFIT OR GAIN. THE DATA HERE IS MERELY AN EXPRESSED OPINION. TRADE AT YOUR OWN RISK.

Saturday, May 12, 2012

Stocks and Euro Obeying My Commands


Stocks have followed the short term EWP forecast for a selloff after marking a wave (ii) top at 1415.32.  Keeping it simple, and focusing on the short term, I want a stop on my short position just above 1415.32.  If the wave count is correct, stocks will be undergoing a sharp and deep selloff soon.  Wave ii has either already ended, or will make a sharp rally to the 1380 area before quickly reversing and selling off hard.  Either way, 1415.32 should remain intact and rallies should be seen as opportunities to short.  Whether Primary ((2)) has topped is irrelavent to me.  The short term is bearish, so I'm bearish.  I'll deal with Primary degree waves later if market/economic action dictates I do so.

Learn Elliott Wave Principle (EWP)


Boy, I'll tell ya, sometimes in trading I feel totally lost and other times I feel like a Jedi Knight.  Lately with the euro, I've been a Jedi Knight.  The euro has been following my forecast quite well and has been obeying my commands like a good little currency should.  The gap from Sunday night was almost completely filled, falling just 4 pips shy of my cited 1.3070 level, but still recovered sharply overnight nonetheless.  The support shelf of 1.3000 has been taken out solidly like I projected last week (Jedi), so this opens the door for 1.2600 to be assaulted next.  The daily candlestick structure March of this year is extremely toppish and has big time bearish implications for the foreseeable future.  The break down of 1.3000 is a very welcome event for the bears.  Now short term the euro is oversold so don't count out a sharp short term bounce.  But 1.3283 in the EUR/USD spot should remain intact.  I'm aggressively short against that level.  Now I will use my Jedi Knight skills on the EUR/USD......"you will decline toward 1.2600 swiftly.......(waving hand in front of EUR/USD chart).......you will decline toward 1.2600 swiftly.....(waving hand in front of EUR/USD chart)."  Consider it done!  :-)

The Manic-Depressive Stock Market: What to Make of It
The psychology of the market may be teetering on the edge...
-Elliott Wave International


Let's take our analysis a bit further in the EUR/USD.  Here's a weekly chart which I rarely show since I'm more of a short term swing trading kind of guy.  But I just wanted to show you a subtle sign of major selling ahead.  There are 3 downside gaps on this chart, and both resulted in massive selloffs immediately after them.  One resulted in a 2700 pip selloff, and the other resulted in an 1100 pip selloff.  This week's gap down is similar to these two from the past.  If history repeats itself, it means major selling is ahead of the euro.  And with the short term picture poised for major selling and an assault of 1.2600, the weekly chart here also gives us a good indicator that 1.2600 is probably the euro's next stop.  It probably won't be a straight line, so manage risk accordingly and be prepared for wild swings.  Ultimately, as long as 1.3283 remains intact, then 1.2600 should be hit soon.


PLEASE NOTE: THIS IS JUST AN ANALYSIS BLOG AND IN NO WAY GUARANTEES OR IMPLIES ANY PROFIT OR GAIN. THE DATA HERE IS MERELY AN EXPRESSED OPINION. TRADE AT YOUR OWN RISK.

Sunday, May 6, 2012

Euro Trade Update: Taking Profits on Big Gap Down


Friday I said that the EUR/USD would attack the 1.3000 and take it out soon, and it wasted little time launching its assault.  The EUR/USD gapped down big at the open today and broke solidly through 1.3000, and then had follow-through to the downside after that.  It is now trading near the low.  Gaps are usually filled so this is a great trading opportunity since I held short over the weekend and can take some profits and get back in short at a better price.  Also note on the hourly chart above that the momentum indicators like stochastics and the RSI are deeply oversold.  In preparation for the EUR/USD filling its gap, and relieving its oversold condition, I covered 25% of my short position.  I will re-enter that same short position if it rises to 1.3070, about 100 pips away from where it's currently trading.  If the euro is so bearish that it just continues lower without filling the gap, then oh well, I still have 75% of my position intact to profit from that decline and I reduced risk with a high probability trade.  That's the game, playing the probabilities and reducing risk. 

To sum up: the EUR/USD gap will probably be filled soon, meaning a rally to 1.3070 is likely within a few days, if not a few hours.  So I took off 25% of my short position and will reshort that same amount when the gap fills around 1.3070.

Refer to my my previous post below for a little more context on this trade, as well as some stock market commments.  It's also worth noting that the euro is not tanking on its own, stock futures are down 17 points (S&P), so risk aversion is hitting the markets again.  Tomorrow morning will be interesting.

Learn Elliott Wave Principle (EWP)

PLEASE NOTE: THIS IS JUST AN ANALYSIS BLOG AND IN NO WAY GUARANTEES OR IMPLIES ANY PROFIT OR GAIN. THE DATA HERE IS MERELY AN EXPRESSED OPINION. TRADE AT YOUR OWN RISK.

Friday, May 4, 2012

Euro/S&P Short Trade Still on


Below I list my projections and stop levels.  As long as the stop levels remain intact and nothing significant develops, this post will stand as guidance for the foreseeable future.

Just a quick note on the setup and count I put in last post.  I gave two options for wave (ii) and it's clear now that the latter count that had wave (ii) extending was correct.  The main point here is that my key level of 1422.38 in the S&P cash remained intact, keeping the short bias alive.  The downside turn from the wave (ii) high is just the beginning of a larger decline that should get to at least the 1300 level.   If I were to want to reduce risk I think that lowering my stop down to 1415.32 would be a wise choice for now.  But once 5 waves down complete for wave ((i)), I'll have to re-evaluate that stop and possibly take some profits.  But for now, my stop is 1415.32 for the risk averse.

Learn Elliott Wave Principle (EWP)


The euro has held my key level of 1.3384, and as you can see from the above daily candlestick chart, rallies have come hard faught while declines have been sharp and easy.  This suggests the larger trend is down.  The euro fell hard this week.  You see a set of reversal candles from a few days ago at the high which has been followed by some big red downside candles at the end of the week.  And today's close occurred on the low for the day.  That's all very bearish.  You can see that 1.3000 has been a solid line of support since February of this year, but the more it's tested the more the support is eroded.  I expect 1.3000 to be targeted and taken out next week.  I'm bearish with a stop just above 1.3384.

The Manic-Depressive Stock Market: What to Make of It

PLEASE NOTE: THIS IS JUST AN ANALYSIS BLOG AND IN NO WAY GUARANTEES OR IMPLIES ANY PROFIT OR GAIN. THE DATA HERE IS MERELY AN EXPRESSED OPINION. TRADE AT YOUR OWN RISK.

Wednesday, April 25, 2012

Stocks Look to Fall; Euro Firmly Bearish


Below I list my projections and stop levels.  As long as the stop levels remain intact and nothing significant develops, this post will stand as guidance for the foreseeable future.

The bottom line is that the S&P looks poised to fall soon.  It has either topped already with wave (ii), as seen above, or will do so with one more poke higher before turning down hard.  As long as 1422.38 in the S&P cash index remains intact, the index is very vulnerable to a big decline at any moment.  Remember, the Fed will make an announcement later today which could result in some volatility at the end of the trading day and into tomorrow. 

Learn Elliott Wave Principle (EWP)


The daily euro chart is very bearish as you can see above.  There have been several attempts to break down the 1.3000 level that have failed.  But with every attempt, more and more of the support is eroded until eventually there's almost nothing left.  The decline from 1.3384 is strong and the recovery from the 1.3000 area is choppy and weak.  I expect the euro to stay below 1.3384 and continue lower through 1.3000 quite soon.

Stock Market Turning Points: Has Wall Street Ever Warned You in Time?


The short term does not look good for the euro either.  The euro has really been laboring to make new highs since recovering from 1.3000, and the most recent high on the hourly chart was not confirmed by the RSI, suggesting the rally is weakening severely.  The Fed announcement can throw everything off quite a bit, so if you have a trade in, manage risk properly, buckle your seat belt and prepare for a possibe wild ride later today.  Overall though, as long as 1.3384 remains intact, I see the euro as very bearish.


PLEASE NOTE: THIS IS JUST AN ANALYSIS BLOG AND IN NO WAY GUARANTEES OR IMPLIES ANY PROFIT OR GAIN. THE DATA HERE IS MERELY AN EXPRESSED OPINION. TRADE AT YOUR OWN RISK.

Monday, April 16, 2012

Keep it Simple


Internals show a market that is moving around on light volume with only 734 million NYSE shares traded today. More importantly though was the fractured nature of the overall market.  Apple, and other big tech stocks, helped pull the market higher the past month or so.  But Technology failed miserably today, and has been having trouble the past week overall.  This is part of the reason why despite a solid performance from the Dow on the upside, the NYSE's up volume only slightly outpaced down volume, 387 million to 335 million.  Internally, the market looks bearish.

Learn Elliott Wave Principle (EWP)


I'm keeping it simple.  I'm not worried about Primary wave ((2)) or ((3)), and I'm not trying to make a fortune by gambling on a Primary wave ((3)) right now.  All I'm doing is focusing on the short term obvious points we have in front of us which are: 1) the market was severely overbought going into the recent weakness; and 2) you can count an impulsive decline from the high suggesting that the larger trend is down.  I would simply be shorting against 1422 with a minimum target of 1340, but probably much further.

Diagonal: Straight Shot to a Trading Opportunity


The euro seems to have made up its mind on which of my counts it's tracking.  Usually a correction goes just above the prior 4th wave high, which is 1.3225 here in the euro, before topping.  1.3400 should not be exceeded, so I'm shorting with a stop just above 1.3400.  Keep it simple, the larger trend appears to be down as long as 1.3400 is not exceeded so shorting seems wise here. 


PLEASE NOTE: THIS IS JUST AN ANALYSIS BLOG AND IN NO WAY GUARANTEES OR IMPLIES ANY PROFIT OR GAIN. THE DATA HERE IS MERELY AN EXPRESSED OPINION. TRADE AT YOUR OWN RISK.

Friday, April 13, 2012

Stocks Shaken and Movin Finally; Euro to Head Lower


As I said in last week's post, stocks appear to have topped.  I'm unsure of how major of top this is, but for the short and medium term bears, it provides opportunities.  Stocks are correcting a severely overbought situation they've been in for many weeks.  The short term is bearish.  1422 should mark the high for the foreseeable future.  I'm shorting modestly against that level.

Learn Elliott Wave Principle (EWP)


With stocks slapping me around the past several months, I've focused more on the euro since it has been more predictable, and has consistently been profitable for me.  I propose two wave counts today, both are short term bearish.  Above is my original count I was tracking for the past week or so which is still very much possible.  But today's sharp decline makes me think that it's not just a wave ((v)), but possibly a 3rd wave instead.


Here's what I mean.  By changing the degrees of trend to the Minor level, it's quite possible today's decline is the kickoff to Minor wave 3.  Now there's a lot of trading left in the day, so let's see how the euro closes before we make a decision on which count to put as top choice.  The way I see it, if the euro closes near its lows for the day, this count directly above is my top choice.  But if the euro makes a solid comeback and closes significantly higher than the lows on the day, then I'm still putting the count with wave ((v)) underway as my top choice.  Minor wave 3 should be strong and relentless, so anything short of that type of action here will put this count in 2nd place.  Either way, the short term for the euro looks bearish.

PLEASE NOTE: THIS IS JUST AN ANALYSIS BLOG AND IN NO WAY GUARANTEES OR IMPLIES ANY PROFIT OR GAIN. THE DATA HERE IS MERELY AN EXPRESSED OPINION. TRADE AT YOUR OWN RISK.

Thursday, April 5, 2012

Stocks Toppish; Euro to Decline Further


The S&P managed a new high to eliminate the head and shoulders pattern I showed in last post.  But it immediately declined afterward.  What's more important is that the Nasdaq Composite did not confirm the S&P and Dow's new highs and they all have now turned down.  The Nasdaq has been the leader of the overall market the past few months, so when you factor in that the Nasdaq is showing weakness now, the odds are good that at least a short term top is in place.  I recommend being conservative and flexible and managing risk appropriately on any short positions.  I'm not calling a P2 top or anything right now.  The focus is on the short term, and the short term suggests further weakness ahead.  I'll assess the longer term picture once the short term plays out a bit more.

I always recommend taking adavantage of free trading tools, and EWI is offering a free eBook titled, How You Can Find High-Probability Trading Opportunities Using Moving Averages, bySenior Analyst Jeffrey Kennedy.


Unlike stocks, the euro did follow my head and shoulders topping pattern I laid out in last post and has been on an assault to the downside since.  The daily chart shows that the 1.3000 level is a good support level for the moment, and it currently sits near that level at the time of writing.  Judging by the pattern I see before me, 1.3000 will be taken out farely soon.  There may be a relief pop to the upside to alleviate some of the oversold condition it has on the intraday charts.  But that pop should be short lived and the downside movement should resume to well below 1.3000.  I'm firmly bearish the euro, and bullish the US dollar.

Learn Elliott Wave Principle (EWP)


PLEASE NOTE: THIS IS JUST AN ANALYSIS BLOG AND IN NO WAY GUARANTEES OR IMPLIES ANY PROFIT OR GAIN. THE DATA HERE IS MERELY AN EXPRESSED OPINION. TRADE AT YOUR OWN RISK.

StatCounter