This Elliott Wave blog is dedicated to sharing Fibonacci ratios and other technical analysis for forex signals, index futures signals, options signals, and stock signals. Elliott Wave Principle puts forth that people move in predictive patterns, called waves. Identify the wave counts, and you can predict the market.
Wednesday, August 29, 2012
Stocks Flat, but Staring Down a Cliff; Euro Might Push Higher Before Collapse
Stocks haven't done anything in several days. Although this may seem like an overall neutral event, I see it as bearish. The S&P made a new intraday high while most other major indices did not. Instead of resolving this divergence with a surge higher to bring the other indices to new highs as well, the market has instead gone flat. It's not good to reach a critical level, diverge, then go flat. In addition, there is no volume at these levels. I can't calculate government tinkering, but on the surface, the evidence I just listed combined with the daily MACD, and other momentum indicators, rolling over and a subtle reversal candle that has held for over a week tell me the next big move in stocks should be down.
Learn Elliott Wave Principle
In my last post I projected that the EUR/USD would return to the apex of a triangle at 1.2469 in about 24 hours. I was right that it did return to that level, but I was off on the timing by about 4 trading days. So hate me or love me, or both :-)
U.S. Economy: The Financial Tectonic Plates Are Shifting Once Again
Financial changes can happen with lightning speed
-Elliott Wave International
After the EUR/USD completed what looks like a 5 wave drop to 1.2000, it has been correcting upward for several weeks. It looks like a combination correction according to EWP, which means some short term pullback now and then another surge higher to complete wave ((y)). There is a confluence of resistance at 1.2800 since it's a 50% fibo retracement and the area of the prior 4th wave. That doesn't mean it will hit 1.2800 and reversal exactly on that point, it just means that if it surges higher it should reach the 1.2800 area before reversing.
With stocks staring down a big cliff, the EUR/USD may not make that final push higher. Afterall, the EUR/USD is sitting on another fibo retracement of 38% which a good place to reverse as any. I have no position in the EUR/USD at the moment since I'm not highly confident the euro has much left gas in the tank for another short term rally. I want to wait to see what stocks will do, and the price action in the euro in relation to that, before I take a short position again. But the bottom line is that the euro's rally is corrective, and so I'm looking for shorting opportunities.
Sentiment Measure Shows No Fear of Major U.S. Stock Decline
PLEASE NOTE: THIS IS JUST AN ANALYSIS BLOG AND IN NO WAY GUARANTEES OR IMPLIES ANY PROFIT OR GAIN. THE DATA HERE IS MERELY AN EXPRESSED OPINION. TRADE AT YOUR OWN RISK.
Wednesday, August 22, 2012
Quick Euro Trade
The consolidation and thrust on a news event (the Fed), suggest the previous EUR/USD structure is a triangle with the current thrust as the result of that triangle. EWP suggests that once the sharp thrust is over, it will return to near the apex of the preceding triangle. That area is 1.2469. So I'm shorting into this rally, adding more as it surges higher but keeping my overall position manageable since there's no clear risk level to put a stop. I'm just watching it closely. The reversal to 1.2469 should happen soon, within a day.
It will be very interesting to see how the euro and stocks close today. A nice reversal on a Fed announcement is usually a good trading opportunity.
Learn Elliott Wave Principle
PLEASE NOTE: THIS IS JUST AN ANALYSIS BLOG AND IN NO WAY GUARANTEES OR IMPLIES ANY PROFIT OR GAIN. THE DATA HERE IS MERELY AN EXPRESSED OPINION. TRADE AT YOUR OWN RISK.
Tuesday, August 21, 2012
Stocks Make New Highs; Euro Rallying in Double Zig-Zag
The S&P and Nasdaq 100 pushed to new highs, breaking the EWP count once again. The Nasdaq Composite and the Dow have not made new highs but should do so shortly. If not, it will leave an intermarket divergence in place, and when accompanied by waning momentum, volume, and the Dow Transports failure at a new high, it would spell disaster for stocks in the short term at least. If all these markets confirm the highs in the S&P and NDX, then look for continued rallying for the foreseeable future. There are no signs of a top here, just steady buying in a light volume market where the Fed is buying futures and pushing brokers to buy up the market (enter conspiracy theory here). It's tough to fight the government, so for the most part I choose not to. I see no reason to get short here in anything other than a tiny options position where my risk is clearly capped and with the understanding that it is basically just a gamble which I rarely do. Momentum is just so weak on this rally that this market can give way at any point, so I don't want to get long. I think it's best to just wait it out until evidence presents itself to take a position, or simply put money in other markets that I can better analyze and project. Like the euro:
Sentiment Measure Shows No Fear of Major U.S. Stock Decline
The EUR/USD thrusted from a triangle last night, and judging from the structure preceding the triangle, it looks like the triangle was an ((x)) wave (according to EWP, a triangle only occurs in 4th, B and X waves). That means the thrust higher right now is a wave (a) which will be follwed by a pullback to around the ((x)) wave triangle apex for wave (b), then one more final rally for wave (c) of ((y)) where the EUR/USD should form a major top. Fibonacci retracements and the prior 4th wave converge around the 1.2700-1.2800 level (my lines on the chart above are not exact projections), so I'll be looking for a reversal in that area to establish short positions. Keep in mind that the larger trend is firmly down though, so surprises will be to the downside.
Learn Elliott Wave Principle
PLEASE NOTE: THIS IS JUST AN ANALYSIS BLOG AND IN NO WAY GUARANTEES OR IMPLIES ANY PROFIT OR GAIN. THE DATA HERE IS MERELY AN EXPRESSED OPINION. TRADE AT YOUR OWN RISK.
Sentiment Measure Shows No Fear of Major U.S. Stock Decline
The EUR/USD thrusted from a triangle last night, and judging from the structure preceding the triangle, it looks like the triangle was an ((x)) wave (according to EWP, a triangle only occurs in 4th, B and X waves). That means the thrust higher right now is a wave (a) which will be follwed by a pullback to around the ((x)) wave triangle apex for wave (b), then one more final rally for wave (c) of ((y)) where the EUR/USD should form a major top. Fibonacci retracements and the prior 4th wave converge around the 1.2700-1.2800 level (my lines on the chart above are not exact projections), so I'll be looking for a reversal in that area to establish short positions. Keep in mind that the larger trend is firmly down though, so surprises will be to the downside.
Learn Elliott Wave Principle
PLEASE NOTE: THIS IS JUST AN ANALYSIS BLOG AND IN NO WAY GUARANTEES OR IMPLIES ANY PROFIT OR GAIN. THE DATA HERE IS MERELY AN EXPRESSED OPINION. TRADE AT YOUR OWN RISK.
Thursday, August 16, 2012
Stocks Pushing the Bears to Limit; Euro Setup in Place
Stocks are pushing the proposed Minor wave 2 to the limit. I am not a blind and dumb EWP follower that just falls in with the mass herd of wavers, I know this count has now become unlikely. But on the flipside, many momentum indicators are waning, and the rally from the Minor 1 low is choppy and overlapping, which all suggests it's a correction. So is it wise to get long here? I don't think so. If anything. the risk/reward favors the bears here. Shorting now can leave us with a stop just above 1422.38, risking about 18 points to make hundreds if the wave count above is correct. Other than that, I see no reason to take a position in this market at the moment.
Always take advantage of free resources from high quality sources. EWI is offering a free trading eBook right now titled, "Learn to Identify High Probability Trading Opportunities Using Price Bars and Chart Patterns".
As for the EUR/USD, I'm keeping it simple as I usually do. The rally may be faultering here, but the series of higher highs and higher lows is still intact. So I want to wait for that uptrend to break down before getting short. A nice break of 1.2242 should break the uptrend and result in more heavy selling to new lows. I have a sell order in at 1.2230 which will execute a protective stop order at 1.2400.
Learn Elliott Wave Principle
PLEASE NOTE: THIS IS JUST AN ANALYSIS BLOG AND IN NO WAY GUARANTEES OR IMPLIES ANY PROFIT OR GAIN. THE DATA HERE IS MERELY AN EXPRESSED OPINION. TRADE AT YOUR OWN RISK.
Always take advantage of free resources from high quality sources. EWI is offering a free trading eBook right now titled, "Learn to Identify High Probability Trading Opportunities Using Price Bars and Chart Patterns".
As for the EUR/USD, I'm keeping it simple as I usually do. The rally may be faultering here, but the series of higher highs and higher lows is still intact. So I want to wait for that uptrend to break down before getting short. A nice break of 1.2242 should break the uptrend and result in more heavy selling to new lows. I have a sell order in at 1.2230 which will execute a protective stop order at 1.2400.
Learn Elliott Wave Principle
PLEASE NOTE: THIS IS JUST AN ANALYSIS BLOG AND IN NO WAY GUARANTEES OR IMPLIES ANY PROFIT OR GAIN. THE DATA HERE IS MERELY AN EXPRESSED OPINION. TRADE AT YOUR OWN RISK.
Sunday, August 12, 2012
Stocks Testing Wave Count; Euro Bullish Short Term
Stocks have continued higher, much further and long than I expected. My stops have been broken numerous times and my frustration with stocks continues. Without a new high above 1422, the above count remains intact. The risk/reward favors the bears.
There a few momentum divergences in place with the new highs achieved over the past few weeks, but this one is the most compelling for the bears in my opinion. The SPY (tracks S&P) has had its volume fall off a cliff while price has made several new highs. This doesn't mean a top is in, but it does mean that there will most likely be a sharp and deep decline once price finally does top.
The 3-Year Rally: It doesn't have to end this way. Or does it?
I thought the euro had completed its upward correction and was on its decent to new lows again last week. But on the 4 hour chart there is a big bullish reverals candlestick that give me pause. I would have to conclude that a bottom is in for the euro for the time being, and getting long for a short term trade seems wise as long as 1.2240 holds.
PLEASE NOTE: THIS IS JUST AN ANALYSIS BLOG AND IN NO WAY GUARANTEES OR IMPLIES ANY PROFIT OR GAIN. THE DATA HERE IS MERELY AN EXPRESSED OPINION. TRADE AT YOUR OWN RISK.
Sunday, July 29, 2012
Stocks Minor 2 Still Working; Euro Bottoms as Expected
Stocks did what they've loved to do over the past two years or so....kick me in the twins and prove my wave count wrong for all the world to see. This is why I have moved to trading the euro much more. Stocks and EWP have just not worked out well lately.
Regardless, The above count remains valid but Minor 2 needs to top this week. Look for a flip-flop sideways or choppy move higher early this week leading into a big reversal. Any sign of reversal that occurs below the Primary wave ((2)) high would have me get short.
The Drop Like a Rock Scenario for U.S. Markets
In my last post I mentioned that the euro was showing signs indicative of a bottom forming. I suggested that the bears reduce risk at those levels. That proved to be a wise move as the EUR/USD has shot up in a clearly impulsive move (5 waves). So the one larger degree of trend is now higher. I suspect it's probably just an A wave within a larger correction. So the path of least resistance right now is up. The EUR/USD's bottom at 1.2041 should remain intact for a little while. Since the current rally is probably a correction, I'm not real interested in trading it. I have no position in right now, but will look for opportunities to short once it shows signs of topping and reversing. But for now, I'm just sitting quietly and patiently at the table with my hands folded in front of me, back straight up in the chair for perfect posture, and a smile from ear-to-ear like a good little trader - waiting for my chance to pounce.
Since a zig-zag may be unfolding in the euro right now, this might be useful to you guys: Basic Elliott Video Lesson -- How the Zigzag Measures Up
PLEASE NOTE: THIS IS JUST AN ANALYSIS BLOG AND IN NO WAY GUARANTEES OR IMPLIES ANY PROFIT OR GAIN. THE DATA HERE IS MERELY AN EXPRESSED OPINION. TRADE AT YOUR OWN RISK.
Monday, July 23, 2012
Minor 2 Topped; Euro Bears be Careful
Learn Elliott Wave Principle
Last week I said I hoped to get a daily reversal pattern to feel confident in getting short on the expectation of Minor wave 2 topping. I wasn't fortunate enough to get pattern. But the follow-through weakness to the downside today suggests Minor wave 2 has already topped. It will be confirmed, in my view, on a break below the first (b) wave low. But I will try to get short every chance I get regardless. My stop is just above 1380.39 since that is the level that needs to be held for the above labeled wave count to remain intact.
Bottom line: I'm shoring rallies, and any good opportunity that arises, with a stop just above 1380.39.
(VIDEO) EUR/USD: A Great Real-Life Lesson in Elliott Wave Analysis
Please Note:
On Wednesday, July 18 at 1 p.m. (EST), EWI is offering a free webinar with one of the most sought-after FX trading strategists in the world titled, "How to Trade the Top 5 Forex Opportunities Right Now."
PLEASE NOTE: THIS IS JUST AN ANALYSIS BLOG AND IN NO WAY GUARANTEES OR IMPLIES ANY PROFIT OR GAIN. THE DATA HERE IS MERELY AN EXPRESSED OPINION. TRADE AT YOUR OWN RISK.
Last week I said I hoped to get a daily reversal pattern to feel confident in getting short on the expectation of Minor wave 2 topping. I wasn't fortunate enough to get pattern. But the follow-through weakness to the downside today suggests Minor wave 2 has already topped. It will be confirmed, in my view, on a break below the first (b) wave low. But I will try to get short every chance I get regardless. My stop is just above 1380.39 since that is the level that needs to be held for the above labeled wave count to remain intact.
Bottom line: I'm shoring rallies, and any good opportunity that arises, with a stop just above 1380.39.
(VIDEO) EUR/USD: A Great Real-Life Lesson in Elliott Wave Analysis
As many of you know, I'm not confident in the longer term wave count for the EUR/USD so I've been using basic technical analysis to identify the larger trend, and also using short term wave counts, and have just jumped on board for the ride. Although my analysis on the euro has been quite simple, it has been extremely effective for over a year now.
Although I don't know the larger wave count, I can see that it looked like the weak, choppy sideways rally from the 1.2160 area to the 1.2320 area is indicative of a 4th wave. Judging by the size and length, I'm estimating it's at Minor degree. The resultant decline into this morning's low is clearly impulsive as you can see I labeled it a 5 wave Minute degree decline.
If the above count is correct, then the bears need to beware here. We have a 5 wave decline into a 5th wave of Minor degree preceded by a gap open that has not yet been filled. So a large snap back rally could occur at any time. This is no guarantee of course, so I don't want to get long. But I have covered 75% of my short positions to reduce risk. I've made a lot of profits on this euro run and I'm not giving them back simply because I didn't exit when the risk/reward flipped against me. Sure, the euro can continue cascading lower and I'll miss more profits. But this is a risk/reward game, not a roulette gambling wheel. The risk/reward in my view is not worth staying heavily short here. I have a tiny short position still in place and will exit all of it once I see a strong sign of a reversal. It's also possible I'll get short again in the near future if the outlook changes. But right here, at this juncture, the evidence is strong that the euro's downtrend may be in jeopardy for the moment.
Please Note:
On Wednesday, July 18 at 1 p.m. (EST), EWI is offering a free webinar with one of the most sought-after FX trading strategists in the world titled, "How to Trade the Top 5 Forex Opportunities Right Now."
PLEASE NOTE: THIS IS JUST AN ANALYSIS BLOG AND IN NO WAY GUARANTEES OR IMPLIES ANY PROFIT OR GAIN. THE DATA HERE IS MERELY AN EXPRESSED OPINION. TRADE AT YOUR OWN RISK.
Wednesday, July 18, 2012
Stocks Wrapping up Minor 2; Euro Correction Might be Over
Nothing really new to report other than that it looks like Minor wave 2 has not completed quite yet. The internal measures of the market along with momentum and price action are not indicative of a 3rd wave at Minor degree. A new high is not far away so perhaps it's imminent that Minor wave 2 pops a little higher to complete. It would be a golden opportunity if we were able to get that new high with a daily reversal pattern. If so, I will jump in fairly heavy on the short side at that point. Although the MACD is not a good timing indicator, it does show the level of momentum in a given time period and you can see that the Minor wave 2 rally has been getting weaker and weaker as it has made new highs as reflected in the MACD histogram. So, I should be looking to short when the opportunity arises. And there would be a great shorting opportunity if we get a daily reversal pattern with a new high.
Witness the Epic Battle Between Investor Hope and Investor Fear
Elliott Wave International
The EUR/USD has tried very hard to establish an uptrend. And although it has technically done so by definition, i.e. higher highs and higher lows, it is an extremely weak and hard faught uptrend. Every new high has resulted in sharp reversals to the downside. But the most recent attempt at a new high has failed, and another selloff ensued. Unfortunately for the bears, that selloff has not made a new low, which would have solidified that the uptrend was broken. However, the failer to make a new high signals to me that the trend is exhausting. A new low beneath 1.2188 would signal that the larger downtrend has resumed and getting should would be wise in my opinion. I'm even taking little nips at the short side right now.
Attention forex traders: Elliott Wave International is offering a free webinar with one of the most sought-after FX trading strategists in the world. On Wednesday, July 18 at 1 p.m. (Eastern time), learn how he called recent declines in the euro-dollar and see his 45-minute presentation titled "How to Trade the Top 5 Forex Opportunities Right Now." Seating is limited to the first 1,000 active traders. Reserve your seat now.
PLEASE NOTE: THIS IS JUST AN ANALYSIS BLOG AND IN NO WAY GUARANTEES OR IMPLIES ANY PROFIT OR GAIN. THE DATA HERE IS MERELY AN EXPRESSED OPINION. TRADE AT YOUR OWN RISK.
Witness the Epic Battle Between Investor Hope and Investor Fear
Elliott Wave International
The EUR/USD has tried very hard to establish an uptrend. And although it has technically done so by definition, i.e. higher highs and higher lows, it is an extremely weak and hard faught uptrend. Every new high has resulted in sharp reversals to the downside. But the most recent attempt at a new high has failed, and another selloff ensued. Unfortunately for the bears, that selloff has not made a new low, which would have solidified that the uptrend was broken. However, the failer to make a new high signals to me that the trend is exhausting. A new low beneath 1.2188 would signal that the larger downtrend has resumed and getting should would be wise in my opinion. I'm even taking little nips at the short side right now.
Attention forex traders: Elliott Wave International is offering a free webinar with one of the most sought-after FX trading strategists in the world. On Wednesday, July 18 at 1 p.m. (Eastern time), learn how he called recent declines in the euro-dollar and see his 45-minute presentation titled "How to Trade the Top 5 Forex Opportunities Right Now." Seating is limited to the first 1,000 active traders. Reserve your seat now.
PLEASE NOTE: THIS IS JUST AN ANALYSIS BLOG AND IN NO WAY GUARANTEES OR IMPLIES ANY PROFIT OR GAIN. THE DATA HERE IS MERELY AN EXPRESSED OPINION. TRADE AT YOUR OWN RISK.
Tuesday, July 10, 2012
Stocks Trying to Roll Over; Euro Rolling Over
Let's get some percpective on the markets here. Many of you are well aware of what I'm about to write, but it's still good to read it to keep things in the proper perspective of what we're doing. Sometimes we get so involved and tunnel visioned in our analysis and trading that we forget the bigger picture. It's time to take a quick step back and look what we're doing.
Starting from the marked Primary wave ((2)) high above, there was a nice clean impulsive decline into Minor wave 1. From there, we have a choppy overlapping low volume rally into what could be the Minor wave 2 top. This is textbook EWP analysis and it couldn't be clearer what will happen next, i.e. Minor wave 3 down in an aggressive sharp move. But to be honest, I hate textbook market moves because that means it's easy and obvious. And easy and obvious usually mean the market will do the opposite. With that said, I trade on the evidence. I trade on what the market tells me to do. And I employ discipline like an Army drill sergeant to trade my system and not try to outsmart myself with whims and "feelings" on the market. Keep it simple, the wave count and risk/reward favors the bears right now so I'm trading the probabilities. Right now evidence is strong that Minor wave 2 topped already, or will top with one sharp and short new high. So that means I should be looking to short. By having a stop just above 1374.81, the risk/reward is desirable for the bears.
Note: EWI is still offering a good trading resource for free until July 16, 47-Page eBook: How to Spot Trading Opportunities. I always recommend taking advantage of free trading resources from credible sources. You never know when you're going to find one little thing that becomes an invaluable tool in your trading toolbox for for many years. Download this eBook now.
The euro continues to fall. There is no reason to think it will stop any time soon. The swing highs remain intact and I continue to short against the most recent swing high. Right now my stop is just above 1.2334 and I will trail it down with the euro. Until the series of lower highs is broken, this trade will continue being easy and profitable, which is something very rare we get from any market. The next support level is 1.1876, which will either be immediately taken out, or will be taken out after a few attempts. The bottom line, the euro is very bearish for the foreseeable future and has almost 400 pips to fall before any meaningful support gets in its way.
Learn Elliott Wave Principle (EWP)
PLEASE NOTE: THIS IS JUST AN ANALYSIS BLOG AND IN NO WAY GUARANTEES OR IMPLIES ANY PROFIT OR GAIN. THE DATA HERE IS MERELY AN EXPRESSED OPINION. TRADE AT YOUR OWN RISK.
Wednesday, July 4, 2012
Stocks to Fall Hard Next Week; Euro Decline Resumes Toward 1.2288

Prior to yesterday's rally, the S&P cash index changed a whopping 11 points since my last post. Hence the reason I have not posted anything. The market appears to be finishing up a final C wave of Minor wave 2 as evident from the 5 wave rally leading into my projected Minor wave 2 above. Since it's a holiday week we're in, volume will probably remain light and there may be an upward bias until next week. But any rallying should be capped at the wave ((2)) high of 1422.38. The outlook since my last post remains the same though, the market is setting up for a major top and big decline as long as 1422.38 in the cash index is not exceeded. This presents a good risk/reward opportunity for the bears.
Note: EWI is offering another good trading resource for free until July 16, 47-Page eBook: How to Spot Trading Opportunities. I always recommend taking advantage of free trading resources from credible sources. You never know when you're going to find one little thing that becomes an invaluable tool in your trading toolbox for for many years. Download this eBook now.
I'll be back with another post when something interesting happens, or if the outlook changes from the above stated projections. Have a happy 4th Americans!!
Learn Elliott Wave Principle (EWP)
PLEASE NOTE: THIS IS JUST AN ANALYSIS BLOG AND IN NO WAY GUARANTEES OR IMPLIES ANY PROFIT OR GAIN. THE DATA HERE IS MERELY AN EXPRESSED OPINION. TRADE AT YOUR OWN RISK.
Tuesday, June 19, 2012
Stocks Ending Minor Wave 2; Euro Topping
I'm going to continue to be very busy the next week or so, so I'm just posting a quick update here and will be back when significant market action occurs.
The S&P is nearing the end of Minor wave 2. This simply means that a big, sharp and fast Minor wave 3 down is coming soon. There are no real signs of a top yet, but when a reversal pattern forms, the risk/reward would favor the bears to jump in aggressively short. I'm simply looking to short on rallies at this point. The S&P should not exceed 1422.38 if the above wave count is to remain valid. So my stop is just above that level.
Learn Elliott Wave Principle (EWP)
The euro did the opposite of what I projected in last post. I projected a resumption of the downtrend but instead it rallied hard to a new high. I'm unsure if a top is in now, but the larger trend is down so I'm indeed looking for a top so I can reshort. This week's high was not exceeded on today's rally and the 4 hour chart shows a reversal candlestick. I feel it's worth the risk/reward here for the bears to short against the high at 1.2747. The risk is fairly tight, and if a top is in, the euro will far hard and fast to a new low.
PLEASE NOTE: THIS IS JUST AN ANALYSIS BLOG AND IN NO WAY GUARANTEES OR IMPLIES ANY PROFIT OR GAIN. THE DATA HERE IS MERELY AN EXPRESSED OPINION. TRADE AT YOUR OWN RISK.
Monday, June 11, 2012
Stocks Drop in ((b)) Wave Only; Euro Topped
The market was poised for huge gains today as US futures were up big last night. Although by the time the US cash market opened this morning, the rally had fizzled and stocks were spiraling downard. Most likely it was up on speculation the Spain bailout would save the world. But that speculation was crushed, and reality set in with a big selloff most of the day today. The flip to the downside was big. Internals were firmly bullish at the open and then flipped to become extremely bearish by the close. But all-in-all, the important takeaway point here is volume. Despite the big reversal today, volume was very light with NYSE shares totaling only 739 million. This is probably a "b" wave down. That's all.
Listen: EWI's Chief Analyst Hochberg Explains Recent Action in Stocks, U.S. Dollar and More
The daily S&P cash chart shows an outside reversal that would suggest the larger downtrend has resumed, i.e. Minor wave 2 up is complete and wave 3 down is underway. But with volume so light, and the correction so fast as far as time is concerned, it is tough to have confidence that a top is in. I think this is a fakeout. The market may fall a little more short term, possibly even toward 1275, but ultimately it will probably bottom and rally sharply for wave ((c)). I don't like trading corrections, or putting too much weight into anticipating when they will end since there are so many variables in EWP on how a correction can unfold. Instead I like to look for basic technical signs of a reversal instead. Today's internals and price action got my attention, but the volume was just too light, the length of the correction just doesn't look right. So I'm holding off calling a top and resumption of the downtrend for now. Only a solid break of the Minor wave 1 low at 1266.74 with increasing volume would have me reconsider that.
Don't miss out on free trading tools. Elliott Wave International is extending their offer to get their 10 page monthly newsletter, The Financial Forecast, for free. They will offer it free until June 14th. Check it out here.
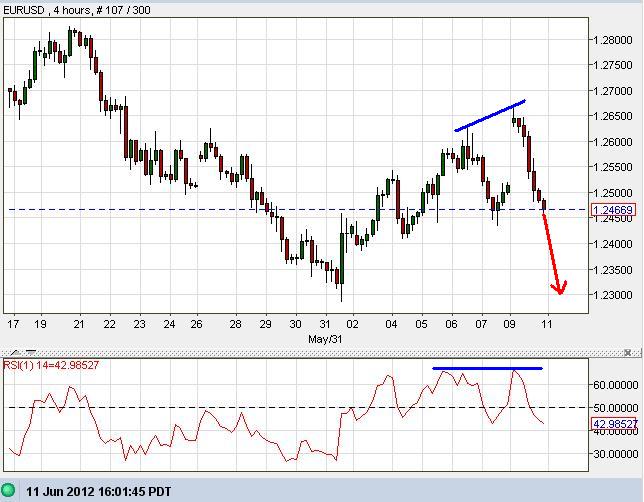
In last post I suggested a top was forming partly because the 4 hour RSI was diverging from price, and since a candlestick topping formation was unfolding. Unfortunately the EUR/USD popped higher big time Sunday night on a gap which stopped out my short position. Still having confidence in the bearish outlook though, I re-establish 50% of that short position in anticipation of the gap closing this week. I just didn't realize the gap would close this quickly. If it rallied higher I would have slowly added to the position. But I didn't get the chance. The EUR/USD appears to have topped now and is headed towards 1.2300 at a minimum.
Learn Elliott Wave Principle (EWP)
PLEASE NOTE: THIS IS JUST AN ANALYSIS BLOG AND IN NO WAY GUARANTEES OR IMPLIES ANY PROFIT OR GAIN. THE DATA HERE IS MERELY AN EXPRESSED OPINION. TRADE AT YOUR OWN RISK.
Thursday, June 7, 2012
Stocks and Euro Due to Pull Back Short Term
Internals today supplement the price action well. Price was modestly higher throughout the day, but the S&P and Nasdaq lagged the Dow's gains the whole time. At the close, only the Dow was up. So far, the stock rally is not firing on all cylinders, nor does it seem like the start of a large new uptrend. It looks more like a rally to relieve a severely oversold condition. It seem like a correction. Volume was light today, showing a lack of enthusiam to buy stocks overall, and despite the Dow closing up, NYSE down volume exceeded up volume. So a bit of a fractured unenthusiastic market here.
For those of you that missed it a few days ago, Elliott Wave International is extending their offer to get their 10 page monthly newsletter, The Financial Forecast, for free. Take advantage of free tools and resources folks. They will offer it free until June 14th.
The above count shows a different way to look at the decline and current bounce than what I've showed previously. But like I said before, no matter what the count, they're mostly all bearish for the longer term. Here we have Minor wave 1 complete, suggesting a sharp and deep rally for Minor wave 2. The "sharp" and "deep" element is not required, although according to EWP it is likely. The current action in the market suggests a pullback is coming. Most likely it's a ((b)) wave. Once complete, a sharp ((c)) wave rally should unfold higher to the 1375-1400 area before topping.
This outlook is highly speculative. What's important right now is that a clear 5 wave decline has occurred from the high on the year. It can subdivide further like the counts in my prior post suggest. But the bottom line is that the larger trend is down. So without getting too caught up in the fine details of each and every move, I want to keep the core thesis in mind which is that the stock market's larger trend is down and I want to find opportunities to align myself with that trend.
Learn Elliott Wave Principle (EWP)
The EUR/USD did in fact bottom and reverse strongly last Friday like I suggested it would. But the intraday charts suggest the rally is in trouble. At the top, the 4 hour chart shows that price made a new high and reversed with the RSI confirming that new high. That's toppish and bearish. Also notice the 5 hour chart formation suggesting a top is forming if the pattern holds. You can see I circled a bullish candle, followed by a dragon fly candle (indecisive signal) followed by what might end up being a big bearish candle if it holds. This type of formation shows a lack of interest in buying the current rally and that the bulls see this and are starting to sell. This formation, along with the RSI divergence, are often seen at market tops. Whether this is a short term top or long term top is unknown right now. But either way, I established a small short position a couple hours ago with a stop just above 1.2625. With the potential for a major downtrend to be resuming here and a nice tight stop level in sight, I think it's well worth the risk to short here.
PLEASE NOTE: THIS IS JUST AN ANALYSIS BLOG AND IN NO WAY GUARANTEES OR IMPLIES ANY PROFIT OR GAIN. THE DATA HERE IS MERELY AN EXPRESSED OPINION. TRADE AT YOUR OWN RISK.
Friday, June 1, 2012
Stocks Tank, in Line with Forecast; Euro Daily Candle Warning to Bears
The weakness in stocks continued to a new low as forecast in last post. There are several different ways to count the decline, most of them are impulsive suggesting the larger trend is firmly down for the foreseeable future. The only question is at what degree should the waves be labeled? Above are my top choices. Both have one thing in common, if the counts are correct prices will stay below the wave (ii) high at 1415.32 (S&P cash index). So I'd have stops just above that level for now and let the market play itself out. As the pattern develops more, hopefully I can drop my stop lower to reduce risk.
Learn Elliott Wave Principle (EWP)
The action on the daily EUR/USD chart is very telling, and is worrisome for the bears. It shows an RSI that is trying to recover from being deeply oversold accompanied by a daily outside reversal candlestick forming on the daily chart. If that candle holds up through the close today, the EUR/USD looks to have put in a bottom today. When you add the fact that the euro has historically made a lot of major reversals on news days like this, it is telling the bears to take be careful. I've removed half of my short position already and am considering removing more before the close today. Euro bears beware here.
How a Simple Line Can Improve Your Trading Success
Just to add on to my previous thought, the 4 hour chart above shows a long and drawn out bullish divergence occurring between the euro's price, and the RSI. Priced continued to make lower lows while the RSI was making higher lows. This build up has carried over to the daily chart where the RSI is bouncing hard out of oversold territory, and is doing it on a big news event today and an outside bullish reversal candlestick forming. Euro bears beware.
PLEASE NOTE: THIS IS JUST AN ANALYSIS BLOG AND IN NO WAY GUARANTEES OR IMPLIES ANY PROFIT OR GAIN. THE DATA HERE IS MERELY AN EXPRESSED OPINION. TRADE AT YOUR OWN RISK.
Wednesday, May 30, 2012
Stocks Falling in 3rd Wave; Euro Heads Towards 1.1875
The projected wave iv I had in last post has gotten too big compared to wave ii at the same degree. Although it breaks no EWP rules, it is not ideal and does not have EWP's "right look". So I relabeled the waves to what you see above. This count is aggressively bearish, and I usually like to go with the more conservative and cautious count, but price action demands this count be respected. And the euro is showing no signs of slowing down on its way to 1.1876, which is also a good setup for stocks to selloff hard with it. Look out below!
On a side note, don't miss out, only one more day to get Elliott Wave International's free Financial Forecast newsletter. Offer expires Thursday, May 31st. Take advantage of free tools everyone: Download EWI's new 10-page May 2012 Elliott Wave Financial Forecast here .
The euro has solidly broken through 1.2600 support. As I said in last post, there is nothing really holding up the EUR/USD until 1.1876. Since last post, the EUR/USD has dropped almost 200 more pips. Although price action looks extremely bearish, and a waterfall of a decline may occur, be prepared for pops along the way - at least psychologically. I don't see any reason to abandon the aggressively bearish view at this point. Longer term, the EUR/USD should make it to the 1.1876, and it's quite possible it will make it there in quite a hurry as the price action suggests.
14 Elliott Wave Trading Insights You Can Use Now
Also, remember this chart above from my May 12th's post (click here for full post)? It shows the weekly EUR/USD and the big declines that occurred after big chart gaps. In the past, there was a 2700 and 1100 pip loss following their gaps. The most recent gap occurred around 1.3000, and the pair is currently trading at 1.2400, which registers a 600 pip loss so far. So history is repeating itself. There still may be plenty more to go, but again, be prepared for sharp rallies and major reversal patterns. *** Momentum on the intraday charts is showing that a bullish divergence is building, and the daily RSI is oversold. I'm still aggressive in taking big short positions, but am also closely watching for any big reversal patterns that demand I protect my gains. ***
PLEASE NOTE: THIS IS JUST AN ANALYSIS BLOG AND IN NO WAY GUARANTEES OR IMPLIES ANY PROFIT OR GAIN. THE DATA HERE IS MERELY AN EXPRESSED OPINION. TRADE AT YOUR OWN RISK.
Subscribe to:
Posts (Atom)