
I don't have much time to get into great detail this afternoon so I spent most my time having the charts do the explaining to me. The strength in the market is not really conducive of a correction at this point. So the bearish outlook I've been talking about lately has decreased in likelihood. Goldman Sachs also made a new high, negated the 5 wave drop I mentioned yesterday. However since the current rally is supposed to be a wave (ii), we can expect similar-type strength to occur. However, I feel it's gotten to a point where it's almost too much to be the characteristic of a correction. Don't get me wrong, there is plenty of evidence to support the wave (ii) scenario, but now there is evidence building quickly for the bullish side as well.
I have to draw a line in the sand so I know when to start abandoning the wave [3] or C outlook for now. 1180-1185 in the S&P cash index has been a prior congestion area as you can see from the above chart. If the market can get solidly above that range and sustain it, then I would be reluctant to maintain aggressively bearish positions at that time. The behavior around that level is key. If the S&P struggles and reverses the 1180-1185 area, then the bearish view is still on track. But if it cuts through it like it wasn't even there and then holds above it for the close or for a few hours, then I will interpret that as the market wants to make new highs on the year and that wave [3] or C is NOT underway at this time.
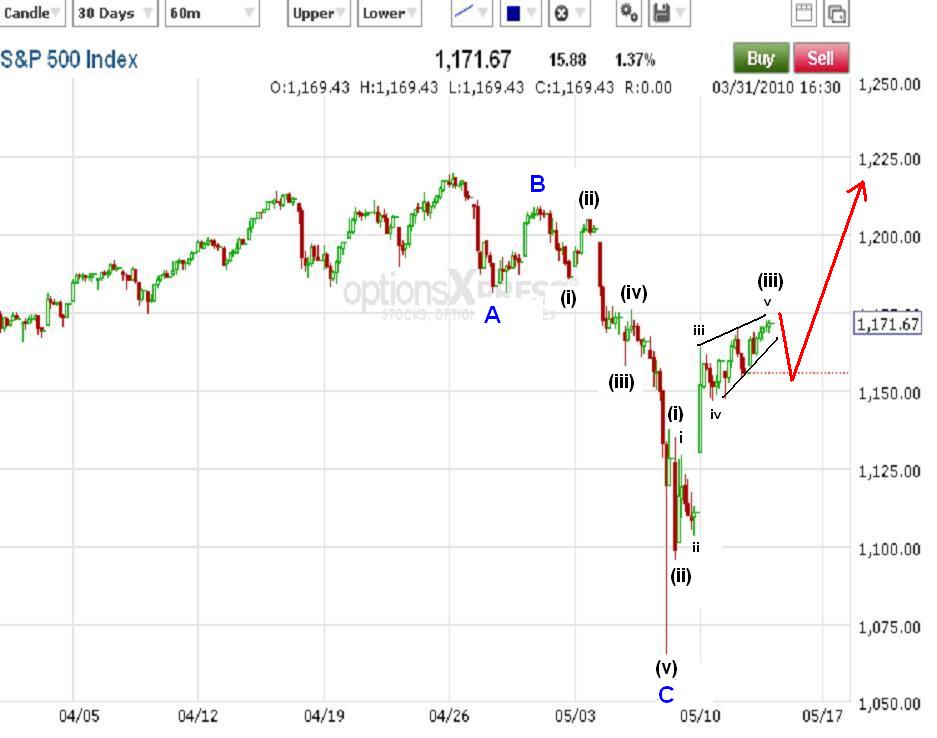
I feel we're left at crossroads today, with two possibilities that now unfortunately have equal weighting as far as their likelihood. One is bullish and one is bearish (see below). Notice that both counts below suggest an ending diagonal is forming (see ascending triangle on charts). So just because we may get a sharp selloff soon, that doesn't necessarily mean that wave [3] or C is underway again. We still need to be mindful of the bullish scenario that allows for a correction before resuming its uptrend as well. A break below 1140 would drastically reduce the bullish count's odds of occuring, a break below 1130 would be a very strong signal that the bullish interpretation below was unlikely, and a break below 1110 would confirm that the bullish interpretation is not occurring.
BEARISH COUNT

BULLISH COUNT

No comments:
Post a Comment