
Yesterday's post laid out two scenarios: one bullish and one bearish. I know, saying the market will go either up or down doesn't really do anybody any good. But at this time we just need to keep both counts in our sights and let the market play out so we can see which one appears more likely to be unfolding. Looking at yesterday's bearish and bullish charts you can see that something like an ending diagonal was occuring in both, and that at least a near term pullback would occur no matter which count proved to be correct.
We see in the above daily chart that the resistance zone I cited yesterday remains well intact. That area is a major congestion area and very important for the bearish case. If that ceiling doesn't contain this current rally, then the short term bearish case is in severe trouble. But so far it's held, and today was a nice impulsive looking reversal that closed on the lows for the day. Something that hasn't happened in a while. So resistance held, and we finally see a solid sign of weakness in the market. On top of that, today's internals were quite flat as the market was flat most of the day. But the late day selloff soon changed that where closing NYSE downside volume was 78% of total volume, and pushing the Dow down over 100 points. So the bears really roared back into the close. Plus, the VIX closed up 4.55%, so there was definitely some fear at the end of today. Not exactly what I'd expect if the "all clear" signals were raised since the Greek bailout. But with that said, the S&P has still rallied at total of 108 points from last week's low, so the bulls do have something to hang their hats on.
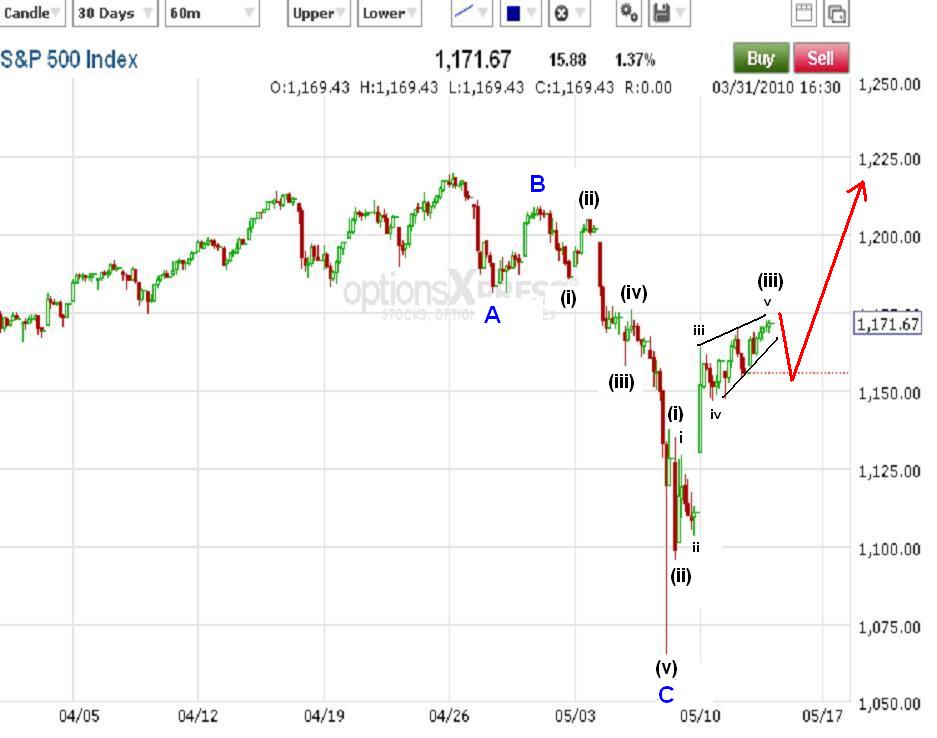
S&P 60 min Chart Bearish Count

So let's look at the wave count. Above is the bearish count from yesterday (click here for yesterday's bullish count). Both the bullish and bearish counts remain valid and quite possible. So how do we find out which one is most likely correct? Glad you asked. The fact that there is an apparent ending diagonal that just occurred, it's more likely that the bearish count is underway because it's much more common for such a structure to occur at the end of a wave 'C' than it occurring at the end of a wave '(iii)'. In the bullish count, it's possible the ending diagonal was wave '(v)', instead of wave 'v' of '(iii)' as shown in the chart. But the problem is that wave '(ii)' and wave '(iv)' would not proportionate in time or size at all as wave '(ii)' is much bigger and longer than what wave '(iv)' would be. So I think it's best to label the bullish count wave 'iv' at a smaller degree. If so, it means that it's a wave '(iii)' ending with an ending diagonal. That's fairly rare.
An ending diagonal, or similar structure, is a signal of the market trend exhaustion. It's a sign that the preceding trend is really tired and going to be reversed soon. Because of this, we often see sharp reversals that retrace most of the diagonal pattern quickly, if not much more. So regardless of whether the bullish or bearish count is correct, we should see the S&P get to at least the 1150 area soon. Retail sales data is coming out tomorrow, to which I could care less about, but some people in the market will have a lot of interest in those numbers so we may get some movement in the morning from that data. It may also be important to pay attention to how the market closes tomorrow. If the market closes down fairly big and the VIX spikes higher, this may be very bearish since it shows that people don't want to be long going into the weekend and that they're buying a lot of option put protection. Bulls having a lot of fear going into a weekend is not the sign of a healthy market, rather it's the sign of a market on the brink.
So let me list the following levels that will strengthen the bearish count more and more as each level is taken out:
1) breaking below 1145 in a strong impulsive manner is a good start for the bearish case, but the market still has a lot of work to do to convince me wave (iii) of 3 of [3] or C is underway.
2) breaking below 1129.32 would mean that the bullish count I have labeled right now is invalid since wave '(iv)' would enter the price territory of wave '(i)', which is a big rule breaker in EWP. So this would make the bearish count much more likely.
3) getting to 1110.88 would close that huge monster gap left from Monday's "the world is saved" rally and erase all the Greece bailout gains. That would be very bearish and almost confirm that the market was headed much lower from there.
4) breaking below 1100 would pretty much officially eliminate all of the viable and likely bullish scenarios I can see, so this would confirm that at least last week's lows of 1066 will be broken soon.
In today's late day selloff, it appears that we may have wave 1, 2 and 3 down from today's highs. Let's see if we can get waves 4 and 5 to unfold tomorrow morning. From there we'll watch how the market behaves around 1145, i.e. if the market shoots right through it then that's bearish, but if the market flip flops or reverse around it then it MIGHT be bullish. And lastly, let's watch to see if people are buying or selling with any intensity into the close, and if the VIX is soaring from fear going into the weekend. Hopefully we'll get some good movement tomorrow to give us a better idea of the larger trend going into the weekend. But right now, I feel the bearish count is slightly more likely than the bullish count simply because of the ending diagonal pattern fitting better with a wave 'C' than a wave '(iii)'.
PLEASE NOTE: THIS IS JUST AN ANALYSIS BLOG AND IN NO WAY GUARANTEES OR IMPLIES ANY PROFIT OR GAIN. THE DATA HERE IS MERELY AN EXPRESSED OPINION. TRADE AT YOUR OWN RISK.

No comments:
Post a Comment