There's a lot to go over today but I'll try to streamline it so it's easily consumable. For proper context of larger wave structure for wave (ii) please check out my last post from Friday, or at least check out the chart from there by clicking here.
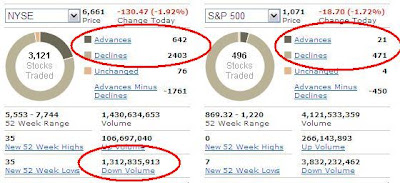
So most of the day the Dow was positive, showing some strength in the market as it shot off the lows from early this morning. The wave structure looked very sloppy as the decline since Friday has been a series of overlapping waves which is characteristic of a correction. But the internals of the market looked horrible. As the Dow was up about 40 points the NYSE was down 0.50%, and there were significantly more decliners than advancers and down volume was well exceeding up volume. Goldman Sachs and the XLF were also weak. I put the primary focus on wave structure so I thought we'd get a quick pop higher, led by the Dow, to new highs from Friday and then the market should reverse sharply from there, possibly ending wave (ii). But that obviously didn't happen as the pull of the market was too much as it tanked hard into the close, even pulling the resilient Dow down triple digits into the close. If you look at the internals above you'll see that today was a big down day, despite the Dow only being down modestly. The S&P only had 21 stocks close up, 79% of stocks on the NYSE closed down, 92% of total volume was to the downside on the NYSE, and all this was done on decent volume overall.
As you'll see below, the market today was solidly down despite the Dow's resilience, and the behavior in the Nasdaqs, Russell 2000, and VIX tell me that people were aggressively moving out of high risk assets and into "safer" assets. Most of which are in the Dow, hence it's relative strength today. All-in-all, this is bearish when risk aversion starts to creep back into the market and it's a nice setup for wave (iii) of 3 of [3] or C to get underway.
Nasdaqs Make New Highs While S&P and Dow Do Not


Above shows another bearish scenario that occurred today as the Nasdaq 100 and Composite both exceeded their Friday highs while the S&P and Dow did not. This last surge in tech may be the usual surge higher and reversal that occurs at market tops at a larger degree. The fact that the Nasdaqs made new highs, then closed deep in negative territory on the lows of the day is very bearish in my view. And when you combine the fact that the Dow and S&P did not confirm the Nasdaqs' rise, it makes it even more bearish.
Nasdaq 100 Count

So the Nasdaq 100 sports the best EWP count of all the major indices in my view. This is mainly because it made a nice new high today and then declined impulsively after that. The other indices' declines are very choppy and tough to count on the intraday charts at this point. Above is the simple wave structure that might be unfolding right now in the NDX. The S&P breaking below 1066 will be even further evidence that wave (iii) is underway, and a break below 1040 will all but confirm it.
The VIX's Ascent

I'm not a VIX expert, but know enough about it to see that over the past two days that fear has been steadily creeping more and more into the market. Despite the stock indices moving somewhat sideways or choppy Friday and today, the VIX has worked itself decisively higher. So on the surface people may see a strong Dow that flipped to modestly down at the close thinking this is just a normal pullback in a new bull run to new highs on the year. But underneath we see very bearish internals, a bearish divergence with the Nasdaqs, an impulsive decline developing in the Nasdaq 100, the small caps and financials taking a big beating, and the VIX shooting higher. So to me, this market is looking very bearish, and barring a big across the board bull surge tomorrow, this market should be headed much lower. Again, 1066 in the S&P is the first target, then the 1040 level.
PLEASE NOTE: THIS IS JUST AN ANALYSIS BLOG AND IN NO WAY GUARANTEES OR IMPLIES ANY PROFIT OR GAIN. THE DATA HERE IS MERELY AN EXPRESSED OPINION. TRADE AT YOUR OWN RISK.
No comments:
Post a Comment