Yesterday I said, “I would not be surprised if Tuesday brings us a selloff…” As a result, today the market did this:
Yep, the market went straight to the moon and didn’t look back. However, immediately after saying that I said this, “… with no evidence suggesting a top is in there is nothing I will do for now.” In other words, I thought the market would selloff today, but with no signs of a top I’m not going to put my money where my mouth is. So in that respect, I can save some face here. Until the market shows us it’s likely a top is in, I have no intentions in trying to predict the future and call a top while the uptrend still remains well intact. So I’m still standing aside, waiting for an opportunity to short when I see one. That opportunity will arise when I see a big reversal day on solid volume, a gap down day that’s sustained throughout the day, and/or a close below the trendline I’m following (see below).
Internals today were fairly strong, although not dominant on the bullish side. Up vs down volume was only slightly in the bulls’ favor and there were 841 more advancers than decliners on the NYSE. So a bullish day, but nothing jaw dropping. What is of note in the data here is the low volume again. So that’s back-to-back days of very low volume on big up days, with today coming in about the same as yesterday staying well under 900 million shares. So price continues to go up, but enthusiasm and momentum are waning. That doesn’t mean the market will top right now, it just means that once we see signs of a reversal, I feel the risk/reward advantage lies in the bears’ hands (paws) and shorting should be the preference.
The S&P has a trendline in place on the daily chart that I want to see broken soon. A close below it would be a good sign that the uptrend might be broken. But a close below 1275 would give us a convincing new low and provide even more evidence of a top. I know that level is far away, but depending on risk tolerance and trading style, I also wanted to note the trendline where more aggressive traders might find it as a more viable level to watch. I’m waiting for a big reversal day, or perhaps a big gap down day to get my attention prior to the levels I mentioned above. But until then, I’m waiting patiently on the sidelines.
Learn Elliott Wave Principle
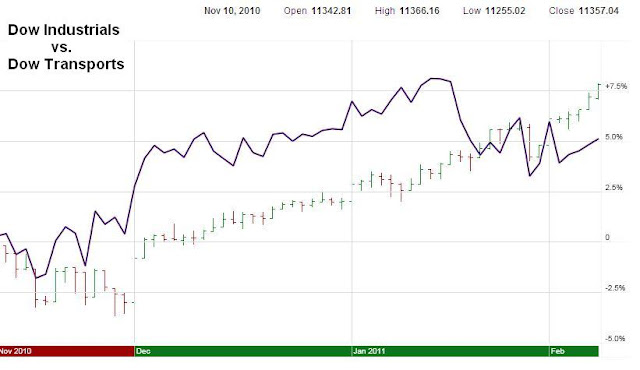
As you can see from the above charts, momentum has already been bleeding from the rally lately. The NYSE composite chart shows how volume has tailed off the past few days. And as Elliott Wave International has been pointing out the past week or so, the Dow Industrials and Dow Transports are diverging right now as the Transports have failed to confirm the recent Industrials’ high. So Dow Theorists are taking note and some self-fulfilling prophecy, if anything, could lead to a selloff just on that setup alone that could help fuel a larger selloff. Lastly, you can see that the RSI is still failing to confirm the new highs in price on the S&P as well.
So the market’s structure looks weak and ready to fall at any moment. But until we get signs of a reversal, I’m not touching this market.
On the Docket: The Case Against Diversification
Lastly, the euro declined in a nice impulsive 5 wave this month telling us that the trend has returned to down for the short term at least. Most likely a flat correction is finishing up with wave c in its final stages. If the count is correct, a sharp selloff should occur soon, and most likely it will coincide with a decline in stocks since they too are setup to fall off a cliff at any moment. Shorting the euro now looks like a good risk/reward trade with a stop just above 1.3861. But if that’s too much risk, a short with a stop just above today’s high could be established if we get a new low on the hourly chart.
PLEASE NOTE: THIS IS JUST AN ANALYSIS BLOG AND IN NO WAY GUARANTEES OR IMPLIES ANY PROFIT OR GAIN. THE DATA HERE IS MERELY AN EXPRESSED OPINION. TRADE AT YOUR OWN RISK.


No comments:
Post a Comment