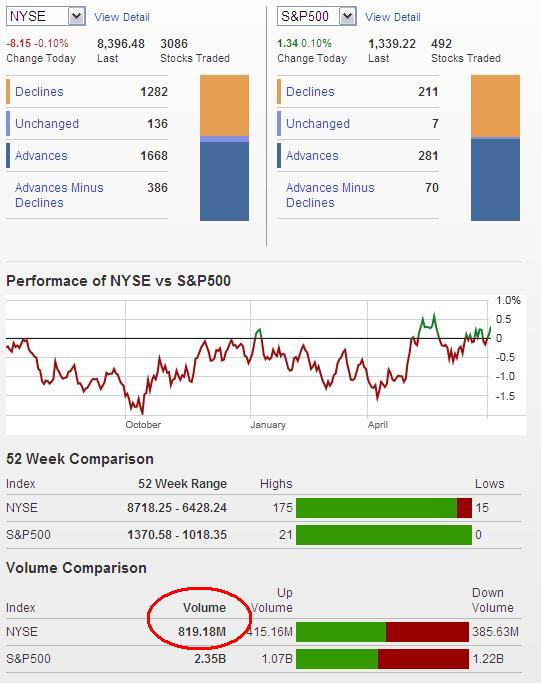
Internals were flat today and volume was extremely low at 819 million shares on the NYSE, so enthusiasm to buy the rally here has waned. I think that a small decline or some sideways action the next few daysmight be in order.
Learn Elliott Wave Principle

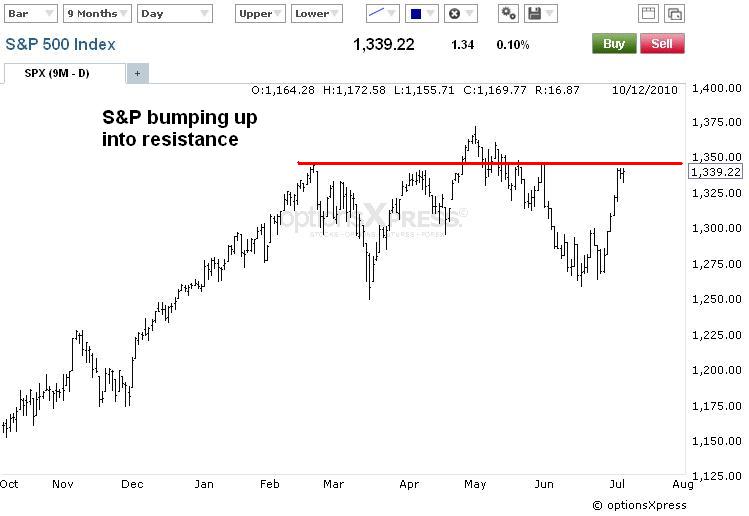
Either way, I have no reason to abandon the bullish outlook for stocks in the medium term. Aside from some sideways action or a small pullback at resistance here, I think the markets are in an uptrend and the bullish side should be played when opportunities arise.
How to Set Protective Stops Using the Wave Principle

I'm being very speculative here by labeling the euro a triangle above, but until a new swing high or low is established, the price action is telling us it's consolidating which is oftentimes a triangle in EWP terms. So I'll take a chance and follow this count. Now this is a bullish triangle so a sharp thrust higher should get underway in the next few days once wave ((e)) ends. So be ready. But a break below the wave ((c)), and especially wave ((a)), lows will negate this triangle and open the door to further selling in the euro.
PLEASE NOTE: THIS IS JUST AN ANALYSIS BLOG AND IN NO WAY GUARANTEES OR IMPLIES ANY PROFIT OR GAIN. THE DATA HERE IS MERELY AN EXPRESSED OPINION. TRADE AT YOUR OWN RISK.

3 comments:
You are correct in your analysis so far. The market seems fallowing your directions. If the S&P does not break out from this level and move south, a head and shoulder formation may be forming. What are you thoughts?
This NYMO chart is on my indicator page, every day updated. Here is
the link. I would like to add more key items, to make it easy to
review, i.e. don't miss the key elements.
http://oahutrading.blogspot.com/p/new-page-for-testing.html
NYMO - The McClellan, or I like to call McC because I am always afraid of spelling McC wrong
When
it has a small move, say 2 is real small, 5 is pretty small, 8 is still
small, then it predicts a big market move in 1 or 2 days, sometimes
three.
It just had a small move. Of 6 points.
Also in chart below, mucho neuvo highs! And very few new lows. I guess that's bullish.
chart here:
http://oahutrading.blogspot.com/
Yeah, I agree. A breakout to the downside, meaning a sharp and large decline, from current levels would leave a nice big head and shoulders top in place. The marke is right at the resistance line right now so it's behavior from here is key.
Post a Comment