Thursday, April 1, 2010

Thrusting from the Triangle


The market decided to just thrust from the triangle this morning with a very sharp rise into about midday where it reversed nicely, only to be bought up at the close. Quite a see-saw day. The thrust in the morning is very typical of what to expect after a triangle, but is very short in length and time as it stands right now, even though it made a new high. The decline was much weaker and longer than the preceding rise and was bought up at the close, most likely because no one wants to hold short over a long weekend, especially with jobs data coming out tomorrow.

So to keep things in proper proportion and get the "right look", I'm labeling this morning's rally as a wave i within this final thrust upward. The midday decline was wave ii, and we're in wave iii right now. If correct, the market should shoot aggressively higher on Monday and take us to a possible test of 1200. But remember, thrusts are terminal moves that are immediately completely reversed when complete. So thrusts' sharp and fast nature shouldn't scare EW'ers, they should make us happy because we see opportunity.

A break below 1167.15 would mean the thrust ended today, and the market is in a larger correction, or has completely reversed trend in wave [3] or B. If the market shoots higher Monday above 1181.43, then I'd expect it to continue higher for a day or two and attempt to assault the 1200 level before topping and completely reversing to at least the apex of the triangle around 1171.


PLEASE NOTE: THIS IS JUST AN ANALYSIS BLOG AND IN NO WAY GUARANTEES OR IMPLIES ANY PROFIT OR GAIN. THE DATA HERE IS MERELY AN EXPRESSED OPINION. TRADE AT YOUR OWN RISK.

Wednesday, March 31, 2010

Sideways Action Suggests a Triangle is Unfolding


In reference to my least likely triangle count I put up yesterday I stated that, "If we don't get a decisive move tomorrow based on the above two counts, then this count will probably move up to be my top choice." Well today it looked like my top WXY count was well on track with "decisive drop", but as usual, the market was bought up from that dip and the market continues to go nowhere overall. But into the close there was more selling, putting the market back down near the lows. Today was the last day of the quarter, so some flip-flop was probably expected. Unfortunately, the sideways contracting nature of the market is looking more like a triangle, which I'm moving up to be my primary count, and the WXY count is my alternate count. Also the fact that the bullish 2nd count mentioned yesterday is looking very unlikely also lends itself to the triangle being a high probability at this point. Triangles only occur in 4th, X and B waves, and so this would mean we're in some degree of 4th wave. Once the triangle is complete, it will result in a thrust higher that should be sharp and strong, but then very quickly be completely reversed to at least the apex of the triangle. So the result of this triangle will result in a sharp rally and immediate complete reversal.

A break below 1165.77 would severely weaken this count, and a break below 1161.48 would cancel the triangle out altogether and put the WXY back as my top choice.


Alternate Count


My alternate count is the WXY combination correction I mentioned yesterday. It's pretty self-explanatory in that if this is correct it means we're in a wave c of Y down that should break to at least below the 1161.48 level before bottoming, but most likely will get to the low 1150s before doing so.


PLEASE NOTE: THIS IS JUST AN ANALYSIS BLOG AND IN NO WAY GUARANTEES OR IMPLIES ANY PROFIT OR GAIN. THE DATA HERE IS MERELY AN EXPRESSED OPINION. TRADE AT YOUR OWN RISK.

Tuesday, March 30, 2010

Market Probably Finishing up a Double Zig-zag

TOP COUNT: Double Zig-zag


The market did top last week, but unfortunately it has moved more sideways than down since that time. In doing so, it has allowed the internals of the market to "recharge" for perhaps another push higher. The top count this evening is a "double zig-zag" which is the result of two ABC corrections that collectively are labeled as WXY as you can see from the 10min S&P chart above. This count seems to make the most sense as I would think the market still should decline a bit further to alleviate the overbought condition and lack of momentum currently, along with the head and shoulders formation shown in the chart above. If correct, we should shoot downward in a strong wave C tomorrow to below 1161.48 to complete wave Y. From there, we will most likely find a bottom soon and rally to new highs on the year. If the market rallies strong tomorrow with good volume and strong NYSE internals, then the short term bears better go back into their caves and allow for the market to continue higher for the foreseeable future.


1st ALTERNATE: Bullish Count


Today's extension of the 5 wave rally higher made the nice 5 wave advance I labeled yesterday look a little more mutated today. This is why it has moved to second place on my list of probable counts. This count suggests a much more modest decline will occur tomorrow which will be followed by a roaring wave (iii) higher. If correct, then the rally should be accompanied with strong volume and and NYSE internals. So it might be wise to watch the amount of NYSE advancing stocks and volume sticks on the smaller time frames to see if strong buying interest is entering on a rally tomorrow becuase it will probably result in eliminating the short term bearish WXY correction mentioned above, and putting this bullish wave (iii) count as top choice.


2nd ALTERNATE: Triangle


The least likely count is the triangle scenario which would have us moving sideways in a tight range for another day or so before thrusting upward to a new high on the year. This is less likely simply because wave "b" is quite wide and makes it an awkward and therefore unlikely triangle. But no rules were violated so it remains a possibility. If we don't get a decisive move tomorrow based on the above two counts, then this count will probably move up to be my top choice.


PLEASE NOTE: THIS IS JUST AN ANALYSIS BLOG AND IN NO WAY GUARANTEES OR IMPLIES ANY PROFIT OR GAIN. THE DATA HERE IS MERELY AN EXPRESSED OPINION. TRADE AT YOUR OWN RISK.

Monday, March 29, 2010

3 Down, 5 Up, Caution to the Bears


Here is the chart from the morning that I was finally able to post.

I wanted to notify readers that today's break above 1173.93 makes the decline last week a 3 wave affair. In addition to that, the rally from the wave C low is a clear 5 wave rally. As a result, I will exit my short position soon. If last week's lows are broken then I'll reshort. If the market falls back a bit and does NOT break last week's lows, then I'll get long.

Nothing more really occured the rest of the day since I posted this in the morning. The market is overbought on many levels but is not falling. And the little decline it did do was an ABC three waver which makes it look like a correction since the 1173.93 level was exceeded on today's rally. So at this point, any further liklihood of a sustained decline is getting dim. The market needs to prove to me it wants to fall further to correct this overbought condition by getting below 1161, or forming small impulsive declines on the 3min or 5min charts. Since I'm not necessarily looking for "the top" at this point, it's possible the ABC decline I labeled above is just the first segment in a double or triple zig-zag. Which means the market will decline lower in a corrective fashion, but still work much lower from current levels.

The bottom line is that a break below 1161 would open the door for an assault on 1153 support, and a break above 1181 would target the 1200 level.


PLEASE NOTE: THIS IS JUST AN ANALYSIS BLOG AND IN NO WAY GUARANTEES OR IMPLIES ANY PROFIT OR GAIN. THE DATA HERE IS MERELY AN EXPRESSED OPINION. TRADE AT YOUR OWN RISK.

Saturday, March 27, 2010

Keeping Lower Highs is Key to a Top Being in


The market didn't continue it's decline from the current top on Friday, but instead tried to rally again. But it could not make a new swing high (at least down to the 15min chart) and reversed in similar fashion to what it did on Thursday. Notice that 1175 in the S&P has created some problems for the bulls as it's rejected them Wednesday, Thursday and Friday. This level appears to have some importance so I'm going to watch it carefully. On the above daily chart you can see a 5 wave count possibly complete right now. So at least a correction, if not an all out sell off, should be in the cards in the very near future if it's not underway right now. Keep in mind that Mondays have often been notoriously bullish the past few months, and that we'll also be in end of the month/quarter trading early next week so a lot of josseling around and positioning will occur. Normally this all results in bullish action, but I trade based on the charts, not on what usually happens.


15min S&P Cash Index


The above S&P 15min chart shows a possible downtrend forming with lower highs and lower lows. It's simple, as long as lower highs and lows keep occuring, the trend is down. I'll simply lower my stops just above the previous swing high, which in this case is currently at 1173.93, until either I get stopped out or a 5 wave impulsive decline forms. If an impulsive decline forms I'll adjust risk accordingly. I'll explain how I do that when the time comes. But for now, I simply have a short position in place to stop out at 1174, and will continue to lower my stop with each new swing high created. If I am stopped out, that's fine, I'll simply wait for another toppish structure to form and repeat the process.

The structure and strength of the decline will tell me more about the larger trend. But right that trend is quite questionable, so I'm playing only the short term moves at the moment.


PLEASE NOTE: THIS IS JUST AN ANALYSIS BLOG AND IN NO WAY GUARANTEES OR IMPLIES ANY PROFIT OR GAIN. THE DATA HERE IS MERELY AN EXPRESSED OPINION. TRADE AT YOUR OWN RISK.

Thursday, March 25, 2010

A Top is Most Likely in


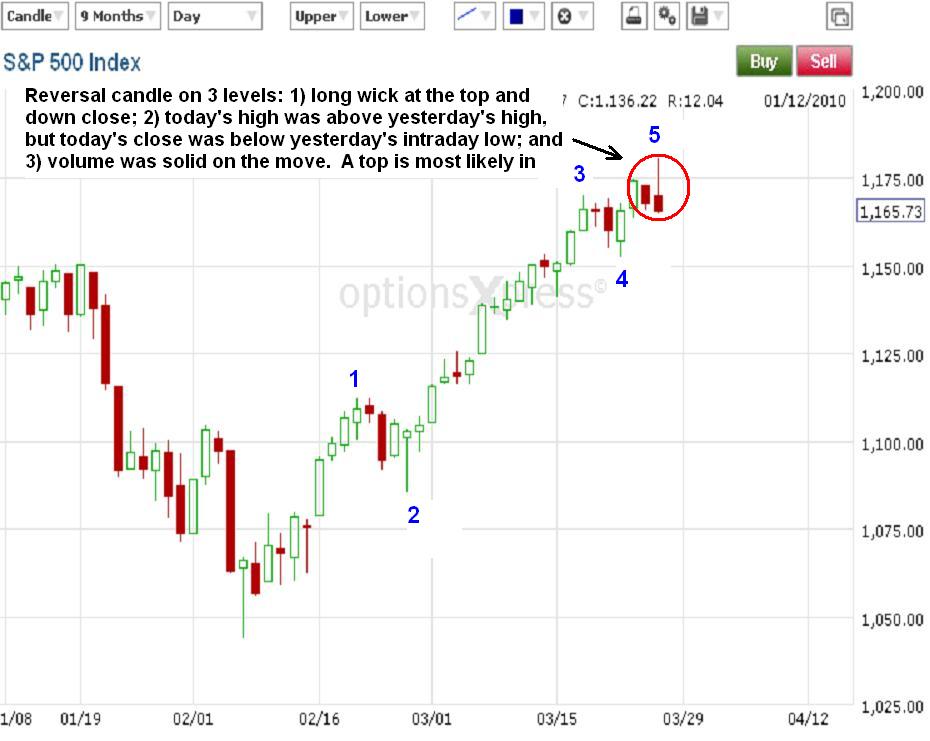
I was wrong yesterday in thinking a new downtrend started then as today's early pop right out of the gate this morning knocked that theory right out of the water. But that happiness and jubilence did not carry into the close as we had a big reversal day across the board. The daily S&P chart shows a completed 5 wave rally on the board, and today made a bearish reversal candlestick with that long wick at the top, today's intraday high exceeded yesterday's high but today reversal led to a close beneath yesterday's intraday low. Rallying to a new intraday high then reversing to close to beneath the prior day's intraday low is very bearish. In addition, the move was done on solid volume. So a top is likely in the stock market. The magnitude of that top is yet to be seen. But the strength and structure of the decline should help make that determination in the coming days.


Lastly, the above 3min S&P chart shows that it declined impulsively from the top in what's either a 1 and 2 wave completed where we're now in wave 3; or an A and B completed with us in wave C right now. The impulsive decline combined with the evidence mentioned above strengthen the case for at least a short term top in right now.


PLEASE NOTE: THIS IS JUST AN ANALYSIS BLOG AND IN NO WAY GUARANTEES OR IMPLIES ANY PROFIT OR GAIN. THE DATA HERE IS MERELY AN EXPRESSED OPINION. TRADE AT YOUR OWN RISK.

Wednesday, March 24, 2010

Fragile Downtrend Formed on Small Timeframe; EUR/USD Declined in Big Impulse Wave

S&P Cash Index Daily


Since making new highs on the year in all the major indices I'm not certain what the bigger picture wave count is so I don't want to label all the bigger picture waves just yet. So I'm keeping my scope quite small and looking for just the basics, i.e. 5 waves and 3 waves, momentum, and trends. With that in mind you can see on the S&P daily chart above that a 5 wave rally is in its final stages. And in typical EWP fashion, the 5th wave we're currently in is being completed with momentum diverging. Notice the MACD histogram below has been declining, illustrating that the moving averages have been tightening and starting to get close to crossing down, even though price has continued to rise. This divergence is typical in 5th waves so it helps add confidence to this wave count. Although the averages have not crossed down yet, which would be illustrated with a blue bar on the underside of the histogram, the rolling over on the daily chart is certainly a sign of an impending decline that should have us look more closely at the shorter term picture. Once this 5th wave rally in price completes, we'll have at least a correction of that rally, if not an outright major top and reversal of larger trend. I want to be positioned for declines at this point, and any bullish action or evidence would only make me become neutral.


S&P Cash Index 10 Minute


The above short term S&P chart shows a simple and basic look at a downtrend starting. There's a series of lower highs and lower lows. On a very short term basis, as long as the series of lower highs continues, then I'm short term bearish. The reason is that I've been expecting a top for some time now, and so any signs of a trend reversal has my attention. The series of lower highs and lows is the first hint of a top. Now we don't have an impulsive 5 waves down yet, so if a higher high develops soon then it will make a choppy overlapping decline that is most likely a correction and new highs are just around the corner. So I want to get out of the way if a higher high forms. So I'm short term bearish as long as the sequence of lower highs remains intact, and until a 5 wave decline develops. If the market rallies to a higher high then I'll simply step aside and wait again for another sign of a potential downtrend to come about.


EUR/USD Nice and Clean 5 Wave Drop


If back in October 2009 someone told me that by March 2010 the EUR/USD will have fallen almost 2000 pips and the S&P would not be down at all, but actually be up 70 points, I'd laugh my butt off. But that's exactly what has happened. Never did I think the stock market would be able to hold up, let alone rally, with a euro decline and dollar rally of this magnitude. Either the stock market is just delaying its crash or it's marching to the beat of its own drum. We'll have to wait and see on that one. But what's clear from the daily EUR/USD chart above is that this pair has traced out 5 wave down from the highs, and probably won't make a new low beneath my projected big red wave 3 at the bottom left of the chart. Because of that, it means that not only is the long term trend down for this pair, but this almost 2000 pip 5 wave decline is probably just a wave 1 in a larger 5 wave decline. That's big. Will the dollar get to parity with the euro? It will probably be close if this count is correct. Regardless, it sure has been an interesting and fun ride trading this thing down in-and-out over the past several months. And although EWP hasn't been too kind to our stock market positions, it has been very kind to our EUR/USD, and sometimes GBP/USD, trades.


PLEASE NOTE: THIS IS JUST AN ANALYSIS BLOG AND IN NO WAY GUARANTEES OR IMPLIES ANY PROFIT OR GAIN. THE DATA HERE IS MERELY AN EXPRESSED OPINION. TRADE AT YOUR OWN RISK.

Tuesday, March 23, 2010

Market Extends Higher, Looks Like a 5th Wave


I know many people would like to punch me in the face after I say that the market is finishing up it's rally since I've been saying that for about the last 100 S&P points to the upside. Trust me, I feel your frustration and my account has paid for it. I have been stumped on this rally more than any other in my stock trading career. This thing has seemed so overextended for so long but continues to float higher on practically no volume. Today there was less than 1 billion shares traded on the NYSE and the Dow pushes up 100 points, and momentum indicators continue to drag. But the market is always right, so with today's new highs across the board now I have to sit and wait for the next opportunity to get short on signs of a top. Right now I see no reason to get short right now as the market is still showing signs of strength, but getting long this late in the rally seems too risky. Once evidence of a top comes forth again, I'll mention it here as soon as I can and mention opportunities I think are worth taking. Above is a daily chart of the S&P that shows a simple 5 wave rally occuring, with us currently in the 5th and final wave of the rise. The rise can extend and be attracted to the 1200 resistance level, but there's no guarantee. My strategy now is to stand aside and wait for the market to present an opportunity. Unfortunately, right now I see none.


S&P 500 Cash Index 15min


Above is just a closeup of what the declining structure turned out to be; just a WXY double zig-zag correction. I think it's too early to start labeling the current rally from the wave Y low, but hopefully as the structure continues to unfold I'll have more certainty in the smaller waves so we can get a better idea of where to start looking for a top again.

Sorry I don't have more to say. But the last thing I want to do is impose my goals or needs onto the market, or take my frustration out on my account by losing trading discipline. So I just continue to play a lot of XBOX360 and watch every old movie in the book to keep my mind off the frustration I feel towards the markets so I can stay on track and remain focused on my trading plan and overall strategy.


PLEASE NOTE: THIS IS JUST AN ANALYSIS BLOG AND IN NO WAY GUARANTEES OR IMPLIES ANY PROFIT OR GAIN. THE DATA HERE IS MERELY AN EXPRESSED OPINION. TRADE AT YOUR OWN RISK.

Monday, March 22, 2010

Nasdaqs Make New Highs, Russell Declined in 5 Waves; so Who's Leading the Market?

S&P Cash Bearish


Above is a continuation of the count I posted Sunday. If the larger trend has turned down, then this is one of the ugliest and most pathetic impulse waves I've seen in a long long time. This ugly structure, along with the fact that the Nasdaqs made new highs, prevent me from being very confident in the bearish short term outlook. The Nasdaqs making new highs today most likely means they're leading the market, and will pull the other indices to new highs as well, which is what Tech usually does. But as long as the Dow and S&P remain below their highs on the year, the bears have a great risk/reward opportunity to get positioned with tight stops, and there's plenty of evidence to the bearish side anyway. One reason it may be worth while other than the possible 5 wave down S&P count shown above, is the behavior in the Russell 2000.


Russell 2000


The high risk indices, like the Nasdaqs, tend to lead the overall market. Even though the Nasdaqs made new highs, the Russell 2000 did not, and it declined in a much more probable impulsive move last week. So are the Nasdaqs leading the market higher, or is the Russell leading the market lower? Unfortunately I have no idea, but the evidence of an overextended rally and limited upside for the bulls tell me that I should be looking for opportunities to get short when I see them.


S&P Cash Bullish


Lastly, I wanted to show the bullish count. This accounts for the declining structure much better than the impulsive decline in my view. But the other evidence of an exhausted rally is just too overwhelming for me to disregard all that and get long at this point. So I'm opting to let the market decide for me. As long as the both the Dow and S&P remain below their highs for the year, then I'm bearish. A break above those highs will again have me stand aside looking for another opportunity to get short for the short term. The larger trend outlook at this point is inconclusive.


PLEASE NOTE: THIS IS JUST AN ANALYSIS BLOG AND IN NO WAY GUARANTEES OR IMPLIES ANY PROFIT OR GAIN. THE DATA HERE IS MERELY AN EXPRESSED OPINION. TRADE AT YOUR OWN RISK.

Sunday, March 21, 2010

S&P Bigger Picture Still Unclear, but Short Term Picture Suggests Further Weakness


Sorry for the late and brief post; it's been a very busy weekend and I'm barely able to squeeze this in but I think we're at an important juncture and I'd like to chime in with my core thoughts.

The S&P is not unfolding very impulsive-looking since the top. But I can label it as such with a little "maneuvering" without breaking an EWP rules. Because of its imperfect structure, I can't say with any certianty that a major top is in. But the fact that the Dow and Nasdaq 100 made new highs on the year while the S&P and Nasdaq Composite did not, make me thing the overall market is very exhausted and that a larger decline is warranted before we even think about getting bullish. Not to mention all the momentum extremes reached, and the divergences lasting several days that also lend themselves to the short term bearish case.

So I see the stock market in a near term decline phase that MAY develop into a long term decline phase. But we'll have to wait and let this market unfold further to get a better opinion of the longer term view. One "X factor" is the Health Care vote here in the US. I'm not a fundamental or news guy, but I can't help but think that with the passage of socialized medicine in the US, the global capital of capitalism will not be so capitalist anymore. And that may somehow have a negative effect on our stock market. So perhaps that will add a little fuel to the bears' fire. This isn't my specialized area so this is merely an educated guess.

More tomorrow...


PLEASE NOTE: THIS IS JUST AN ANALYSIS BLOG AND IN NO WAY GUARANTEES OR IMPLIES ANY PROFIT OR GAIN. THE DATA HERE IS MERELY AN EXPRESSED OPINION. TRADE AT YOUR OWN RISK.

Friday, March 19, 2010

Market Fractured, Reverses Impulsively


Yesterday I said 1168 in the S&P was key to the bearish case, and even if it was broken I'd still be looking for a top and reversal after 1170 was broken. Well I didn't account for any inter-market divergence to occur where one index may make a new high while the S&P did not. As you can see from charts above, the Dow and Nasdaq 100 both surged to new highs, however the S&P and Nasdaq Composite did not. All the indices have recently declined in a nice sharp 5 wave pattern. The fact that not all indices made new highs and that the current decline is an impulse move, it suggests the larger trend must be down. The only thing that gives me concern is the very corrective looking decline in the S&P and Composite. They look more like ABC corrections with a wave C occuring this morning for that 5 wave decline. Nothing's perfect and we have to play the probabilities. But I wanted to post an update here because as it stood yesterday, 1168 was key to the bearish case, but seeing that the S&P and Composite couldn't follow the other indices to new highs may mean a top is in. The size and magnitude of that top will be revealed later today or early next week as this market action unfolds. I'd be carefully looking to short this market on any bounce as long as risk was very tolerable on the trade. The action throughout the day and next week will really shine some light on the larger trend.


PLEASE NOTE: THIS IS JUST AN ANALYSIS BLOG AND IN NO WAY GUARANTEES OR IMPLIES ANY PROFIT OR GAIN. THE DATA HERE IS MERELY AN EXPRESSED OPINION. TRADE AT YOUR OWN RISK.

Thursday, March 18, 2010

Stock Market Picture Clearing Up; EUR/USD Looks Bearish

Bearish S&P Cash Count


The market flipped flopped around like a dead fish, AGAIN. But is looking very fractured and out of gas. I've know I've been saying that for several days now, but I have to call it as I see it still. The above count on the 5min chart shows a possible impulsive decline developing. I'm a bit hesitant in getting too excited about this count because the second set of 5 waves down in red look more like a 3 wave drop to me and I had to label wave v a truncation, and today's late day rally has come close to the "rubicon" for the bearish count at 1168. A break above that level will negate this count and put the bullish alternate count as my top count. So risk is clearly defined for the bears, and it's very tight at less than 3 points away.

Another thing to note is the Dow/NYSE indicator I've mentioned a few times many moons ago. In the last downtrend we had from 2007-2009 I noticed that when the Dow Industrials closed positive and the NYSE closed negative, the next day resulted in a big sell off. Well today we had a real divergence in prices between the two with the Dow closing up about 0.4% and the NYSE closing DOWN about 0.4%, and NYSE decliners outnumbered advancers, and down volume was quite a bit larger than up volume. So today was quite a negative day despite the Dow's strong showing. With my bearish count above still intact, we may have started another downtrend, and that means the Dow/NYSE indicator may be back on track for reliability again. We'll see if this divergence between the Dow and NYSE results in a sell off Friday.

With the EUR/USD appearing to have resumed its downtrend, options expiration tomorrow, and the Dow/NYSE divergence in place at the close today, we could be in for some real weakness tomorrow if 1168 can hold.


Bullish S&P Cash Count


On the flip side, there is a bullish alternate count that will become my primary count if 1168 is broken. By breaking above 1168 it will make the drop from 1170 a 3 wave affair and mean that new highs were on the way. I'm not sure I'd want to get long at this point, unless I was looking for a day trade or scalp, but it's a good level for the bears to watch. With 1168 less than 3 points away it brings about a great risk/reward for the bears to get short in hopes of a bigger decline developing. And even if the market surges higher, I'd still be on the lookout for a sharp reversal and opportunity to reshort on that weakness once it makes a new high on the year above 1170.


EUR/USD


As I mentioned earlier this morning, the EUR/USD really broke down today and made a nice 5 wave decline from the highs. The pair struggled to hold gains above 1.3800 twice recently and has now reversed sharply in 5 waves. This failure at 1.3800 has created a double top and the reversal being composed of 5 waves makes this pair highly desirable from the short side on any sizeable rally in my opinion.


PLEASE NOTE: THIS IS JUST AN ANALYSIS BLOG AND IN NO WAY GUARANTEES OR IMPLIES ANY PROFIT OR GAIN. THE DATA HERE IS MERELY AN EXPRESSED OPINION. TRADE AT YOUR OWN RISK.

EUR/USD Declining Impulsively


Just a quick note; the EUR/USD is declining in 5 wave suggesting the trend has turned down again. It's probably a little late to get short now, but I'll be watching the pair for rallies to try and get an opportunity to sell.


PLEASE NOTE: THIS IS JUST AN ANALYSIS BLOG AND IN NO WAY GUARANTEES OR IMPLIES ANY PROFIT OR GAIN. THE DATA HERE IS MERELY AN EXPRESSED OPINION. TRADE AT YOUR OWN RISK.

Wednesday, March 17, 2010

Wave Count is Looking Complete, What's Next?

S&P Cash Index Wave Count


The S&P pushed higher today pushing the Dow to a new yearly high, confirming the rise in the other major indices. This erases any possible intermarket non-confirmation that would have supported the bears if the market were to have turned down while it was in place. The market looks strong when looking at price only, and there's no real signs of that rally derailing at the moment. However the wave count shows that this market might be completing a 5 wave advance from the 1045 area. I'm not in love with this count at all, especially the way wave 1 and 2 are shown and that wave 1 is incredibly small compared to wave 5 which is an extended 5th, but it's the best possible view in my opinion. The market is very overbought on several different levels, and with the wave count finishing up, at least a short term decline is way overdue. That decline will help me determine the larger trend.


S&P 3min Chart


The above chart shows the late day decline counted as a 5 wave drop. This count is not perfect, and it's such a small timeframe, so I don't give it much confidence at the moment. I just wanted to post it as a possibility, and for something to watch as we move into tomorrow's trading. If we get a nice 5 wave drop tomorrow while holding today's highs, then it will really get my attention.


S&P Alternate Bullish Interpretation


This chart is one of the reasons I'm not too confident in the bearish 5 wave drop count I posted just above this one. The late day decline today can also be counted as an ABC affair, which is just a correction, meaning that higher levels are right around the corner.


So what all this stuff mean? Tough to say at this point. It's been extremely disappointing to have several fakeouts to this market crash over the past few months, and we just had another one to add to the pile. But catching a possible decline that's the biggest of the past 100 years will not be easy of course. I was hoping that if we did make new highs this year on this rally, that some indices would lag behind and not make new highs, creating a divergence between indices that often accompany major tops in the market. That didn't happen. All the major indices have confirmed the rise and are looking "strong". So I really don't see anything big time bearish at the present moment. We'd have to look back at the 2007-2009 5 wave decline for the bigger bearish picture. That 5 wave drop is yelling at us elliott wavers that larger trend is still down. The hard part is determining when it will resume that downtrend. Right now I see no evidence of that happening, and I don't want to get my account blown out of the water hanging on too long and getting "faked out" time and time again. I'm not abandoning the bigger bearish picture, I'm just presenting the data to you as I see it. I don't see any evidence of the large decline on the horizon. But maybe that's exactly the contrarian setup we need for the top to actually happen. We'll see. I'm not putting any new money to work though until I get some kind of confirmation of the larger trend.

The bottom line is that I remain neutral until I see more of the structure unfold.


PLEASE NOTE: THIS IS JUST AN ANALYSIS BLOG AND IN NO WAY GUARANTEES OR IMPLIES ANY PROFIT OR GAIN. THE DATA HERE IS MERELY AN EXPRESSED OPINION. TRADE AT YOUR OWN RISK.

Tuesday, March 16, 2010

S&P Continues Higher


Saying that I'm frustrated that the market keeps floating higher despite me saying it's topping the past few days would be an understatement. But the market likes to slap me around from time to time. This rally looks very impressive and strong as far as price goes, but internally it's not the same picture. I've laid out some of those details in previous posts. Today's rally had mediocre sized volume but it was mostly all to the upside with over 81% of NYSE volume going to the upside. Yesterday's failure to gather momentum on that modest drop and then rally into the close was a good sign that we'd get continuation of the rally today. The fact that 81% of the volume today was to the upside may mean we will still push higher. Unfortunately I can't take a position either way right now as I see the market topping anytime but have no confirmation to get short, and I see no evidence to get long at the moment. So even though this has made me miss getting long this rally up to this point, I still have to stick with my trading plan and stay out until I can get a clearer picture of the market.

What might be of interest is that pretty much all of the major indices have made new highs on the year except the Dow Industrials. If the market were to reverse and turn down while this divergence remains in place, it would be very bearish. But the Dow is quite close to making a new high, and if it does so then it will put all the major indices in line for a very healthy rise with no end in sight. So I plan to wait and see how the market reacts in the coming days to see if I can get enough evidence for a bias to take a position.


PLEASE NOTE: THIS IS JUST AN ANALYSIS BLOG AND IN NO WAY GUARANTEES OR IMPLIES ANY PROFIT OR GAIN. THE DATA HERE IS MERELY AN EXPRESSED OPINION. TRADE AT YOUR OWN RISK.
StatCounter