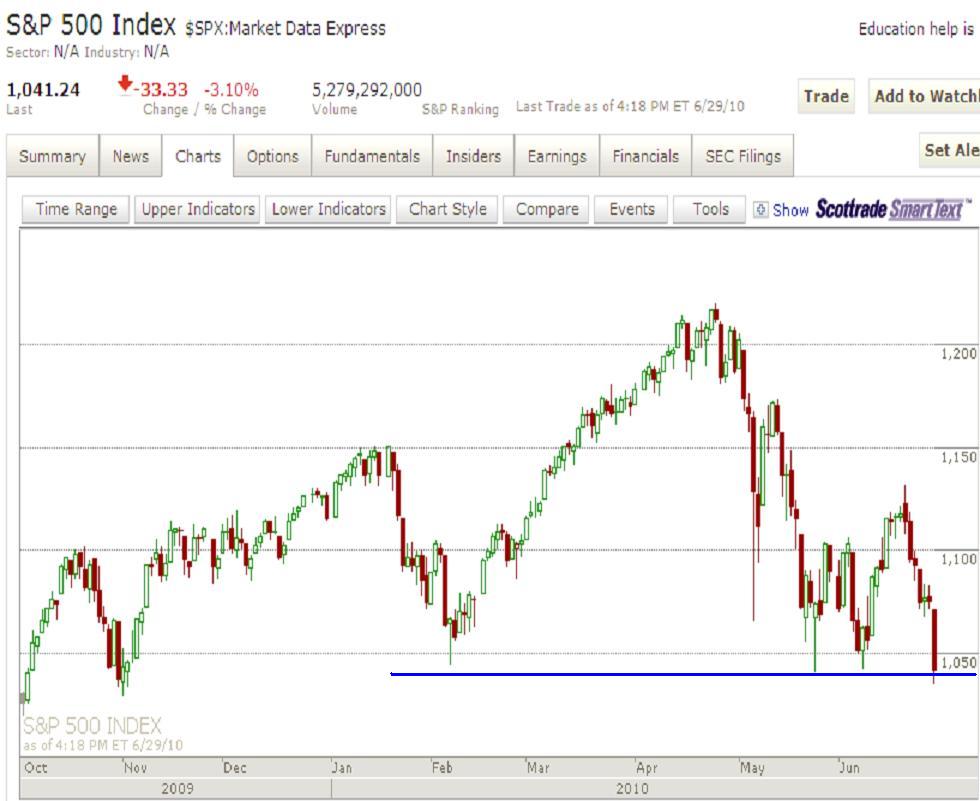
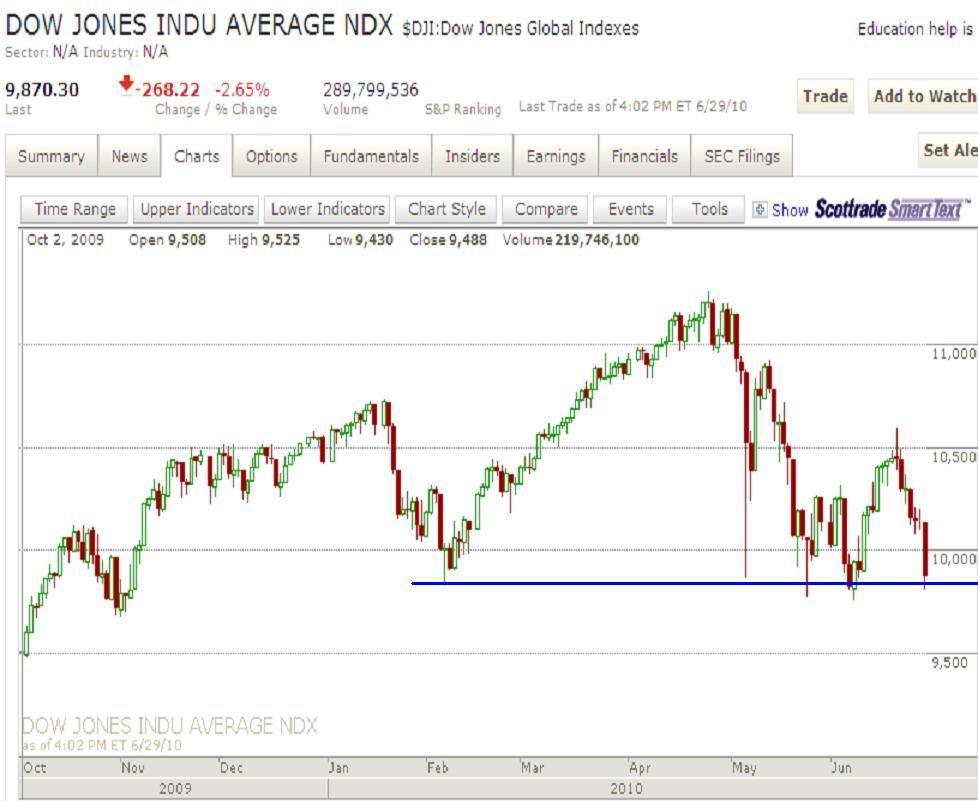
Thursday, July 8, 2010

Wave (ii) Probably Has More to Go; Euro Gearing up for a Decline


The market shot higher this morning at the open only to fall and flatten out during midday trading. Again, this might be chalked up to "Amateur Hour" back in effect where mostly amateurs come in during the first and last 30 minutes or so while the professionals trade during the meat of the day. This behavior didn't do us much good on Tuesday though since it led to a huge monster rally on Wednesday. Outside of the first and last 30 minutes of trading today, the market was quite flat. The late day surge turned the internals of the market quite bullish into the close, suggesting that we still have higher levels ahead of us tomorrow, and probably into next week. Also, there's no real big news data Friday, like most of this week, so the bulls will again be able to blind themselves to the economic decay occurring and just feed off each others' unrelenting optimism to float this market higher again.

One thing to note is that the internals were weaker than yesterday's, although still quite strong today, and volume was also quite light as NYSE volume didn't even reach the 13 day moving average. So the majority of volume spikes above the 13 day moving average still occurred on down days, showing us that the conviction of the market is still on the sell side, for now.

Enthusiasm and optimism have already come back strongly as there are headlines and analysts aready discussing the bottom in the market and talking about the decline being overdone and that earnings and the economy are not that bad. Far different from the "depression" headlines we had over the weekend. It's also the type of sentiment we want to hear as wave (ii) reaches its final stages. But the move higher this week on not so hot volume lends itself to the fact that the overall market is not buying into this rally.


Above is a speculative wave count of the wave (ii) correction. I have it as a comination, or double zig-zag, that should now be in wave 'c' of 'Y'. Wave 'Y' can complete any time now, but will probably get into the meat of the reversal zone before doing so, and if the rally carries into next week then it should get to the upper portion of the zone around 1084. There's also a gap to fill just a few points higher from current levels, so it still would seem that we have higher levels to go.

Another thing to note is the action in the euro that I mentioned this morning. Although the euro and the stock market have not been correlated that well lately, it's still worth noting if you're a currency trader, or for whatever correlation to the stock market that still might be left. The euro is completing what looks like an "ending diagonal" which is a finishing move that is quickly and sharply completely reversed. Although the reversal may only be a short term move, it still may be finishing up a much larger correction which could line up well to wave (ii) in the stock market finishing up if the correlation returns.

So the bottom line remains that I'm firmly bearish below 1131.23, but in the very short term it seems wave (ii) still has higher levels to obtain before the next round of heavy selling to lows gets underway. And there seems to be a good opportunity to start building short positions in the euro (or long the US dollar).


PLEASE NOTE: THIS IS JUST AN ANALYSIS BLOG AND IN NO WAY GUARANTEES OR IMPLIES ANY PROFIT OR GAIN. THE DATA HERE IS MERELY AN EXPRESSED OPINION. TRADE AT YOUR OWN RISK.

Euro Rally Fading Fast, Downward Reversal Imminent


Just a quick note on a good opportunity. I've been easing into a EUR/USD (euro) short position over the past week or so due to the clear 3 wave corrective structure it's formed in what should be a large wave 4. Now you can see an "ending diagonal" like pattern forming now. This is a sign of weakening trend, and that a sharp reversal is coming soon. The only problem is controlling risk since stop losses would be too tight at recent swing highs since this pair can easily just grind slightly higher for a while. The bottom line though is that this pair is about to reverse downward sharply and I want in on it as long as I can manage my risk on the trade appropriately. Also of note, if the EUR/USD is forming a major top and reversal in wave 5 to new lows on the year, it will be tough for the stock market to make any sustained rally. So the key 1131 level in the S&P I mentioned yesterday would seem safe for now if the euro is topping.


PLEASE NOTE: THIS IS JUST AN ANALYSIS BLOG AND IN NO WAY GUARANTEES OR IMPLIES ANY PROFIT OR GAIN. THE DATA HERE IS MERELY AN EXPRESSED OPINION. TRADE AT YOUR OWN RISK.

Wednesday, July 7, 2010

Market is Well Into Wave (ii)


So the market's declining momentum and bullish divergence last week (click here for post) told us the market was gearing up for a snap back rally from it's oversold condition. Yesterday's 5 wave decline fooled me, but I was able to exit around 1043 once the start of that 5 wave decline was breeched today. Today was quite a ferocious rally that was an across the board all bull move. You can see that the internals were very strong with almost only buyers in the market today. There was probably a lot of short covering today as the bears realized the easy pickens on the short side have already been made. With a wave (ii) now underway, I expect to get a minor feel of overall optimism and glee come back into the financial media with talk about great earnings and all the bad stuff already being priced in. Over the weekend there was a feeling of doom and gloom with headlines talking about the second Great Depression. This obviously was around the wave (i) bottom. So when looking for the wave (ii) top, we should get a bit of the opposite in the headlines which should talk up the recovery and "great stock values" again. This should alleviate the oversold condition the market was in just in time for a monstrous wave (iii) of 3 of [3] or C. Although this reversal can happen at any time, and it will be so fast that it will be tough to enter without a good strategy in place, I don't beleive this rally is over quite yet.


So let's start to look for area for a reversal. That way when the market approaches this level, we can anaylze the internals, momentum indicators, and wave structure to see if the market may be rolling over. You can see in the above S&P chart that a good reversal zone is between 1070 and 1084 since that is between the 50% and 62% fibonacci retracement levels of wave (i) down, and there is an open gap there too. So for now, I will expect the market to continue higher into this area where I'd expect to see some resistance and weakening of the uptrend. Any rallies would bring about good opportunities for the bears to get short this market with stops just above the start of wave (i) at 1131.23. And although today's internal strength suggests rallying the rest of the week at a minimum, the fact that we're in a wave 3 of [3] or C means that rallies can be very sharp and short lived. So I'm not falling asleep at the wheel on this one at all.

As long as the market stays below 1131.23, this market is very bearish in my view. However, a break above 1131.23 would be very bad for the bears, and would strongly suggest that we are back in bull mode and that the market will surge to new highs on the year. But I don't want to get ahead of myself since we're far far away from that level. The focus is on resistance in the 1070-1084 area for now, and I'm of the opinion that rallies should be shorted in the short term.


PLEASE NOTE: THIS IS JUST AN ANALYSIS BLOG AND IN NO WAY GUARANTEES OR IMPLIES ANY PROFIT OR GAIN. THE DATA HERE IS MERELY AN EXPRESSED OPINION. TRADE AT YOUR OWN RISK.

Tuesday, July 6, 2010

Larger Trend Remains Down

S&P 500 CASH INDEX COUNT


Friday I expressed caution for the aggressive bears, citing several pieces of evidence showing that the market was oversold, and that downside momentum was waning. This morning we got a big pop leading to a strong triple digit Dow rise with strong internals. However the rally didn't last long as less than an hour into the session the bears came out and pushed the market lower for most of the rest of the day, even at a couple points turning the market negative. So the market did indeed rally as the evidence Friday suggested, but it did so very quickly. This short rally and reversal action time and time again illustrates the struggles the bulls have been having in mounting and sustaining rallies. It also probably speaks to how strong this downtrend probably is.

Building on today's thesis of the larger trend being down, we can see in the above count that today's rally was quite possibly a 4th wave, and that perhaps the 5th wave is now underway since we can see a nice 5 wave decline from today's 1043 high. According to this count, the market will make a new low beneath 1011 before making a new high above 1043.


UNDERSIDE TEST OF KEY 1040 LEVEL, WHICH IS NOW RESISTANCE


Speaking of 1043.....that high today also represents an underside test of the key 1040 level that was important for the bears to take out in order to further confirm that a larger downtrend was underway. Once major key support levels are broken, they will then quickly be re-tested on the underside of that level, which has now become resistance. Today we got that test on the underside of the key 1040 level, and the market reversed sharply in 5 waves after doing so. This is a very bearish sign.


MARKET INTERNALS


Depsite most of the major indices closing positive today, and the Dow mounting a big triple digit rally this morning on strong internals, by the end of the day the internals of the market were mixed-to-flat. The NYSE had more declining stocks than advancing stocks, but had more up volume than down volume. This "mixed" picture is especially odd since the NYSE managed almost a 1% gain today overall. So even the internals of the rallies the bulls do manage to sustain into a close are still done on very anemic internal strength. The bulls' legs are clearly shakey.


INDEX TRACKER


Above is a list of how some indices closed on the day today. You can see that although the majority of indices closed positive today, but the high risk small cap indices were down big today, and the Nasdaq Composite barely eeked out a gain in the final minutes of trading. When taking in all the evidence previously mentioned here, the fact that the high risk indices lagged this rally badly today is more evidence that the bears are still firmly in control and that the larger trend remains down.


AMATEUR NIGHT


I've often heard that the first and last 30 - 60 minutes of trading is done by mostly amateur traders, and the meat of the trading day is done by the professionals. If true, the above 3min chart of today's action tells us a lot. I drew red lines at the halfway point between 30 - 60 minutes at both 45 minutes into trading this morning, and 45 minutes at the end of trading this afternoon. Notice that during those "amateur times" the market rallied hard while during the meat of the day when supposedly the professionals dominate the market, the trend was clearly down. Now most of us know that money is made by following the professionals, not the amateurs, and this chart is telling us that the professionals are selling this market. Also notice that the segment belonging to the professionals traced out a clear 5 wave drop. So the professionals all by themselves are telling us that the market's trend is down. I'm following the pros. 1043 remains the key level for the bears to defend for the immediate bearish case.


EUR/USD


Lastly I wanted to post a EUR/USD chart and count. It appears that the euro is wrapping up a large rally that I believe might be a large 4th wave. This is evident by the apparent 3 wave a-b-c rally that is finishing off wave 'v' of 'c' right now. If correct, the profit potential is enormous since this currency pair should drop over 700 pips before even trying to form a bottom.


PLEASE NOTE: THIS IS JUST AN ANALYSIS BLOG AND IN NO WAY GUARANTEES OR IMPLIES ANY PROFIT OR GAIN. THE DATA HERE IS MERELY AN EXPRESSED OPINION. TRADE AT YOUR OWN RISK.

Downtrend May Be Resuming


My latest posts warning of a snap back rally came to light this morning as the market surged higher to a strong triple-digit Dow gain. But the rally was short lived as the market is well of its highs and has now just declined in five waves just a few minutes ago as you can see from the 5 minute chart above. With a small 3 wave rally completing prior to that 5 wave decline we see now, we should be aware of a resumption of the downtrend.


The 15 minute chart above shows a possible wave count that puts the rally today as a wave 'c' of a three wave rally composing wave 'iv'. The five wave decline seen on the 5 minute chart at the top may signal that wave 'v' down is now underway. Wave 'v' will most likely get below 1011 at a minimum, before it even thinks about bottoming. 1043 remains key for this short term bearish outlook.


PLEASE NOTE: THIS IS JUST AN ANALYSIS BLOG AND IN NO WAY GUARANTEES OR IMPLIES ANY PROFIT OR GAIN. THE DATA HERE IS MERELY AN EXPRESSED OPINION. TRADE AT YOUR OWN RISK.

Monday, July 5, 2010

My Approach

The evidence suggests that a short term bounce may develop early this week. But since we're probably in a wave 3 of [3], that bounce may not occur until hundreds of more Dow points are removed. And although I play the "in-and-out" day and swing trader game in the short term, I do keep focus on the bigger picture for my longer term core positions that I rarely touch. The bigger picture suggests we are in a major downphase of the market that will work prices much much lower in the coming months, and perhaps years. So I feel sticking with the short side, as long as key levels aren't taken out, throughout this phase is a wise choice. If I feel a bounce is coming, I might take some profits on short term positions and look to re-enter on that bounce, but I would not even think about trying to get long, nor will I touch my longer term core short positions. It's also important that if I do play for a bounce, that I set a "sell stop" order beneath the current market price so that I can re-enter the market if I'm wrong about that bounce and the market were to just keep moving lower. Again, I'm only doing this with my short term trading capital as it will allow me to take aggressive positions for big potential gains, and I know that no matter what happens with those short term trades I still have my longer term short positions in that I don't touch. So I just wanted to explain my trading approach to the market as this decline progresses and be clear that I remain longer term short despite moving in and out of the market with other short term trades.

Below are a couple articles that I thought Prechter followers might be interested in:

With the US trapped in depression, this really is starting to feel like 1932

Dow Repeats Great Depression Pattern: Charts


PLEASE NOTE: THIS IS JUST AN ANALYSIS BLOG AND IN NO WAY GUARANTEES OR IMPLIES ANY PROFIT OR GAIN. THE DATA HERE IS MERELY AN EXPRESSED OPINION. TRADE AT YOUR OWN RISK.

Friday, July 2, 2010

Bullish Non-Confirmation in Place


Although I know I'm a fool for trying to call short term bottoms when a big wave 3 is probably underway, but I like to keep profits when I get them. And exiting some or all my positions now is fine when I can simply just add them back on when the S&P makes a new low. The market is oversold on the daily charts and momentum lower has been weakening as discussed yesterday. Now the Dow and S&P have both made 5 wave declines today, but the big problem is that the Dow made a new low and the S&P has not. This again shows a weakening of the downtrend as not all indices are even able to make new lows together. I would be cautious here if I was an aggressive bear, and if anything I would keep that caution on unless the S&P and the Nasdaqs confirm the Dow's new low. If that occurs then I'd simply put my shorts back on. So I'd only be missing a few S&P points of profit to perhaps save myself from a possible huge rally into the close, or early next week. So the risk of missing profits is small and the potential to safe already existing profits is great. Again, if the S&P and Nasdaqs make new lows to confirm the Dow's new low, I'd simply put my short positions back on.

Just a thought.


PLEASE NOTE: THIS IS JUST AN ANALYSIS BLOG AND IN NO WAY GUARANTEES OR IMPLIES ANY PROFIT OR GAIN. THE DATA HERE IS MERELY AN EXPRESSED OPINION. TRADE AT YOUR OWN RISK.

Thursday, July 1, 2010

Short Term Bullish Setup In Play; Precious Metals Broken

S&P IN OVERSOLD TERRITORY


So today we had a nice morning with stocks cascading lower and making the bears even more happier on the week. But when the Dow shot back up to be down only 80 points, and the VIX went from up 8% to flat, despite the heavy selling on the day, it raised a flag with me. Why would the VIX tumble that hard while the Dow was still down 80 points? I smelled a rat, or better yet, I smelled a bull. I've made so much profit so quick on the short side that I wanted to take profits off the table first chance I got. And that little peculiar event with the VIX was all I needed to close my short term short positions at a nice profit.

Internals were negative today, but again they continue to get stronger than the day prior, which has been the trend the past couple days, again signaling that the downtrend is weakening. We also had a nice volume spike today with NYSE volume exceeding the 13 day moving average, so perhaps the bullish reversal today had some strength to it. And still, despite the crazy volatility lately and jobs number coming out tomorrow, the VIX closed down almost 5%. I have a dozen theories as to why this happened, but for a bear who's made a lot of money really quick, I took it as a sign to get on the sideline for now, at least in regards to my short term trades. There is also a bit of other evidence, such as most momentum indicators like the daily RSI showing the market in oversold territory that has marked bottoms in the past. So this decline may be getting a bit extended, and perhaps some bearish caution is warranted.


S&P CASH INDEX COUNTS


Above are my two top counts (click here for yesterday's larger wave count). And although my short term short positions are out, I still have my core long term short positions in. And since we might be in a wave 3 of [3] or C, then oversold indicators are almost meaningless since wave 3s, especially of this size, can go on as long as they want. So I'm giving my top count to the more bearish version on top. This calls for some meandering around sideways type action that stays below 1067.89 for wave 'iv' which will then lead to another sharp decline to new lows for wave 'v'. Although 1067.89 is the max retracement that can happen for this count to remain valid, the S&P will have a very difficult time getting solidly above the previous support shelf level of 1040 it recently broke through. So I'd expect a ton of resistance in that area if the top count is correct.

The second count is immediately bullish, and there's plenty of other evidence to support this as well. The only reason this count is not of equal weighting with the top count is because in a wave 3 at this degree, the larger trend is so strongly down that trying to call a bottom not particularly wise. But I still want to be mindful of it if 1040, and especially 1067.89, is broken soon.


CRYSTAL BALL


Lastly, I wanted to talk about what my crystal ball is telling me. Most of this is just an educated guess on my part, so take it for what it's worth. Tomorrow is another big jobs number. And if anyone has watched or read the financial media this week, everyone is planning for the number to be horrible. Seeing as that the market has already sold off so much going into this number, and everyone is expecting a bad number, I can't imagine a big selloff on the data announcement tomorrow. Anything short of absolute armaggedon in the jobs market will probably lead to a sideways wave 'iv', or a sharper wave '(ii)' rally; both would be supported by the two counts above. But I doubt any big sustained selloff will occur into the long weekend. Plus, many short sellers have made a lot of money this week and won't want to go into a long weekend holding short, so they will use any chance they get to cover their shorts tomorrow to reduce risk into the weekend.

So the bulls seem to have the "theoretical" advantage, along with one wave count and momentum indicators showing oversold levels on their side. But in a wave 3 of this magnitude, anything is possible and the market can just keep tumbling lower. Regardless, the evidence and setup was compelling enough to get me to close my short positions on my short term positions today. We'll see soon enough if that was foolish or not.


S&P VS. the EURO


I know there's been some concern about the affects of a monster euro rally on the stock market since Prechter thought the euro would be in rally mode for a while. For the past several months the euro and the stock market have moved relatively together. So a big euro rally would lead to a big stock market rally, right? As I said a few weeks ago that wouldn't necessarily be true. I was concerned about it, but I wasn't making any trades based on it. As you can see from the two charts above, the S&P and the euro can in fact move opposite each other. The euro rally today I'm sure helped stocks to some degree, but the fact that they still closed down tells you that the euro is NOT the all and powerful determinant in whether stocks rally or fall. This is why R.N. Elliott told us to analyze and count each market independently. Markets remain correlated usually for only certain periods of time. And lately, the euro and the S&P have not been correlated all that well. Speaking of which, did you see the euro rally and compare it to gold's massive selloff today. Again, another reason to analyze a market independently and not rely on a correlations with another market to determine where it is going.


PRECIOUS METALS' UPTREND APPEARS COMPLETELY EXHAUSTED


And lastly, although I hate trading precious metals because they usually kick my butt. I am short silver and today's action in the metals looks extremely bearish in my view. This bearish picture is so compelling that I wanted to post it here. Notice that gold, represented in its ETF (the GLD), has been eeking out new highs with a recent "ending diagonal" pattern at the end while the momentum indicators at the bottom have been making new lows. An ending diagonal is a pattern showing extreme weakness in a market, and they are finishing moves that usually result in sharp reversals. Well that sure happened today with the GLD down 3.8%. Now look at silver's ETF (the SLV) and notice that silver did not confirm the GLD's new highs recently, and then both declined sharply today with the SLV getting the worst of it at a 4.2% decline. This divergence between the two metals, along with the sharp downward reversal, EVEN THOUGH THE EURO RALLIED BIG, tell me that the rally in precious metals the past several months is probably at an end. Look for the metals to move lower in a hurry.


Also, please note that I updated my daily S&P chart count on the right side of this blog.


PLEASE NOTE: THIS IS JUST AN ANALYSIS BLOG AND IN NO WAY GUARANTEES OR IMPLIES ANY PROFIT OR GAIN. THE DATA HERE IS MERELY AN EXPRESSED OPINION. TRADE AT YOUR OWN RISK.

Wednesday, June 30, 2010

Shelves Breaking Down

S&P CASH INDEX WAVE COUNT


The market continues to have a very hard time mounting any significant or sustained rally. This morning I was a bit bummed out because I really would like to have seen some follow-through to yesterday's decline and see the indices take out those shelves I mentioned yesterday once and for all. But this morning the market internals were fairly positive and the market was trying to push higher. However as the day moved on it was clear that the bulls were having a very hard time pushing the market higher. It seems like every inch of gain they made took a lot of effort, only to be completely reversed in less than half the time. I pictured the bulls being like that skinny guy at the gym lifting a big barbell over his head and his legs are shaking violently from all the weight. Eventually the bulls' shakey legs gave way by the end of the day and the major indices broke through their shelves solidly, and closed beneath them. This is a big dagger right through the hearts of the bulls. The short term count from the wave '2' high can be interpreted a few different ways, but with today's continuation to complete what looks like another 5 wave decline, I feel comfortable labeling the count this way for now. The minor nuances of the very short term are a bit irrelevant to me though because we're probably in a wave 3 of [3] or C. And that means heavy selling for a long time.


PUTTING A LARGE WAVE THREE INTO CONTEXT


Once in a while I like to post the above chart for new readers, folks new to EWP, or just for a reminder to long time elliott wavers. The chart shows the absolute price destruction of a wave 3 on a large scale. We are probably in an even larger wave [3] right now, and within that wave [3] we are in another wave 3. So even though the market may seem oversold in the short term, as the above chart shows, wave 3s often ignore technical indicator logic and what might just seem like "common sense" at the time, as they can just keep going and going and going.


INTERNALS


With that said, there are a few things to watch for, merely for mental preparedness, not for trading, in my opinion.

The first one is that the financial media, and even non-economic savvy people I know, are all talking about the "double dip recession". Others are talking widely about the head and shoulders pattern in the market right now. All are signs that there may be just too much pessimism too early for this decline to be the real deal. My arguement to that is that it's a wave 3, so that means many people will know that the bull market hasn't returned and so everyone sells since everyone knows the market is headed lower. This is essentially what wave 3s are made of. Everyone finally giving up and selling. And despite the non-financial savvy people I know talking about the "double dip recession", none of them have pulled the trigger and voluntarily closed any of their long positions to my knowledge. So the bulls are still in the market, and one by one they're being picked off as the market moves lower.

The second issue is that although today's price action was nice for the bears since the bulls could get next to no progress from the market even though internals were so bad yesterday that you'd think everyone out there who wanted to sell already sold, leaving no other direction for the market to go but up. But despite all that, the market barely managed a rally, then rolled over fiercely through many indices' support shelves. Unfortunately this was done on slightly stronger internals than yesterday, and although volume kissed the 13 day moving average on the NYSE today, it was still well below yesterday's volume numbers. So today's decline fits well with a 5th wave within wave 'iii' of '3' as seen in my count above. But with the very weak rallies we've seen since wave '2' ended, I'm not going to make any trade expecting a big bounce anytime soon.

Lastly, with such significant support shelves broken in the major indices and sectors, it's quite possible an attempt will occur to retake those levels soon. If it doesn't happen tomorrow or Friday, it may mean that a retest of the underside of the shelves will occur sometime in the future. But let's not forget these levels because oftentimes when the topsides are broken, they are then later tested on the undersides before continuing lower.


BROKEN SHELVES


Above are updated charts showing the impacts of today's action on the shelves of the major indices and the XLF I showed from yesterday. I added the biggest index of them all, the DJ Wilshire 5000. Since this index is the best representation of the entire stock market, I thought I'd show you that it too has broken down its shelf and appears to be headed much lower. Now it is possible for a false breakdown scenario to occur where we get a day or two below the support shelves only to have it recaptured right after that. But right now the evidence doesn't support that happening so I'm not going to plan on it. I'll deal with it when the market actually does it. And even if it did, the erosion of support at these levels are so broken down by this time that any reversal again downward would be met with very little resistance. So all in all, the market looks to be breaking down and lower levels are ahead of us. The real key level for the bears is quite far away at 1131.23. That level should not be broken if the bears want to remain in good control.


SPEEDBUMPS AHEAD ON THE WAY TO NEXT MAJOR SUPPORT AT 870


Lastly I just wanted to show you that after the market's support shelves have broken down, there's really very little support holding the market up above 870. There is some congestion and "speedbumps" along the way, but the market's next major level to be targeted should be the 870 area of the S&P cash index. If my wavecount is correct, it should get there in a hurry.


PLEASE NOTE: THIS IS JUST AN ANALYSIS BLOG AND IN NO WAY GUARANTEES OR IMPLIES ANY PROFIT OR GAIN. THE DATA HERE IS MERELY AN EXPRESSED OPINION. TRADE AT YOUR OWN RISK.

Tuesday, June 29, 2010

Shelves

WAVE COUNT


So the 4th wave triangle played out with a sharp thrust lower this morning that held into the close. Although it seemed to track well with one of the counts I had yesterday, the fact that the thrust did not reverse upward toward the apex of that triangle is a bit odd. It also lessons the likelihood of the count above being accurate. It's possible the formation I labeled a wave 'iv.' triangle was just a series of 1s and 2s instead. If the market doesn't rally strong tomorrow to take back today's losses and reverse the thrust, then I'll have to relabel the above wave count to somehow fit in a series of 1 and 2 waves in place of the triangle. That would complicate the short term count considerably. So I'm posting this count above tentatively since it's the best one I have right now. Once the market plays out a bit more in the coming days, I should be able to have more confidence in my current count. But regardless of the little nuances of the short term structure, the market action and technicals do suggest the larger trend still remains down. I expect lower levels to be acheived over the coming days/weeks.


MARKET INTERNALS


Today was a bloodbath internally for the market. As you can see, the numbers were extremely bad; so much so that it is not really conducive of a 5th wave thrust that the triangle count I posted yesterday would suggest. A 5th wave should be composed of diverging internal strength and momentum compared to the previous wave 3, however these internals show that it's more parrallel to the previous wave 3 than anything else. So again, my wave count at the top is in question. 89.7% of NYSE stocks closed down on the day, 98.2% of all volume on the NYSE was to the downside, and only 2 stocks in the S&P closed up today. So the bears ruled the day big time today.


INDICES AND SECTORS


Above is a list of the major indices and sectors' closing numbers. I noticed a pattern here of rotation out of higher risk assets and either put into a form of cash as yields suggest, and some into lower risk assets. Notice that the high risk indices like the small caps and technology traded down the biggest, while the safer indices, like the Dow, had less damage done. Also notice that the more speculative sectors like financials and consumer discretionary were down big while safer sectors like utilities and health care were far less damaged. So this wasn't a fluke today. Above average volume came in today and sold everything, and removed risk off the table.

And lastly, we got a nice spike volume as well on this decline which is one of things I wanted to see if in fact we are in a wave 3 of [3] or C. Today's NYSE volume exceeded the 13 day moving average convincingly, and kept the trend alive where rallies are done on lessening volume while declines are done on increasing volume.

So all-in-all, quite a bloodbath today for the bulls.


SHELVES


Today we again flirted with the important support shelves that have been holding this market up for the past few months. We started to break down below these levels near the end of trading today but a sharp rally into the final minutes brought them all to close just about right on their shelves. There have been so many attempts to take out this support that it appears these shelves will be taken out in just a matter of time since each attempt to do so erodes the barrier more and more.

If we are in a wave 3 of [3] or C, I'd like to now see continued price destruction conducive to such a move. Especially now that perhaps we're getting good volume numbers back into the declines. In my humble opinion, the best case scenario for us elliott waver bears is for the market to just blast through these support shelves with another big down day tomorrow that closes on or near the lows of the day. Although the market may appear oversold at that point, it would mean that the wave 3 of [3] count is probably correct, and then the oversold condition everyone sees would be irrelevant as wave 3 at various degrees can remain in extremes for a very long time. So let's see that follow through blast through support tomorrow and finally destroy the bulls will in the short term finally.


PLEASE NOTE: THIS IS JUST AN ANALYSIS BLOG AND IN NO WAY GUARANTEES OR IMPLIES ANY PROFIT OR GAIN. THE DATA HERE IS MERELY AN EXPRESSED OPINION. TRADE AT YOUR OWN RISK.

Bears Firmly in Control This Morning


I called for a triangle yesterday and the result was a sharp thrust lower which is well aligned with one of my counts. The fact that the move was so sharp this morning, and not just a meandering move lower makes me feel more confident in the triangle scenario. It was a nice trade since risk was so tight. The only problem is that if it was a true triangle and thrust lower this morning, then that means today's move is a 5th wave at some degree. But the internals don't necessarily support that because they are extremely weak as you can see in the above screenshot. Normally a wave 5 would diverge a bit from what happened in the previous wave 3, but in this case it seems to be sporting the same characteristics. So it's possible this may be the kick off to a much larger move to the downside.

Regardless, if I put in a short term trade based on the triangle yesterday, then I would at a minimum lower my stop to breakeven now, or perhaps take half profits off the table and move the rest to a stop loss at break even. If it is a triangle and thrust today, then the move will be completely reversed soon, and the S&P will rally back to the apex of the triangle rather quickly. The larger trend would still remain down though. Also, watching CNBC this morning it appears everyone is bearish and talking about a double dip recession. So the news is quite negative, which also may be conducive of a short term low forming.

The word of caution I want to stress here in trying to get too cute with trying to catch bottoms is that we might be in a wave 3 of [3] which means the market can keep going down for a very long time. Exiting too early could cause one to miss a great shorting opportunity. If anything, I'd use the knowledge of a possible rally back to the triangle's apex as mental preparadness in case it happens, so I'd be able to confidently hold onto my larger longer term short positions with more ease.


PLEASE NOTE: THIS IS JUST AN ANALYSIS BLOG AND IN NO WAY GUARANTEES OR IMPLIES ANY PROFIT OR GAIN. THE DATA HERE IS MERELY AN EXPRESSED OPINION. TRADE AT YOUR OWN RISK.

Monday, June 28, 2010

Market Probably Finishing up a Triangle

S&P CASH INDEX DAILY CHART


Above is just a daily S&P cash count to keep focus on the bigger picture. The market should be in a wave 3 of [3] or C. So the market should actually be just getting destroyed day in and day out. That's not happening, but the market is working its way lower and rallies continue to be unenthusiastic, and cannot get any sustained momentum. Today is yet another example of that as the market was positive most of the day, only to get killed in the final minutes of trading to where the major indices closed negative, along with the NYSE internals, yet volume again remains quite light. Although this meandering decline and sideways action is not at all what I'd expect from a wave 3 of 3, it's still possible, and there's no reason to be encouraged by any bullish action as the bulls are almost non-existent lately, and the ones that do show up go home wounded by the end of the day. So the larger trend appears down, with more new lows to come.


POSSIBLE SHORT TERM COUNT


The above chart is a closeup of the action the past few days. It shows us finishing up a 4th wave triangle to where we'll be in a sharp thrust decline that will lead to a quick move below 1067.89 soon. As long as we stay below 1083.56, I have confidence this count is well in play.


S&P ALTERNATE COUNT


Unfortunately, the above triangle is also possible. This triangle has the market in a wave 'b' triangle that will lead to a sharp thrust higher. It should then be the tail end of wave ii of 3 of [3] or C which will then lead to a very sharp decline lower. A break above 1083.56 will put this count up at top choice.

Also, keep in mind that we have several factors coming into play this next couple of weeks that might influence the way the market moves. We have an important jobs number coming out the end of this week, the end of quarter jossling will probably still be occurring, the 4th of July holiday is this weekend, and many people might be going out of town for summer vacations. So things can get a bit wierd in coming days.


PLEASE NOTE: THIS IS JUST AN ANALYSIS BLOG AND IN NO WAY GUARANTEES OR IMPLIES ANY PROFIT OR GAIN. THE DATA HERE IS MERELY AN EXPRESSED OPINION. TRADE AT YOUR OWN RISK.

Possible Triangle Forming


Just wanted to show that a possible triangle is forming and should be at an end, leading to a sharp thrust lower. Above is the triangle illustrated in the Dow. A break above the Wave 'a' high will negate this count. As is, it can bring about a great trading opportunity to get short with a stop just above the wave 'a' high.


PLEASE NOTE: THIS IS JUST AN ANALYSIS BLOG AND IN NO WAY GUARANTEES OR IMPLIES ANY PROFIT OR GAIN. THE DATA HERE IS MERELY AN EXPRESSED OPINION. TRADE AT YOUR OWN RISK.

Friday, June 25, 2010

Market Finished up Wave ii This Afternoon, or Should do so Early Next Week

TOP WAVE COUNT


Above is a 5min chart of the S&P cash index. The failure of the market to selloff sharply by breaking through 1170 led to a rally in the second half of the trading day. This makes me feel that the flat correction count I mentioned yesterday is unfolding. The smaller waves within wave 'c' of ii do not appear complete though, and yet the market got pretty volatile and sold off a bit into the close. So perhaps wave ii is over. In addition, the financials were on fire today, up close to 3%, and despite the bullish reversal this morning and large volume seen today, the indices ended the session mixed-to-flat on the day. This is bearish in my view and would suggest more selling early Monday morning. The bulls just can't get any momentum. And the fact that wave 'c' could not make it above the wave 'a' high, like in most flat corrections, it tells me that there is extreme weakness in the market if it can't even adequately complete its corrective pattern. The problem with this scenario is that if there is extreme weakness in the markets as the wave count suggests, then I'd expect to see noticable divergences between other indices when this happens, and today there weren't any of significance. Also, the XLF looks like it has a few more waves upward to complete its correction as well. So lets look at the even shorter term and get a close up of what we can expect early next week.


CLOSEUP OF THE LAST TWO DAYS OF TRADING


If wave 'c' of ii is over, then wave iii of 3 of [3] or C is underway and should move down in a hurry on Monday according to this setup. If not, then wave 'c' of ii is not over, and the S&P may push up to the 1100-1110 area I previously cited before wave 'c' of ii tops and reverses. The key for the bears remains the 1131 level. As long as that level holds, I'm bearish.


FINANCIALS (XLF)


Above is a chart I thought was interesting since its wave structure looks quite clear. The financials' rally today fits well with a wave iii of c of ii. The current count suggests a little more upside before completing the correction and then reversing much lower. I'm not sure of the larger wave count as the waves in this sector overlap quite a bit on the daily chart. But the short term picture traced out a nice 5 wave decline as shown above, and in accordance with the major indices, it appears the XLF should also be on the verge of a major decline.

So Monday we should see a heavy selloff across the board in a wave iii of 3 of [3] or C, or we might get a push to the 1100-1110 area in the S&P cash index before topping and then selling off sharply.


POSSIBLE INVERSE HEAD AND SHOULDERS PATTERN


Lastly, I just wanted to point out the fact that the market conveniently closed right at the base of what could be the left shoulder of an inverse head and shoulders pattern. So this could mean we'll get a sharp shot upward Monday morning. But as I said earlier, all it would mean is that wave 'c' of ii is continuing into the 1100-1110 range and that it's just the final move of a correction before massive selling commences. Keep in mind that ever since the June 21 top, rally attempts have been hard faught and have failed usually by the end of the day. So a sharp shot higher on Monday may just lead to more of the same. Until the bulls are able to sustain their gains and get real momentum behind their moves, and especially take out 1131, then I'm still firmly bearish.


PLEASE NOTE: THIS IS JUST AN ANALYSIS BLOG AND IN NO WAY GUARANTEES OR IMPLIES ANY PROFIT OR GAIN. THE DATA HERE IS MERELY AN EXPRESSED OPINION. TRADE AT YOUR OWN RISK.

S&P Trying to Get Through 1070. (Notes for the Very Short Term)


The S&P has a minor support shelf at the 1070 level and it's having a hard time breaking through it at the moment. The decline has been far from jaw-dropping as I'd expect from a wave 3 at multiple degrees so I'm cautiously bearish at this point. I just wanted to point out the 1070 level since a break through it should lead to a quick move to the 1040 area. A break through 1040 should lead to an acceleration of aggressive selling well into the 900s. If the S&P fails to break below 1070, the bulls may get emboldened and push the index to the 1100-1110 area to complete the flat correction I mentioned yesterday. But from there, we should get more selling to new lows and 1070 should be nothing more than a speed bump for a market headed much much lower. 1131 remains key for the bears to maintain.


PLEASE NOTE: THIS IS JUST AN ANALYSIS BLOG AND IN NO WAY GUARANTEES OR IMPLIES ANY PROFIT OR GAIN. THE DATA HERE IS MERELY AN EXPRESSED OPINION. TRADE AT YOUR OWN RISK.

StatCounter