Tuesday, August 3, 2010

Market Should be Ending Rally


There was no follow through to the big rally yesterday. Today's internals were quite negative in both the NYSE and S&P as you can see above. Although volume was very low, and well beneath the 13 day moving average. But I too see this as bearish since we did have a huge rally that seems to have surprised a lot of folks and give the "all clear" sign for the market to get back in bull mode I'd expect to see a big spike in volume as the masses rush back into stocks. But volume was also well below the 13 day moving average on yesterday's huge rally, then was even less today. That's not very bullish in my view. And in fact, volume has been declining ever since July 29th, which was the last time the 13 day moving average was breached, and that was a down day. So since then, we've had declining volume, yet the market has worked higher. This is the characteristics that accompany a top. Which I feel is at hand, or very close.


Above is a 2 hour chart of the S&P cash index and RSI momentum indicator. You can see that the evidence of a weak rally is also strong with this data as well. You can see that the rise the past few weeks looks a lot like a wedge, which is typically a weak structure; whether it be part of a wave C ending diagonal or leading diagonal, a sharp and deep reversal should be coming soon. In addition to this wedge structure, the weakness is also illustrated with the fact that price has made two higher highs so far, and yet the RSI has made lower highs, not confirming the rise in price. Again, this suggests that this market is topping and a sharp reversal is coming soon.

Although this evidence is not good as far as timing the market reversal, I'd say that the easy money for the bulls is over, and I think it's time to try and start getting short when opportunities arise.


And lastly, it's quite clear on the daily charts above that the Dow is leading the surge higher while other indices are lagging. And the higher the risk in the index, the further back its lagging. I posted some charts this morning comparing the Dow to the other indices' highs from back in late June. Well also notice that as of today's close, the Nasdaq Composite and Russell 2000 have not even been able to exceed their July 27th highs, with the Nasdaq 100 barely exceeding it. This behavior is bearish as long as it remains in place. When you combine the fact that other indices are lagging the "cream of the crop" Dow index, and that volume in the market is declining, it seems that interest in this rally and the bullish side is fading big time.

Now a big rally on strong volume that brings all these indices above their June highs and gets new highs registered on the RSI will negate all this topping bearish view. But as long as the evidence does remain intact, I view the market as bearish. The small waves of the yesterday and today suggest a possible small 4th wave triangle forming. If correct, we should get one more sharp thrust higher. But thrusts are terminal moves and completely reversed in fast order. And considering the evidence I mentioned above, signs of a "finishing move" like a thrust from a triangle would be a great opportunity for the bears to get short again, in my opinion.

PLEASE NOTE: THIS IS JUST AN ANALYSIS BLOG AND IN NO WAY GUARANTEES OR IMPLIES ANY PROFIT OR GAIN. THE DATA HERE IS MERELY AN EXPRESSED OPINION. TRADE AT YOUR OWN RISK.

Dow Breaking New Ground on its Own


Just a quick midday note since I was unable to put up a post yesterday: The market surged big yesterday, but it was mostly the Dow that made the major headway. If the Nasdaqs were leading the charge higher, I'd be looking more at the bullish side for a larger and longer sustained move to the upside. But the Nasdaqs are in fact lagging the worst of the major indices compared to the Dow. This often means that there is some fear underlying the market as people are only willing to buy up the big blue chip "safe" stocks and avoid the higher risk tech stocks. That's not the behavior I'd expect to see at the beginning of a new bull run. This combined with the fact that the entire rise from the July 2 low is now looking like a wedge, which is a corrective pattern, makes me believe that the market still needs to make new lows on the year. As long as the Nasdaq 100, Nasdaq Composite and S&P 500 stay below their highs, I think the risk:reward potential favors the bears who still have a slight edge in my opinion. If those indices to make new highs, then it would turn me neutral for the short term.

More later after the close.


PLEASE NOTE: THIS IS JUST AN ANALYSIS BLOG AND IN NO WAY GUARANTEES OR IMPLIES ANY PROFIT OR GAIN. THE DATA HERE IS MERELY AN EXPRESSED OPINION. TRADE AT YOUR OWN RISK.

Sunday, August 1, 2010

Big Move Coming


The market is flip flopping all around, confusing even most of the pros out there who seem to recommend "getting smaller" in this market because it's so tough. The VIX is quite low and could signal complacency in the options market which can often mean a major top in the stock market is occurring. The behavior of the market with it's wide directionless swings the past week or so signal that a major move is coming. Seeing as that it's possible we're at the top end of a trading range which is around 1113, the wave count suggests that a wave 3 at various degrees might be getting started, a series of new lows and highs has started on the 15min charts, and that the VIX is at levels of complacency that has marked major stock market tops before, I'm going to give a slight advantage to the bears. This means that this "big move" in the market should be to the downside.

What sticks in my head when I see these charts is the Dow's new high that was not followed by the S&P or Nasdaqs on Thursday, then the Dow's reversal to close beneath the open from the day before. This is a topping reversal pattern. With that in mind I can rest assured that the bearish side should be favored as long as that high in the Dow is maintained at 10,463, no matter what the wave structure might be; the short term should should favor the bears. So I'm short term bearish as long as the Dow trades below 10,463.


But all is not perfect, that's for sure, for the bears. The decline from the 10,463 high is not impulsive looking at all. That doesn't mean the market won't tank hard from here, but it's not a good start for a big decline from an elliott waver's perspective. Also, on the above 15min chart, it looks like the market MIGHT have failed to make new lows with that latest drop then sharp rally. It created what looks like an inverse head and shoulders pattern, which is of course very bullish. But the pattern was not completed as the market failed to close above the neckline and instead reversed into the close. So it's inconclusive, like many other things in this market right now.

Despite the bullish potential, the Dow is not far away from the 10,463 level I just mentioned earlier. I think it's safe to stay bearish with a stop just above that level. A strong shot through that level would negate that topping reversal pattern and therefore severely weaken the short term bearish case. Depending on the strength and structure of that rally I would consider getting long since we might be in a wave 3 at various degrees to the upside. But the rally must be sustained, because another shot higher that's reversed would be even more bearish. At this point, a short term trader needs to be very vigilant and nimble. I can't emphasize that enough right here.

I remain short term bearish as long as the Dow trades below 10,463.


PLEASE NOTE: THIS IS JUST AN ANALYSIS BLOG AND IN NO WAY GUARANTEES OR IMPLIES ANY PROFIT OR GAIN. THE DATA HERE IS MERELY AN EXPRESSED OPINION. TRADE AT YOUR OWN RISK.

Thursday, July 29, 2010

Advantage Bears


There are still various options for the medium/long term but the short term showed its hand a bit today and slanted the probabilities in favor of the bears. I gladly stopped out of my last half of long positioning on this morning's decline. I added a quarter position short right at the close because I thought the Dow's reversal pattern on the daily charts was compelling enough to do so, and the market had rallied solidly off the lows allowing me an opportunity to enter at a good position.

The internals today were only slightly to the downside, however they're finally down instead of always being at least somewhat positive. And again we had a down day where volume exceeded the 13 day moving average, something the bulls have had a hard time doing on their rallies. So not overwhelming bearish at all, but bearish nonetheless.


I don't want to over-analyze or over-write today. I want my charts to do most of the talking.

The above chart is the biggest reason I took a small short position into the close and feel the bears have regained control of the market for the time being. Although it didn't close below yesterday's intraday low (10,463) that I cited earlier today, it did close below yesterday's open. So we had an intraday spike to a new high this morning that was not confirmed by the Nasdaqs or S&P, and then a close solidly beneath yesterday's open. And all on decent volume. That's bearish to me and signals that the bears have taken control of the market at least in the short term.


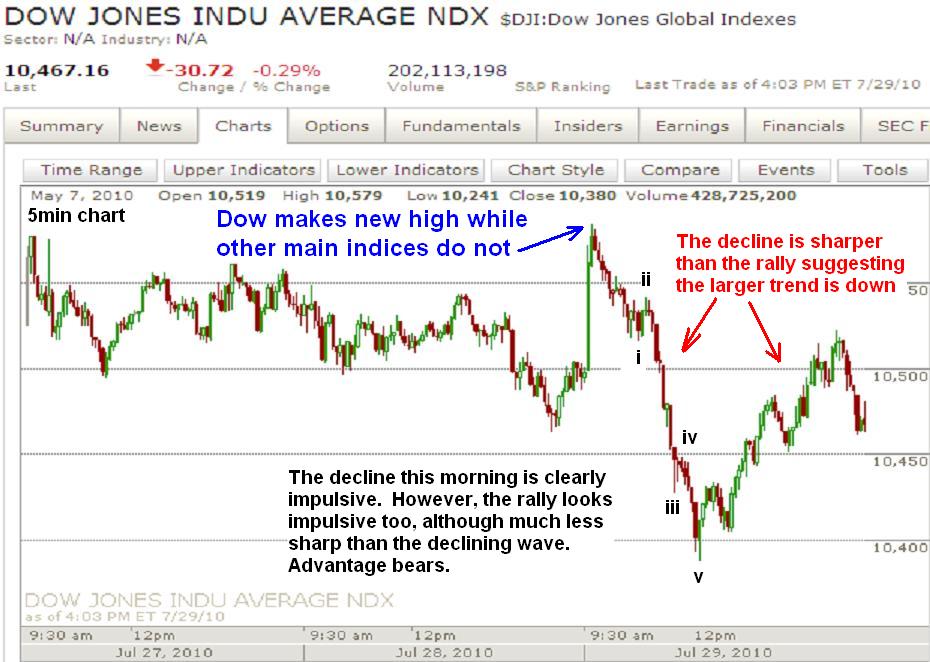
Other pieces of bearish evidence lie in the short term structure as seen in the 5min 3 day chart of the Dow. The decline this morning was clearly impulsive and much sharper than the ensuing rally. And that rally seemed to run out of steam into the close, suggesting it COULD be the start of the next leg down. The only thing that is potentially bullish in this chart is that the rally late in the day appears to be a 5 wave move as well. But the fact that the 5 wave decline was not completely retraced yet, and the declining wave this morning is much stronger and sharper than the late day rally still lend itself to the larger trend being down in my opinion.


Lastly is the less likely bullish potential that I'm adding onto from yesterday's chart. This is supported mainly by the intial decline from Tuesday's high being a corrective looking wave. Now the Dow made a new high so perhaps the Dow is leading the rest of the market as far as wave structure goes, but when looking at the S&P and Nasdaqs, their declines starting from Tuesday's highs look corrective. So it's possible that today's 5 wave decline was just a wave C within a wave iv. If so, the market should continue rallying higher in the coming days/weeks according to the above count. But as long a today's high in the Dow remains intact, I'm bearish.


Lastly, above are some currency charts. The top chart is of the euro which is sporting a potential topping pattern. The bottom chart is of the Australian dollar vs. the US dollar. It shows a nice 5 wave decline and correction that should have ended today. These may be two small hints that a large top is in place, which would mean that a US dollar bottom was in. If so, the dollar could be at the beginning stages of a major rally. Doing so would put a lot of pressure on equities and commodities.


PLEASE NOTE: THIS IS JUST AN ANALYSIS BLOG AND IN NO WAY GUARANTEES OR IMPLIES ANY PROFIT OR GAIN. THE DATA HERE IS MERELY AN EXPRESSED OPINION. TRADE AT YOUR OWN RISK.

Bears Need a Close Today Below 10,463

Just a quick note on what I'm watching into the close. Only the Dow made a new high today which caused a nice intermarket divergence between the Nasdaqs and the S&P since they did not make new highs. Of course this is a big bearish sign, and makes the overall market look toppish. Also of significance is the big reversal after the open that might have the Dow close below yesterday's low at 10,463. If the Dow rallies to a new high today, then reverses to CLOSE beneath yesterday's 10,463 low, it would be a very very very strong signal that a significant top is in at least for quite a few days. If it looks like the Dow will close strongly below 10,463 I will be getting short.

PLEASE NOTE: THIS IS JUST AN ANALYSIS BLOG AND IN NO WAY GUARANTEES OR IMPLIES ANY PROFIT OR GAIN. THE DATA HERE IS MERELY AN EXPRESSED OPINION. TRADE AT YOUR OWN RISK.

Wednesday, July 28, 2010

Regardless of Larger Trend, the Recent Market Rally is Ending


So the market's structure has cleared up a bit, at least in the short term. The larger picture still looks like a choppy mess on the daily charts and I don't have confidence in a solid count.....yet. The short term appears to have two possibilities, both of which could have a quick pop to new highs tomorrow, followed by a large drop for a few days at the least.

The above count is obviously very bullish and should have the market reaching a new high soon, probably tomorrow, before correcting the 5 wave rise we're completing. Seeing as that it may be part of a wave (iii), corrections downward might be quick and shallow. So I'd just use a pullback as an opportunity to get long, instead of trying to outright short this thing. A good bottoming point right now looks to be the 1100 level which is round number psychological support as well as the level just beneath the previous 4th wave, which is where corrections often end. A break below 1088.96 would severely damage the likelihood of this count, and a break below 1056.88 would completely eliminate it. I'll wait to see the structure and strength of the upcoming decline to determine if I will get long, or aggressively short as the count below would suggest I do.


Now this count is slightly less likely at this point because if it's just a 3 wave rise then it must correcting an impulsive decline somewhere. The nearest impulsive decline starts just a few points away from the current high here, so that's very deep of a correction, and therefore it makes this less likely. But as long as the S&P stays below 1131.23, and the Dow and Nasdaqs stay below their equivalent June highs as well, then this count remains on track. A break below 1088.96, especially before yesterday's high is broken, would raise this count's likelihood substantially and hoist it to become my most preferred count.

This count also suggests another pop higher before topping out and perhaps undergoing an absolutely massive decline. The euro and precious metals also appear to be on the verge of major declines as well, so this stock count above fits well with other elements of the market too.

So if you're a bull, I would look to start shorting on any pullback while using extreme caution if 1088.96 is broken, and definitely exiting outright if 1056.88 is broken, in my opinion. If you're a bear, then I'd be looking to aggressively short right now and hold those shorts unless the Nasdaqs, Dow and S&P all break above their June highs, in my opinion. Right now, I still have half my long positions in but will stop out if today's low is broken (1103.11). The behavior of the market tomorrow and/or Friday will help me determine which way I trade this market in the short term.


PLEASE NOTE: THIS IS JUST AN ANALYSIS BLOG AND IN NO WAY GUARANTEES OR IMPLIES ANY PROFIT OR GAIN. THE DATA HERE IS MERELY AN EXPRESSED OPINION. TRADE AT YOUR OWN RISK.

Tuesday, July 27, 2010

Market Struggling; I Closed Half my Long Positions


The market rally is really struggling at this point. The higher risk Nasdaqs are well into negative territory while the Dow struggles just into positive territory. The internals of the NYSE show quite a negative slant as well. This market rally appears to be tiring. Now whether the result is just a flat sideways move for a few days, or a major decline phase, it appears the easy money on the upside has been made. I closed half my long position and have the rest to stop out at almost breakeven just below 1100.


Another sign of upward exhaustion is the comparison in the major indices. The Dow is surging higher while the S&P lags a bit and the Nasdaq Composite (and Nasdaq 100 - not shown) lags even more. This tells me that risk appettite is tepid, and combine that with the weak volume on rallies lately, it tells me the bulls are running out of gas. If the Nasdaqs were leading the pack higher then this would mean nothing. But when the Nasdaqs and higher risk indices lag the rest of the market, I see that as bearish. Precious metals and commodities are tanking too, even though the euro has rallied to new highs overnight and is stable so far this morning.

Also, despite the mixed session so far, the VIX is up over 2%. So there's a bit of caution out there right now which are signs of a potential top. And there is a possible major top that could happen that we don't want to miss out on. So this is something to watch closely.


One bullish potential is the possible inverse head and shoulders pattern in the XLF. It almost broke out above the neckline today to confirm the pattern but hasn't done so yet. A break out here should lead to a big rally in financials. And a big rally in financials would mean a big rally for stocks overall as well.

But the aggregate of evidence right now lies with the bears in that the rally over the past week appears to be at its end.


PLEASE NOTE: THIS IS JUST AN ANALYSIS BLOG AND IN NO WAY GUARANTEES OR IMPLIES ANY PROFIT OR GAIN. THE DATA HERE IS MERELY AN EXPRESSED OPINION. TRADE AT YOUR OWN RISK.
Monday, July 26, 2010

Bullish Above 1100 Unless the Bears Can Close Below 1100 Tuesday

So the bulls did surge the market well above 1100 turning me short term bullish. Right now there are only 3 waves up from the July 1st low, but you do need to start with 3 waves to get to 5 waves. But I'm not sure the market will get there. NYSE total volume has not exceeded the 13 moving average since June 25th. So that's a whole month with subpar volume. And the selloffs over the past few months have been done on big volume spikes. This is concerning for the bulls since they can only rally the market when barely anyone is participating. Rallying on weak volume is typical of bear market rallies, not of new bull runs. The bulls need to show they can rally on big volume, and going over a month without doing so does not instill confidence in the bigger picture bullish case.

The fact that the S&P closed on its highs suggests there might be further upside tomorrow. The S&P needs only 16 points to break the series of lower highs after making a new low that started way back April 26th. Doing so on strong volume would be more evidence for the bullish case. Failing to increase volume would continue to call into question the foundation of the rally altogether.

I'm not posting any charts or counts today because at this point the possibilities are numerous and I have low confidence in all of them right now. It's possible that a large B wave triangle is in the working that started May 25th. This count would be negated on a new high above 1131. It's also possible we're in a large flat correction which would lead to a short burst above 1131 before a massive reversal. It's also possible that a combination correction from the April high is complete, and we're in a 3rd wave to new highs on the year. And on and on and on. There are just too many possibilities will little definitive breaking points or certainty right now. So I'm riding the momentum for now. I'm short term bullish and will stop out at about breakeven just below 1100. If the market can close below 1100 tomorrow, I would not only exit my long position, but I'd enter short as well.

The bottom line is that I'm unsure of what wave count is probable right now but I do see the momentum to the upside as long as we stay above 1100 tomorrow. A close below 1100 tomorrow would get me short term bearish again.


PLEASE NOTE: THIS IS JUST AN ANALYSIS BLOG AND IN NO WAY GUARANTEES OR IMPLIES ANY PROFIT OR GAIN. THE DATA HERE IS MERELY AN EXPRESSED OPINION. TRADE AT YOUR OWN RISK.

Thursday, July 22, 2010

Bears Need to Take out 1065 and 1057

Not much new to add from this morning's post. The bullish potential still remains, but the bulls have not broken above any key levels so the bear stance remains intact, although less likely at this point. The way this market has been see-sawing up and down the past week or so it wouldn't surprise me to see a big down day tomorrow. With that in mind, as a bear I'd like to see the 1065.25 level broken to severely weaken the bullish wave count. A break below 1056.88 would then put the bears back in control in my opinion because at that point the two 5 wave rallies I labeled in this morning's post would create a larger 3 wave rally which would probably be a zig-zag correction. But as long as 1065.25 remains intact, I'd have to slightly favor the bullish case at this point.

One thing to note is that again volume appears light with NYSE volume barely kissing the 13 day moving average. So for the bulls to get me to go long I'd need to see follow-through to the upside tomorrow above 1100 on at least decent volume.

So a break above 1100 on above average volume would get me bullish with the meat of a 3rd of a 3rd wave up possibly underway. A break below 1065.25 would probably get me interested in the short side while a break below 1056.88 would have me aggressively looking for shorting opportunities. Until one of those scenarios occurs soon, I remain neutral in the short term.


PLEASE NOTE: THIS IS JUST AN ANALYSIS BLOG AND IN NO WAY GUARANTEES OR IMPLIES ANY PROFIT OR GAIN. THE DATA HERE IS MERELY AN EXPRESSED OPINION. TRADE AT YOUR OWN RISK.

Market Rallying in 5 Wave Moves, and Declining in 3 Wave Moves


A quick look at the internals this morning show a very strong push behind this rally today. Although it is very early and this can reverse in a blink of an eye, I just wanted to show you what I see. The closing numbers are what really matter.

Normally sharp moves as a reaction to government action has lead to reversals shortly afterward, and since those sharp moves usually have been rallies in the past, I wanted a big rally yesterday off the Fed's testimony so I could short into that rally. Instead we got that sharp selloff that I thought was the kickoff to the next 3rd wave. But instead, it was just a sharp move due to government action that was immediately reversed today. Just the opposite of what usually happens. Oh I love the stock market and how it slaps me around from time to time :)


The market is rallying in 5 waves and declining in 3 waves. So from a basic EWP stance, that means the trend is up. Although it's possible that a zig-zag, or a series of zig-zags are unfolding, the bearish wave count I've been following has become much less likely at this point. Wave 3's, especially at various degrees very rarely will flip flop around and just glide down lower. They almost always are very sharp and decisive moves that are very destructive. I don't see that here.

Above is a 1 hour chart. It's possible to count the decline from the highs in April of this year as a WXY double zig-zag correction, and the 5 wave rallies we've seen from the bottom of wave Y is the kickoff to new highs on the year. This is only a "POSSIBILITY" at this point. I've always been aware of this occurring, but didn't mention it because I thought it was unlikely. But the failure of the big wave [3] or C to break down this market, and the choppy corrective looking decline from the April highs and now the 5 wave moves higher on the table, as an EWP follower I have to see the bullish potential there. Again this is only a POTENTIAL and POSSIBILITY at this point. It's just something to be aware of right now. I might put this back in a locked box underneath my bed again soon if the market reverses sharply and puts wave [3] or C back on track. We'll have to see. But right now I do not have confidence in the immediate and aggressive bearish case. I actually put in some hedges on my put options and covered my short term short positions at the moment but will re-enter on signs of a reversal.


Above is a 15min chart, and it supplements the 1 hour chart above well since both are showing the 5 wave rallies and 3 wave drops I was talking about. From a basic EWP objective standpoint, at this time we have to acknowledge the bullish potential this structure represents.


Above is a possible bullish inverse head and shoulders pattern forming in the S&P on the daily chart. I mentioned this was occurring on the XLF yesterday. Although it's not perfect since the "flash crash" low is quite a bit lower than yesterday's low, but if you chart it on a closing basis it looks much better. So the XLF's inverse head and shoulders pattern now appears to be becoming part of the major indices as well. This also opens the door to a big bullish move in the coming weeks.

Lastly, I wanted to point again that this crazy structure (dubbed "Wolfe Wave" by a subscriber) has once again proved to be a thorn in my side. I warned about it in last Friday's post (click here). It's a sharp downward move probably done by big institutions and then the bulls get scared out of the market and only a small few bears ride that downward momentum the rest of the way, creating a slow choppy grind lower until all the bears have done their damage and don't exist anymore. Then the bulls come in with no more bears left and create a huge pop that sends the market sharply higher. Well the action the this week surely proves again that-that sharp declining structure and grind lower is not bearish at all, and is actually quite bullish.

With all that said, I just want to be clear I'm not abandoning the larger bearish case at all. It's just that I've touted the immediate bearish case for a long time and haven't shown much of the other bullish possibilities. This is mainly because I thought the bullish possibilities had quite low potential. Now the bullish potential has increased significantly so all I want to do is point it out and make us aware of it. I'll post a follow-up to this post and try to get a better foothold of which side should be favored in the days/weeks ahead.


PLEASE NOTE: THIS IS JUST AN ANALYSIS BLOG AND IN NO WAY GUARANTEES OR IMPLIES ANY PROFIT OR GAIN. THE DATA HERE IS MERELY AN EXPRESSED OPINION. TRADE AT YOUR OWN RISK.

Wednesday, July 21, 2010

Market's Flip-Flopping = Bottoming? or A Series of 1 and 2 Waves Before a Crash; Euro Has Good Shorting Opportunity


Strange day today as Ben Bernanke didn't come in and manipulate the short term market behavior like he usually does. I actually wanted that to happen to get a big spike higher so I could add to my shorts in preparation for an imminent reversal. But the market just sold off hard instead. Internals were moderately weak, but nothing to really focus on; volume was average as it kissed the 13 day moving average in the NYSE.

The market appears to be ignoring earnings for the most part and is just focusing on the economy and recovery as a whole. Once the evidence swings in favor of a good recovery then the market swings higher, but when the evidence swings back to favor a weak recovery then the market falls. This up-down behavior is similar to either a series of 1 and 2 waves at various degrees, or a bottoming process. I favor the series of 1 and 2 waves because the market is trading under key moving averages and has broken down various key levels to suggest the trend has turned to the downside.

Plus, the series of 1 and 2 waves makes sense here on the charts and psychologically since the charts obviously show a series of sharp ups and downs lately which is conducive to the behavior and structure of 1 and 2 waves. Also, the fact that the market is trying to get ahold of what the actual status is of the recovery and buying and selling sharply also fits in well with the characteristics of 1 and 2 waves.

But just stepping back and looking at the market itself you can see that the decline is far from creating clear and smooth impulsive patterns. And although it can be labeled with impulsive moves, at face value it looks more like a correction. A sharp and sustained move lower beneath the 1010 level will just about eliminate the potential for a bottoming-type structure taking place here, and it would also fit in well with the wave count that suggests a massively strong and sharp wave 3 at various degrees that should be getting underway any time now. So I'm looking for that sharp decline to confirm the wave count above. It should happen any minute now. The longer it takes to occur, the less likely the count above is correct, in my opinion.

One thing to note: I noticed the XLF (financial ETF) might be forming an inverse head and shoulders pattern. This is a very bullish reversal structure. Today's decline should finish up the pattern which means a sharp rally should occur very soon. I didn't really find any viable patterns in any of the main indices (with the Nasdaq Comp coming the closest), and I'm not sure how much of a market leader the XLF is, so I didn't post a chart. I'm not sure it's significant or even likely. But I did want to mention it for something to watch and if anyone trades the XLF.


EURO/USD


So the topping candlestick pattern I mentioned yesterday has so far paid off with the euro. I called a similar top a week or so ago and it proved to be wrong obviously, so I want to be vigilant in monitoring this short position. It appears that a 5 wave impulse wave is unfolding to the downside from the high and I'm waiting patiently for that to occur. Once it does, I will aggressively add to my short positions on any rallies. It's even possible to count the current structure an impulsive decline as it sits right now, but the proportions aren't desirable so I'm expecting it unfold a bit more to complete a full 5 wave drop from the highs.

As you can see from the daily euro count on the top chart there, if a top is in then we're in for a doozy decline ahead. I originally labeled the wave 2 as a wave 4, but the current rally's extension higher has made it too disproportionate to the corresponding wave 2 to make it likely. So it appears the euro has traced out a completed 5 wave decline already, and that a monstrous wave 3 down is underway. If correct, the profit potential is enormous, with a little less than a 1000 pip profit for the shorts at a bear minimum. But if a wave 3 is underway as the count suggests, then it will fall much much farther than that. This count also lines up well with a major equity selloff as well since a crashing euro might put pressure on stocks too.


PLEASE NOTE: THIS IS JUST AN ANALYSIS BLOG AND IN NO WAY GUARANTEES OR IMPLIES ANY PROFIT OR GAIN. THE DATA HERE IS MERELY AN EXPRESSED OPINION. TRADE AT YOUR OWN RISK.

Stock Market Waiting on Bernanke; Euro Falling

The market is flip-flopping around waiting for the Fed to "save the day" with some new banking package that will dedicate more hard earned tax dollars to allowing rich bankers to continue being ruthless with our money. The 5 wave rally from yesterday is concerning, along with the fact that there has been absolutely no follow-through to Friday's big sell off after almost 2 1/2 days of trading. Again, not the characteristics of what I'd expect from a wave 3 at various degrees. With that 5 wave move in place, I'd love to see a sharp rally after the Fed statement today around 2pm EST. This would be the perfect rally to fade (short) since almost every government intervention plan that has come out in the past couple years that led to a rally has been quickly reversed. And since we have a small 3 wave decline today, a sharp rally after the Fed statement can make the rally from Monday's low a 3 wave zig-zag affair. So I'm hoping for a sharp rally to where I can add to my short positions.


YESTERDAY'S CHART


TODAY'S CHART


The euro has fallen quite a bit since showing signs of a top. This happened last time I tried calling a major top and it proved to only have been a minor top. So we'll see if we get follow-through to the downside which will help us determine at what degree this top actually is. Right now there are only 3 waves down from the high, but that can easily morph into a 5 wave drop. Doing so would strongly suggest that a major top was in and that the euro was probably on its way to new lows on the year.


PLEASE NOTE: THIS IS JUST AN ANALYSIS BLOG AND IN NO WAY GUARANTEES OR IMPLIES ANY PROFIT OR GAIN. THE DATA HERE IS MERELY AN EXPRESSED OPINION. TRADE AT YOUR OWN RISK.

Tuesday, July 20, 2010

Bulls Try to Regain Control


The market's decline this morning and reversal in a smooth methodical manner is not at all what I'd expect to see in a 3rd wave at various degrees. I'd expect to see a sharp and quick rally at best. Internals were sold today with volume just getting above the 13 day moving average so today wasn't really a fluke it appears.


That crappy consolidating pattern after a sharp decline has come to haunt us again as we again get a sharp rally when the choppy gring lower ends (I talked about this in last Friday's post here). The sharp selloff and then complete reversal in a 5 wave rally is concerning for the bears here. So the evidence for the bullish case is building. Although all is not lost for the bears since the bulls have not taken out any key levels and plus it's possible the 5 wave rally is a C wave at some degree, which would explain the strong internals accompanying the move. It may just be a last effort to suck in the rest of the bulls before a big swoosh downward tomorrow or Thursday. If so, the rally from today should be near complete and will lead to a very sharp decline to new lows as long as it doesn't rally above 1100 first.


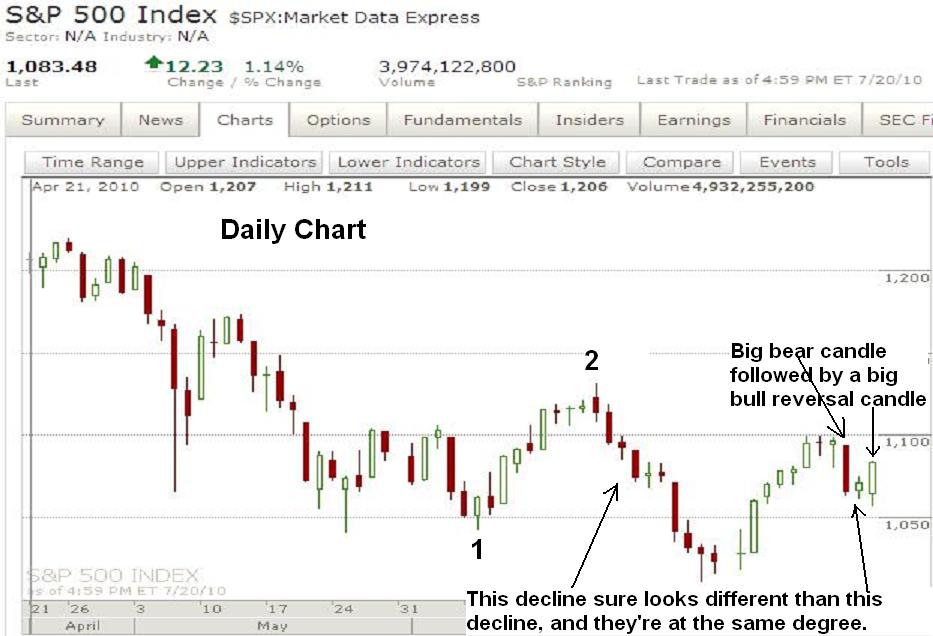
Looking at the daily candlesticks of the S&P the past few days you sure wouldn't expect that a wave (iii) of 3 of [3] or C was underway would you? I mean you have a bunch of green candles and one big red candle, and that red candle was done on a whacky options expiration day no less. Not encouraging for the bears. Also, today's bullish reversal made a nice bullish reversal candlestick that suggests higher levels in the coming days.

But as I stated above, the 5 wave rally could just be part of a C wave correction meaning that today's rally will be completely reversed soon and that today's bullish reversal was just the market's way of suckering the rest of the bulls into this market before it falls hard again this week. So although the evidence on the surface that was left today suggests that the bulls are in control now, it would only take a nice down day tomorrow or Thursday to reverse the bullish implications of today's move.


PLEASE NOTE: THIS IS JUST AN ANALYSIS BLOG AND IN NO WAY GUARANTEES OR IMPLIES ANY PROFIT OR GAIN. THE DATA HERE IS MERELY AN EXPRESSED OPINION. TRADE AT YOUR OWN RISK.

Market Might be Declining Impulsively; Euro May have Topped


The S&P is taking it's sweet time to decline in a wave 3 at various degrees, and although the decline can be counted as an impulse wave, it can only be done so in a very ugly manner. The main problem is the decline from the high which is an obvious 3 wave move. The only way to count the entire decline impulsively in my view, is to count that initial 3 wave drop as part of a flat correction where wave 'b' exceeds the end of wave 'i', then rallies in a wave 'c' to complete wave 'ii'. So far, the decline is a slow sideways down move where I'd expect to see more a sharp and almost straight line down if we were in a wave (iii) of 3 of [3] or C. That can certainly change at any moment, or the decline may just be a "slow bleed" that just continues for weeks. But so far, I'm not impressed with the decline to fit into the current preferred wave count so I'm watching the market carefully to identify any possible turn that might mean new highs ahead. I still remain short term bearish, although I'm "cautiously" short term bearish at least until we see a big swoosh down with real price destruction to equities that a wave at this degree usually brings.

The conlusion I'm getting from the companies already reporting earnings the past week is that they are not doing well on the top line but are doing well on the bottom line. Correct me if I'm wrong, but that tells me that revenues (total sales or gross income) are down and less than expectations meaning that the consumer and economy are not recovering as expected since total sales are down. However companies are still beating earnings expectations on the "bottom line" because they were able to slash operating expenses, which usually means layoffs and closing plants to fatten up profit margins. So through smoke, mirrors, and clever management trimming the fat, they were able to still show profits for their companies' bottom line which is great for the company's shareholders to which executives are ultimately responsible for. However, not meeting revenue expectations and essentially downsizing to meet profit expectations is not good for the overall economy. On a fundamental basis, this is very bearish for the economy as a whole in my view. I welcome any thoughts or differing opinions on this.


EURO


I've been looking for a euro top the past two weeks now and have been wrong a few times in calling one. Once a top is in it should lead to over a 1000 pip move to the downside, so calling a top at this magnitude undoubtedly will be difficult. Today I see another possible top in the currency. The hourly EUR/USD, as shown above, shows a spike higher and then reversal to a new low where it currently sits. A daily close beneath 1.2903 and especially 1.2870 would strongly suggest a major top in the pair has occurred and the short side should be favored in my opinion. Stops can be placed just above today's high.

Although the correlation between the stock market and the euro has not been that strong lately, a 1000+ pip decline in the euro would equate to a massive dollar rally and would create a very steep upward battle for stocks in an already difficult earnings report season.


PLEASE NOTE: THIS IS JUST AN ANALYSIS BLOG AND IN NO WAY GUARANTEES OR IMPLIES ANY PROFIT OR GAIN. THE DATA HERE IS MERELY AN EXPRESSED OPINION. TRADE AT YOUR OWN RISK.

Sunday, July 18, 2010

A Look at the Week Ahead


Friday was a great day for the bears who needed to come back and try to take back control of this market before getting too close to the "breaking point" of a wave (ii) possibility being underway. Although it fell shy of the 78% fibonacci retracement of wave (i), it did fail miserably at at the 1100 level. The market was severely overbought on an intraday basis, and momentum indicators such as the RSI recovered well enough out of oversold territory to now support a large decline. The large decline projected is of course wave (iii) of 3.

Friday's internals were quite bearish as you can see above. Only 8 S&P stocks traded higher and 95% of NYSE volume was on the sell side. Volume was also high, but it was an options expiration day, and in that context volume was fairly light. Again, it appears people are on the beaches and enjoying the summer more than trading the markets. According to CNBC, the last several options expiration days have resulted in down days, with a bit of a hangover the following week as well. This would be welcomed by the bears since the structure of the market Friday is not one I like as a bear. I've noticed that the past few times this structure occurred, it has often led to large snap back rallies that proved the decline to be just a correction. I pointed this out in a brief Friday post how the sharp decline followed by a choppy grind lower defines this structure I'm talking about. The one exception is when the market just accelerates lower with another sharp decline. Interestingly enough, this usually occurs in 3rd waves. So in order for this potentially bullish structure formed on Friday to be negated, I'd like to see a sharp follow-through selloff Monday. If that occurs, I will disregard the bullish potential and look to lower levels.


The short term decline from the 1100 area is far from perfect for an impulsive wave (iii) decline to be underway. But that doesn't mean it's not happening. It's quite early in the wave and lots can happen to help clear things up. The big daily bearish candlestick after failing at the 1100 level and the failure to recapture the 200 day EMA shows that the bears have come back in control. The bulls have failed so far, and now it's the bears' chance to see what they can do. They still have work to do to support a wave (iii) of 3 decline in my view, but right now they hold the reins and the burden is on the bulls to show they still have some fight left to reclaim this market.

If wave (iii) of 3 is in fact underway, I'd expect to see heavy selling this week. And any rallies, although they may be sharp, should be short lived and completely reversed quickly. The market has been flip flopping around for quite a while, all while elliott wavers are counting different levels of wave 3s occurring. At some point, perhaps now, the market should finally give way and tank hard and relentlessly to support these wave counts. Otherwise, we need to remain open to other possible scenarios occurring.

CASH MONEY AND SHINY METALS

My forex and futures charting software is on the fritz right now so I can't post charts, but I did want to comment on precious metals and the euro. Notice Friday that the euro rallied, and went flat, all while the stock market and precious metals fell hard. This divergence may be part of a major topping process as metals and stocks turn lower and the euro soon follows. The euro counts well as a 3 wave rise on the daily charts, but so far has not shown signs of a top. So I'm only currently short the euro 30% of my total desired position, and if there's an open gap up later this afternoon or signs of a top that arise soon, then I'll add to that short position. I also expect especially silver to fall hard along with stocks as well. Judging by the short term behavior in precious metals with the sharp selloffs and in an impulsive looking manner, it appears their uptrends have been broken and lower levels should be achieved soon. With the euro, gold and silver lined up for declines in the the days ahead, and stocks poised for a major fall, it paints a real deadly picture for the financial markets in the coming weeks.


PLEASE NOTE: THIS IS JUST AN ANALYSIS BLOG AND IN NO WAY GUARANTEES OR IMPLIES ANY PROFIT OR GAIN. THE DATA HERE IS MERELY AN EXPRESSED OPINION. TRADE AT YOUR OWN RISK.

StatCounter