Wednesday, August 11, 2010

Barring a Massive Reversal by Close Today, a Significant Top is in


Above is a snapshot of the internals of the market as if 1201 EST, and you can see they're quite dreadful. 86% of NYSE stocks are trading down and only 6 stocks on the S&P are trading higher. In line with the analysis the past few days suggesting a wedge, or diagonal, was at its end it makes sense that we'd see these numbers on the decline today. It also means that the divergences between the indices I've been talking about remain in place and are now much further and harder for the bulls to rally and resolve those divergencse. Advantage bears.


The breakaway gap and accompanying internals suggest this move is a wave 3 at some degree. If so, the market should grind lower in the near future. I previously mentioned that my initial target for the decline after the diagonal was the 1100 area, which was easily taken out this morning. But with the internals so bearish and the technicals suggesting a wave 3 of same degree is underway, I see no reason to cover shorts on short term trades as long as this decline holds into the close today.


YESTERDAY'S EURO CHART


THIS MORNING'S CHART


Well EWP certainly isn't perfect, but when it works, it works very well. Yesterday's call for a strong decline proved accurate as the euro has been absolutely hammered last night into today. I see no reason to not be short this pair.


PLEASE NOTE: THIS IS JUST AN ANALYSIS BLOG AND IN NO WAY GUARANTEES OR IMPLIES ANY PROFIT OR GAIN. THE DATA HERE IS MERELY AN EXPRESSED OPINION. TRADE AT YOUR OWN RISK.

Tuesday, August 10, 2010

Euro Looks to Have Topped; Stocks Should not be Far Behind


The clearest short term structure is in the euro which most likely formed a significant top the past few trading days by breaking through the key 1.3117 level I mentioned yesterday, and doing it with a 5 wave impulsive move. The US dollar is in the same position, only in the opposite direction. Now is a good time to get short the euro, or long the US dollar, in my opinion. Stops could be placed just above last week's high in the euro, or just below last week's low in the dollar. If the euro has topped, it could result in more than a 1000 pip decline and most likely will challenge parity in the coming months. Doing so would put tremendous pressure on commodities and stocks. Bulls beware.


The euro and dollar picture in the short term looks clear, but the stock market's picture is not so clear. This lack of short term clarity suggests that the stock market's top and decline might lag the euro in this respect. The bulls and bears are really fighting it out, like an intense arm wrestling match, shooting this market up and down violently the past few days. But the burden lies with the bulls right now since the market was in rally mode prior to this stalling out the past week. So far, the bulls haven't proven at all that this market should and will go higher in the coming days/weeks.

Today's internals were fairly bearish and volume was still light at just under 1 billion shares traded on the NYSE. But what's of interest is the fact that relative to the past few days' volume which was declining, today we had a strong rise in volume compared to the past week and today it just so happens that it was a down day. So again volume increases on declines and dissipates on rallies.


The divergences between the various indices remains intact and therefore keeps this market extremely bearish and holding a great risk/reward opportunity for the bears. The S&P has still not confirmed the Dow's new high, and the Composite and Russell 2000 indices are lagging far behind. This lagging of the higher risk indices is not a two or even three day affair. It's actually been occurring for almost two weeks now. Risk is fleeing the market and not joining the blue chip Dow on its move to new highs. This is bearish overall. And despite the VIX being at "comfort" levels for some traders on financial TV, the breaking down and divergence of the market as whole tells me the VIX should be more interpreted as a "complacency" guage at this point, not a guage determining how calm the market is. The market is complacent as risk is fleeing the market and volume disappears on rallies and returns on selloffs.

This market is bearish in my view and I'd only be looking to play the short side. It's possible we'll still get a sharp spike to a new high tomorrow, but the upside potential should be limited in time and/or price. A spike higher while these divergences remain in place and the euro stays below last week's high would give the bears a good opportunity to come in short, in my opinion.


PLEASE NOTE: THIS IS JUST AN ANALYSIS BLOG AND IN NO WAY GUARANTEES OR IMPLIES ANY PROFIT OR GAIN. THE DATA HERE IS MERELY AN EXPRESSED OPINION. TRADE AT YOUR OWN RISK.

Five Waves Down in the Euro Suggest a Top


Just a quick headsup that the euro has made a nice sharp impulsive 5 wave decline from its high suggesting a large top is in. The above 1 hour chart tells the story. This could easily result in an over 1000 pip decline in the coming weeks. This of course would put a lot of pressure on stocks and commodities.

With the Fed statement coming out later today, and 5 waves in the euro looking complete, or about complete, it's possible we'll see a large snap back rally to correct that 5 wave decline soon.


PLEASE NOTE: THIS IS JUST AN ANALYSIS BLOG AND IN NO WAY GUARANTEES OR IMPLIES ANY PROFIT OR GAIN. THE DATA HERE IS MERELY AN EXPRESSED OPINION. TRADE AT YOUR OWN RISK.

Monday, August 9, 2010

Markets on Pause Before Fed Announcement Tuesday


The market's volume continues to fall off a cliff for this rally with today's NYSE volume coming in well under 800 million shares. People are on hold until they hear from the Fed tomorrow. The divergences remain in place with the other indices and the wedge pattern on the daily chart I've been talking about suggest the next big sustained move will be to the downside. With the Fed statement tomorrow we may get a sharp rally that will either reverse the same day, or sometime Wednesday. Like I said before, a picture perfect scenario for the bears would be to get a big sharp rally higher that is reversed the same day to close beneath today's intraday low, which was 1121 in the S&P.

But us bears may not be so fortunate with articles such as this one from CNBC's Fast Money touting how Fed days have brought about market rallies: "Since 2008, Fed Days Historically Good For Stocks". Obviously a good contrarian stance at this type of optimism would be that there will be little to no rally tomorrow and that the bears will come in full force right off the bat. We'll see.

In addition, the euro is looking about ready to break down but no confirmation yet. I'd like to see a break, and especially a close beneath 1.3117 to start thinking about getting aggressively short. And a euro breaking down means the US dollar will be starting a major rally, and that will put pressure on commodities as well as stocks.

The bottom line is that the stock market and euro are on the verge of a large decline that should start sometime this week. I feel that at least at this point, the easy money to the upside has been mad. So my focus is looking for shorting opportunities. The action surrounding tomorrow's Fed statement might bring about those opportunities, both in stocks and in the euro and/or dollar.


PLEASE NOTE: THIS IS JUST AN ANALYSIS BLOG AND IN NO WAY GUARANTEES OR IMPLIES ANY PROFIT OR GAIN. THE DATA HERE IS MERELY AN EXPRESSED OPINION. TRADE AT YOUR OWN RISK.

Sunday, August 8, 2010

The Weak Ahead


No, I didn't mispell "Week" in the title of this post. But thanks for fact checking me. IIt's just a play on words since this upcoming "week" looks "weak" for the market. Get it? Okay it was dumb, I know, and I shouldn't have wasted people's time with it. But I'm just a few hours away from beer and baseball time and I'm on summer cruise control right now.

Friday's action looked promising at first, but again volumes didn't enter the market that would suggest a large wave 3, or sustained decline, was starting. The NYSE volume remained beneath the 1 billion shares level. But it was a Friday, and I still thought we could easily just have light volume for that reason, and then Monday we'd get continuation of the decline with higher volume. Wrong. The market again reversed into the close on an impulsive looking rally. So it seems the market might not be quite ready to roll over. But boy is it close.

The sharp selloff and reversal higher is still well in line with the weak diagonal looking pattern that the market has formed since the July 1st low. So the choppy, hard faught, up/down rallying continues. The reversal suggests the market might still grind out at least one more new high. It's not guaranteed by any means, but it looks likely at this point and I want to be mentally prepared for it.

What I'd really like to see to get aggressively short is a sharp rally that will act as a vacuum that sucks up all the remaining hesitant bulls into this rally from July 1st. A sharp move higher, preferably above the upper ascending trendline I have shown in the above chart, and then reversal the same day would be the perfect scenario to call a top and rush into the short side in my opinion. If that happens, it could easily happen very early this week. A rally to a new daily high, and then reversal and close to beneath the prior day's intraday low would be a picture perfect scenario to get short into that close. But regardless, the market's upside looks quite limited at this point, and the easy money to the upside has probably already been made, while the downside potential is quite large so that's where my focus is.

The divergences between other indices remains in place. (click here for the post on this topic).

Okay, I gotta get ready for Miller Time and the Red Sox vs Yankee game tonight. Hope you all are enjoying your summer!


PLEASE NOTE: THIS IS JUST AN ANALYSIS BLOG AND IN NO WAY GUARANTEES OR IMPLIES ANY PROFIT OR GAIN. THE DATA HERE IS MERELY AN EXPRESSED OPINION. TRADE AT YOUR OWN RISK.

Thursday, August 5, 2010

Volume has Fallen off a Cliff; Waiting for Jobs Number Friday


Volume continues to fall off a cliff as today's NYSE volume was well under 900 million shares. The market should give way soon to a sharp drop to at least the 1100 level in the S&P, but possibly much lower. It seems that folks are waiting for the big jobs number coming out tomorrow. So after the number is released, the market's volume should return a little bit and get this market moving in line with the larger trend. I feel that the rally over the past few weeks is at its ending stages and will roll over at any time. A sharp rally based on the jobs number tomorrow would be a great opportunity to get short as long as all the other indices listed below remain below their June highs. The flat sideways action the past couple days suggests this is a 4th wave we're in and so a final sharp 5th wave rally before reversing violently may be in order. It doesn't have to shoot higher, and the S&P futures chart below is evidence of that. But tomorrow's jobs number has good prospects of giving us solid ground action to help us going forward.


The S&P futures made a nice 5 wave decline and a correction that is about at the maximum comfort level for a retracement at the 78% fibonacci level. So as long as the overnight high here remains in place, it's possible a top is already in and major selling is on the horizon.


Again, the various indices are quite fractured, with the Russell 2000 and Nasdaq Composite now lagging drastically compared to the Dow. Although the market hasn't tanked hard yet after such a pronounced divergence between indices, the fact that they've remained divergent for so long is still quite bearish in my view.

I remain bearish in the short term as I aggressively look for a top and reversal that should take the S&P down to at least the 1100 level in a hurry.


PLEASE NOTE: THIS IS JUST AN ANALYSIS BLOG AND IN NO WAY GUARANTEES OR IMPLIES ANY PROFIT OR GAIN. THE DATA HERE IS MERELY AN EXPRESSED OPINION. TRADE AT YOUR OWN RISK.

Wednesday, August 4, 2010

Not Much Changed From Yesterday; Market Still on Verge of Reversing


The market didn't do much today so nothing has really changed in the outlook from yesterday. The Nasdaq Composite and Russell 2000 still have not made any new highs to confirm those in the NDX, Dow and S&P. As long as those divergences remain in place, the bearish potential is great.

Above is a better illustration of the wedge formation I mentioned yesterday. In EWP, they usually are "leading diagonals" or "ending diagonals". Both are weak structures and the ending diagonal is a finishing move, which can form a wave C which might fight nicely here, and result in sharp reversals. Whether or not this particular wedge falls right into perfect EWP form or not, the structure of the rally in this manner is a weak one, and it's exhibited in several intraday momentum indicators. When the market does finally pull back, I expect the S&P to get to at least the 1100 level in quite a hurry. And with volatility so low right now, I put a very small short term put option position that I will either cash out on a sharp decline and VIX spike, or will just let it run out and expire worthless.


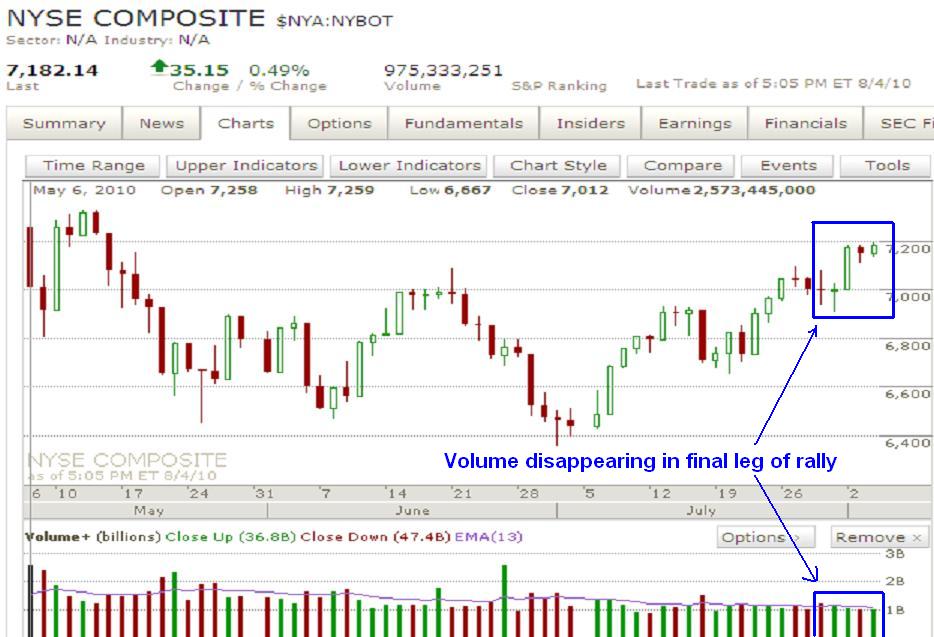
Above is a daily volume chart of the NYSE Composite. Today's internals on the NYSE were quite strong however volume was so light, less than 1 billion, that I'm not sure how reliable that strength was. You can see above that after that July 29th down day and volume spike above the 13 day moving average, the market has gone to new highs but volume continues to fall further and further away from the 13 day moving average. So this latest rally leg higher in the S&P since July 29th is quite shallow in strength and conviction and so I feel it will be completely reversed rather quickly.

Friday is the all important jobs number so perhaps traders will just wait until late Thursday and Friday morning to take bigger positions and get some volume back in this market. A short pop higher might occur before a top is in, but the evidence suggests a sharp move to the downside coming soon that should quickly test the 1100 level in the S&P.


PLEASE NOTE: THIS IS JUST AN ANALYSIS BLOG AND IN NO WAY GUARANTEES OR IMPLIES ANY PROFIT OR GAIN. THE DATA HERE IS MERELY AN EXPRESSED OPINION. TRADE AT YOUR OWN RISK.

Tuesday, August 3, 2010

Market Should be Ending Rally


There was no follow through to the big rally yesterday. Today's internals were quite negative in both the NYSE and S&P as you can see above. Although volume was very low, and well beneath the 13 day moving average. But I too see this as bearish since we did have a huge rally that seems to have surprised a lot of folks and give the "all clear" sign for the market to get back in bull mode I'd expect to see a big spike in volume as the masses rush back into stocks. But volume was also well below the 13 day moving average on yesterday's huge rally, then was even less today. That's not very bullish in my view. And in fact, volume has been declining ever since July 29th, which was the last time the 13 day moving average was breached, and that was a down day. So since then, we've had declining volume, yet the market has worked higher. This is the characteristics that accompany a top. Which I feel is at hand, or very close.


Above is a 2 hour chart of the S&P cash index and RSI momentum indicator. You can see that the evidence of a weak rally is also strong with this data as well. You can see that the rise the past few weeks looks a lot like a wedge, which is typically a weak structure; whether it be part of a wave C ending diagonal or leading diagonal, a sharp and deep reversal should be coming soon. In addition to this wedge structure, the weakness is also illustrated with the fact that price has made two higher highs so far, and yet the RSI has made lower highs, not confirming the rise in price. Again, this suggests that this market is topping and a sharp reversal is coming soon.

Although this evidence is not good as far as timing the market reversal, I'd say that the easy money for the bulls is over, and I think it's time to try and start getting short when opportunities arise.


And lastly, it's quite clear on the daily charts above that the Dow is leading the surge higher while other indices are lagging. And the higher the risk in the index, the further back its lagging. I posted some charts this morning comparing the Dow to the other indices' highs from back in late June. Well also notice that as of today's close, the Nasdaq Composite and Russell 2000 have not even been able to exceed their July 27th highs, with the Nasdaq 100 barely exceeding it. This behavior is bearish as long as it remains in place. When you combine the fact that other indices are lagging the "cream of the crop" Dow index, and that volume in the market is declining, it seems that interest in this rally and the bullish side is fading big time.

Now a big rally on strong volume that brings all these indices above their June highs and gets new highs registered on the RSI will negate all this topping bearish view. But as long as the evidence does remain intact, I view the market as bearish. The small waves of the yesterday and today suggest a possible small 4th wave triangle forming. If correct, we should get one more sharp thrust higher. But thrusts are terminal moves and completely reversed in fast order. And considering the evidence I mentioned above, signs of a "finishing move" like a thrust from a triangle would be a great opportunity for the bears to get short again, in my opinion.

PLEASE NOTE: THIS IS JUST AN ANALYSIS BLOG AND IN NO WAY GUARANTEES OR IMPLIES ANY PROFIT OR GAIN. THE DATA HERE IS MERELY AN EXPRESSED OPINION. TRADE AT YOUR OWN RISK.

Dow Breaking New Ground on its Own


Just a quick midday note since I was unable to put up a post yesterday: The market surged big yesterday, but it was mostly the Dow that made the major headway. If the Nasdaqs were leading the charge higher, I'd be looking more at the bullish side for a larger and longer sustained move to the upside. But the Nasdaqs are in fact lagging the worst of the major indices compared to the Dow. This often means that there is some fear underlying the market as people are only willing to buy up the big blue chip "safe" stocks and avoid the higher risk tech stocks. That's not the behavior I'd expect to see at the beginning of a new bull run. This combined with the fact that the entire rise from the July 2 low is now looking like a wedge, which is a corrective pattern, makes me believe that the market still needs to make new lows on the year. As long as the Nasdaq 100, Nasdaq Composite and S&P 500 stay below their highs, I think the risk:reward potential favors the bears who still have a slight edge in my opinion. If those indices to make new highs, then it would turn me neutral for the short term.

More later after the close.


PLEASE NOTE: THIS IS JUST AN ANALYSIS BLOG AND IN NO WAY GUARANTEES OR IMPLIES ANY PROFIT OR GAIN. THE DATA HERE IS MERELY AN EXPRESSED OPINION. TRADE AT YOUR OWN RISK.

Sunday, August 1, 2010

Big Move Coming


The market is flip flopping all around, confusing even most of the pros out there who seem to recommend "getting smaller" in this market because it's so tough. The VIX is quite low and could signal complacency in the options market which can often mean a major top in the stock market is occurring. The behavior of the market with it's wide directionless swings the past week or so signal that a major move is coming. Seeing as that it's possible we're at the top end of a trading range which is around 1113, the wave count suggests that a wave 3 at various degrees might be getting started, a series of new lows and highs has started on the 15min charts, and that the VIX is at levels of complacency that has marked major stock market tops before, I'm going to give a slight advantage to the bears. This means that this "big move" in the market should be to the downside.

What sticks in my head when I see these charts is the Dow's new high that was not followed by the S&P or Nasdaqs on Thursday, then the Dow's reversal to close beneath the open from the day before. This is a topping reversal pattern. With that in mind I can rest assured that the bearish side should be favored as long as that high in the Dow is maintained at 10,463, no matter what the wave structure might be; the short term should should favor the bears. So I'm short term bearish as long as the Dow trades below 10,463.


But all is not perfect, that's for sure, for the bears. The decline from the 10,463 high is not impulsive looking at all. That doesn't mean the market won't tank hard from here, but it's not a good start for a big decline from an elliott waver's perspective. Also, on the above 15min chart, it looks like the market MIGHT have failed to make new lows with that latest drop then sharp rally. It created what looks like an inverse head and shoulders pattern, which is of course very bullish. But the pattern was not completed as the market failed to close above the neckline and instead reversed into the close. So it's inconclusive, like many other things in this market right now.

Despite the bullish potential, the Dow is not far away from the 10,463 level I just mentioned earlier. I think it's safe to stay bearish with a stop just above that level. A strong shot through that level would negate that topping reversal pattern and therefore severely weaken the short term bearish case. Depending on the strength and structure of that rally I would consider getting long since we might be in a wave 3 at various degrees to the upside. But the rally must be sustained, because another shot higher that's reversed would be even more bearish. At this point, a short term trader needs to be very vigilant and nimble. I can't emphasize that enough right here.

I remain short term bearish as long as the Dow trades below 10,463.


PLEASE NOTE: THIS IS JUST AN ANALYSIS BLOG AND IN NO WAY GUARANTEES OR IMPLIES ANY PROFIT OR GAIN. THE DATA HERE IS MERELY AN EXPRESSED OPINION. TRADE AT YOUR OWN RISK.

Thursday, July 29, 2010

Advantage Bears


There are still various options for the medium/long term but the short term showed its hand a bit today and slanted the probabilities in favor of the bears. I gladly stopped out of my last half of long positioning on this morning's decline. I added a quarter position short right at the close because I thought the Dow's reversal pattern on the daily charts was compelling enough to do so, and the market had rallied solidly off the lows allowing me an opportunity to enter at a good position.

The internals today were only slightly to the downside, however they're finally down instead of always being at least somewhat positive. And again we had a down day where volume exceeded the 13 day moving average, something the bulls have had a hard time doing on their rallies. So not overwhelming bearish at all, but bearish nonetheless.


I don't want to over-analyze or over-write today. I want my charts to do most of the talking.

The above chart is the biggest reason I took a small short position into the close and feel the bears have regained control of the market for the time being. Although it didn't close below yesterday's intraday low (10,463) that I cited earlier today, it did close below yesterday's open. So we had an intraday spike to a new high this morning that was not confirmed by the Nasdaqs or S&P, and then a close solidly beneath yesterday's open. And all on decent volume. That's bearish to me and signals that the bears have taken control of the market at least in the short term.


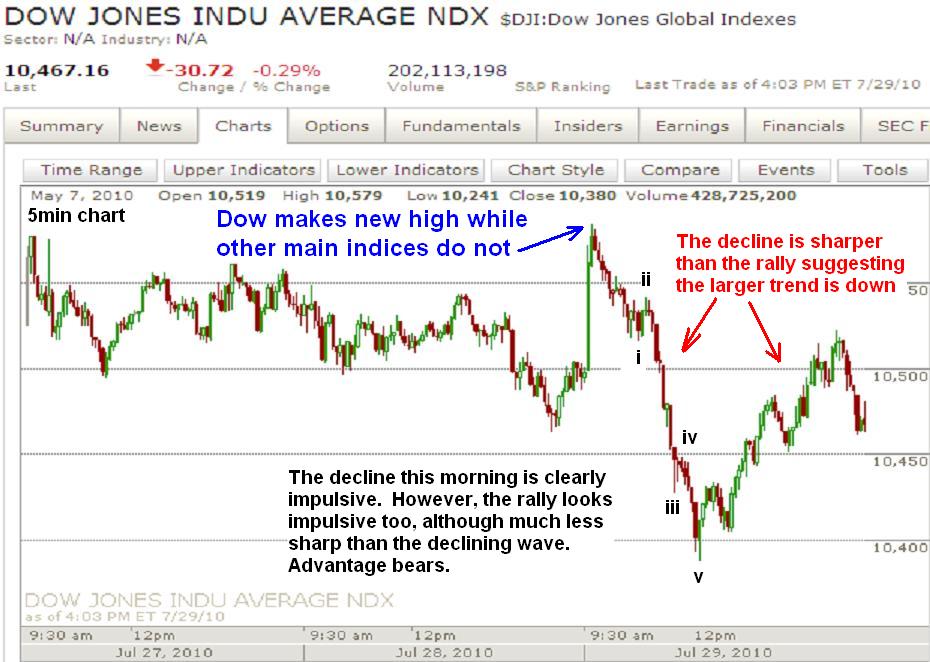
Other pieces of bearish evidence lie in the short term structure as seen in the 5min 3 day chart of the Dow. The decline this morning was clearly impulsive and much sharper than the ensuing rally. And that rally seemed to run out of steam into the close, suggesting it COULD be the start of the next leg down. The only thing that is potentially bullish in this chart is that the rally late in the day appears to be a 5 wave move as well. But the fact that the 5 wave decline was not completely retraced yet, and the declining wave this morning is much stronger and sharper than the late day rally still lend itself to the larger trend being down in my opinion.


Lastly is the less likely bullish potential that I'm adding onto from yesterday's chart. This is supported mainly by the intial decline from Tuesday's high being a corrective looking wave. Now the Dow made a new high so perhaps the Dow is leading the rest of the market as far as wave structure goes, but when looking at the S&P and Nasdaqs, their declines starting from Tuesday's highs look corrective. So it's possible that today's 5 wave decline was just a wave C within a wave iv. If so, the market should continue rallying higher in the coming days/weeks according to the above count. But as long a today's high in the Dow remains intact, I'm bearish.


Lastly, above are some currency charts. The top chart is of the euro which is sporting a potential topping pattern. The bottom chart is of the Australian dollar vs. the US dollar. It shows a nice 5 wave decline and correction that should have ended today. These may be two small hints that a large top is in place, which would mean that a US dollar bottom was in. If so, the dollar could be at the beginning stages of a major rally. Doing so would put a lot of pressure on equities and commodities.


PLEASE NOTE: THIS IS JUST AN ANALYSIS BLOG AND IN NO WAY GUARANTEES OR IMPLIES ANY PROFIT OR GAIN. THE DATA HERE IS MERELY AN EXPRESSED OPINION. TRADE AT YOUR OWN RISK.

Bears Need a Close Today Below 10,463

Just a quick note on what I'm watching into the close. Only the Dow made a new high today which caused a nice intermarket divergence between the Nasdaqs and the S&P since they did not make new highs. Of course this is a big bearish sign, and makes the overall market look toppish. Also of significance is the big reversal after the open that might have the Dow close below yesterday's low at 10,463. If the Dow rallies to a new high today, then reverses to CLOSE beneath yesterday's 10,463 low, it would be a very very very strong signal that a significant top is in at least for quite a few days. If it looks like the Dow will close strongly below 10,463 I will be getting short.

PLEASE NOTE: THIS IS JUST AN ANALYSIS BLOG AND IN NO WAY GUARANTEES OR IMPLIES ANY PROFIT OR GAIN. THE DATA HERE IS MERELY AN EXPRESSED OPINION. TRADE AT YOUR OWN RISK.

Wednesday, July 28, 2010

Regardless of Larger Trend, the Recent Market Rally is Ending


So the market's structure has cleared up a bit, at least in the short term. The larger picture still looks like a choppy mess on the daily charts and I don't have confidence in a solid count.....yet. The short term appears to have two possibilities, both of which could have a quick pop to new highs tomorrow, followed by a large drop for a few days at the least.

The above count is obviously very bullish and should have the market reaching a new high soon, probably tomorrow, before correcting the 5 wave rise we're completing. Seeing as that it may be part of a wave (iii), corrections downward might be quick and shallow. So I'd just use a pullback as an opportunity to get long, instead of trying to outright short this thing. A good bottoming point right now looks to be the 1100 level which is round number psychological support as well as the level just beneath the previous 4th wave, which is where corrections often end. A break below 1088.96 would severely damage the likelihood of this count, and a break below 1056.88 would completely eliminate it. I'll wait to see the structure and strength of the upcoming decline to determine if I will get long, or aggressively short as the count below would suggest I do.


Now this count is slightly less likely at this point because if it's just a 3 wave rise then it must correcting an impulsive decline somewhere. The nearest impulsive decline starts just a few points away from the current high here, so that's very deep of a correction, and therefore it makes this less likely. But as long as the S&P stays below 1131.23, and the Dow and Nasdaqs stay below their equivalent June highs as well, then this count remains on track. A break below 1088.96, especially before yesterday's high is broken, would raise this count's likelihood substantially and hoist it to become my most preferred count.

This count also suggests another pop higher before topping out and perhaps undergoing an absolutely massive decline. The euro and precious metals also appear to be on the verge of major declines as well, so this stock count above fits well with other elements of the market too.

So if you're a bull, I would look to start shorting on any pullback while using extreme caution if 1088.96 is broken, and definitely exiting outright if 1056.88 is broken, in my opinion. If you're a bear, then I'd be looking to aggressively short right now and hold those shorts unless the Nasdaqs, Dow and S&P all break above their June highs, in my opinion. Right now, I still have half my long positions in but will stop out if today's low is broken (1103.11). The behavior of the market tomorrow and/or Friday will help me determine which way I trade this market in the short term.


PLEASE NOTE: THIS IS JUST AN ANALYSIS BLOG AND IN NO WAY GUARANTEES OR IMPLIES ANY PROFIT OR GAIN. THE DATA HERE IS MERELY AN EXPRESSED OPINION. TRADE AT YOUR OWN RISK.

Tuesday, July 27, 2010

Market Struggling; I Closed Half my Long Positions


The market rally is really struggling at this point. The higher risk Nasdaqs are well into negative territory while the Dow struggles just into positive territory. The internals of the NYSE show quite a negative slant as well. This market rally appears to be tiring. Now whether the result is just a flat sideways move for a few days, or a major decline phase, it appears the easy money on the upside has been made. I closed half my long position and have the rest to stop out at almost breakeven just below 1100.


Another sign of upward exhaustion is the comparison in the major indices. The Dow is surging higher while the S&P lags a bit and the Nasdaq Composite (and Nasdaq 100 - not shown) lags even more. This tells me that risk appettite is tepid, and combine that with the weak volume on rallies lately, it tells me the bulls are running out of gas. If the Nasdaqs were leading the pack higher then this would mean nothing. But when the Nasdaqs and higher risk indices lag the rest of the market, I see that as bearish. Precious metals and commodities are tanking too, even though the euro has rallied to new highs overnight and is stable so far this morning.

Also, despite the mixed session so far, the VIX is up over 2%. So there's a bit of caution out there right now which are signs of a potential top. And there is a possible major top that could happen that we don't want to miss out on. So this is something to watch closely.


One bullish potential is the possible inverse head and shoulders pattern in the XLF. It almost broke out above the neckline today to confirm the pattern but hasn't done so yet. A break out here should lead to a big rally in financials. And a big rally in financials would mean a big rally for stocks overall as well.

But the aggregate of evidence right now lies with the bears in that the rally over the past week appears to be at its end.


PLEASE NOTE: THIS IS JUST AN ANALYSIS BLOG AND IN NO WAY GUARANTEES OR IMPLIES ANY PROFIT OR GAIN. THE DATA HERE IS MERELY AN EXPRESSED OPINION. TRADE AT YOUR OWN RISK.

Monday, July 26, 2010

Bullish Above 1100 Unless the Bears Can Close Below 1100 Tuesday

So the bulls did surge the market well above 1100 turning me short term bullish. Right now there are only 3 waves up from the July 1st low, but you do need to start with 3 waves to get to 5 waves. But I'm not sure the market will get there. NYSE total volume has not exceeded the 13 moving average since June 25th. So that's a whole month with subpar volume. And the selloffs over the past few months have been done on big volume spikes. This is concerning for the bulls since they can only rally the market when barely anyone is participating. Rallying on weak volume is typical of bear market rallies, not of new bull runs. The bulls need to show they can rally on big volume, and going over a month without doing so does not instill confidence in the bigger picture bullish case.

The fact that the S&P closed on its highs suggests there might be further upside tomorrow. The S&P needs only 16 points to break the series of lower highs after making a new low that started way back April 26th. Doing so on strong volume would be more evidence for the bullish case. Failing to increase volume would continue to call into question the foundation of the rally altogether.

I'm not posting any charts or counts today because at this point the possibilities are numerous and I have low confidence in all of them right now. It's possible that a large B wave triangle is in the working that started May 25th. This count would be negated on a new high above 1131. It's also possible we're in a large flat correction which would lead to a short burst above 1131 before a massive reversal. It's also possible that a combination correction from the April high is complete, and we're in a 3rd wave to new highs on the year. And on and on and on. There are just too many possibilities will little definitive breaking points or certainty right now. So I'm riding the momentum for now. I'm short term bullish and will stop out at about breakeven just below 1100. If the market can close below 1100 tomorrow, I would not only exit my long position, but I'd enter short as well.

The bottom line is that I'm unsure of what wave count is probable right now but I do see the momentum to the upside as long as we stay above 1100 tomorrow. A close below 1100 tomorrow would get me short term bearish again.


PLEASE NOTE: THIS IS JUST AN ANALYSIS BLOG AND IN NO WAY GUARANTEES OR IMPLIES ANY PROFIT OR GAIN. THE DATA HERE IS MERELY AN EXPRESSED OPINION. TRADE AT YOUR OWN RISK.

StatCounter