Monday, May 16, 2011

S&P Gives us Clear Breakout Levels; Euro Topped


Internals posted after the US session ended.  The rest of this post below was posted around midday through the US trading session.

Hello all, it looks like the market listened to me for once and sold off the past week or so.  Now the big question is, "where to from here?"  Well we wavers have been faked out so many times the past year or so that we've learned to be more cautious in our calls for Primary wave ((3)).  I think even the professionals in EWP have done the same.  Today is no different.  I want to focus on the short term action and play everything as a short term trade while leaving the possibility open to let profits run indefinitely just in case Primary wave ((3)) down is underway.  What I mean by this is that I normally like to place stops at strategic EWP levels and trail them down with the market, being stopped out automatically by the market when it violates my aggressively bearish wave count.  By having the market take me out, instead of me doing it manually, helps eliminate the human emotion which might destroy some wavers if they use wishful thinking to keep themselves in the market on every downturn as they expect Primary wave 3 is underway.

With that said, I see some big picture signs here that may mean that this downturn is more than just a simple one or two week event.  For the short term I posted the breakout levels I see are important to watch.  A solid break above 1359.44 should signal a shot higher to new highs on the year soon after.  But a solid break below 1329.51 should signal an acceleration of the current downtrend for at least a few weeks.  And by "solid break" I mean a break that lasts more than a few hours and with strong internals.

Learn Elliott Wave Principle


Earlier I mentioned bigger picture signs that something big might be unfolding to the downside.  One of the reasons I said this is because of the weekly momentum picture as seen here through the RSI and stochastics.  Both diverged from price at the latest high, the stochastics have now crossed and are trending down nicely, and the RSI has turned down as well.  The larger the time frame, the more reliable I see these indicators, and right now, both of these indicators have lots of room to run to the downside on their weekly charts before reaching oversold.  So the market is sure primed for a selloff to last at least a few more weeks.

Stock Research & Trading Alerts - Click Here


Also of note, the Nasdaq 100 and financials ETF (XLF) have dipped out of the stock market rally early. The NDX has already broken out to the downside, and normally the blue chip indices like the S&P 500, follow the higher risk Nasdaqs.  If so, the NDX's price action suggests that the breakout for the S&P will be to the downside.  So look for 1329.51 in the S&P to get taken out soon.  It's also worth noting that the financials dipped out of the stock market's rally months ago, perhaps an even more deadly sign for stocks.

So the market hasn't yet given us any conclusive signs of a major top that will last several months or even years, but the door is certainly open for that to occur in the coming weeks.  As a trader, until that happens I'll continue to the play the short term as I see it.  That means I'm watching the breakout levels I posted above and will play the market accordingly to what happens to those levels in the coming days.

Get Big Picture Index and Commodity Forecasts Here


The euro top is looking good here.  We had several daily dojis occur that was followed by sharp selling in an impulsive manner that suggests a major top might be in.  I'm playing the short side every chance I get.  Today's rally allowed by to start getting my feet wet on the short side.


PLEASE NOTE: THIS IS JUST AN ANALYSIS BLOG AND IN NO WAY GUARANTEES OR IMPLIES ANY PROFIT OR GAIN. THE DATA HERE IS MERELY AN EXPRESSED OPINION. TRADE AT YOUR OWN RISK.

Thursday, May 5, 2011

Be Back the 16th

Stocks appear to be undergoing the pullback I've been suspecting the past two days and the euro has declined sharply while remaining shy of new high on the weekly charts, and doing so just after an overbought and diverging RSI took place.  Tops appear to be in place in both stocks and the euro.  Not sure to what degree these tops are as of yet, but tops nonethless.  I'd favor the short side in the next few days.

I'm taking time off from the markets.  I'll be back the 16th.  Good luck all!!

Todd

Monday, May 2, 2011

Stocks Pause; Euro Rally Struggling - Where to from here?


Internals today were slanted towards the bearish column, but not substantially.  Stocks surged out of the gate higher but could not sustain that upward push very long.  The market closed flat on the day with the Nasdaq faring the worst.  Not the kind of internals I'd expect to see on a big reversal day, but it is the kind of action I'd expect to see on mild profit taking as a result of the Osama bin Laden killing since I'm sure traders are going to be a bit on guard until they see what might happen to the stability of the Middle East, oil interests, and US security measures before they pump a lot more cash into stocks.  So we might get a lethargic or down week as a result of profit taking and slight risk aversion.


The daily chart shows a mild reversal bar that might have move credibility if it closed beneath 1360.14 or especially below 1358.69, and if there was high volume today.  None of that happened though.  So I don't want to read too much into this pattern here, but if we continue to slide lower in the overnight session then it might be worth taking a tight risked stab at the short side........TIGHT RISK.


The shorter the chart's timeframe, the less reliable the wave count will be, at least that's how I view things.  With that in mind, it can be concluded that a small Submicro impulsive decline finished up today, along with it's corrective Submicro wave (2).  If correct, the market should fall hard tomorrow in Submicro wave (3).  Like I said earlier, a decline into the late night session tonight might indicate a short term trend change to the downside.

Learn Elliott Wave Principle


Above is the Euro's weekly big picture count I keep refering to when I say that the larger trend is down so that's why I'm always looking for shorting opportunities.  But Intermediate wave (2) is running out of room to remain valid.  So if this count is correct, the euro better get to topping soon.


The daily euro chart shows us an RSI that is overbought, and several doji candlesticks that often signal a reversal in trend is coming.  But nothing conclusive at this point unfortunately.

Get Big Picture Index and Commodity Forecasts Here


The 4hr RSI is telling a bearish story that might make its way to affecting the daily timeframe soon.  This 4hr chart shows a divering RSI compared to price, a very bearish development, especially if this behavior moves into the daily charts.

So the euro is running out of room for the larger bearish count to remain intact.  There are some momentum signs of exhaustion starting to hit the euro, but no real compelling evidence that a top is in place to where I'd want to get short here.  I think the best strategy is to just sit and wait for a sharp move lower, preferably a 5 wave move, and get short that decline with a stop just above the recent swing high.  Until then, I'm on the sidelines doing what I do best, sitting on the couch, watching the NBA playoffs, drinking lots of beer and annoying my girlfriend.

PLEASE NOTE: THIS IS JUST AN ANALYSIS BLOG AND IN NO WAY GUARANTEES OR IMPLIES ANY PROFIT OR GAIN. THE DATA HERE IS MERELY AN EXPRESSED OPINION. TRADE AT YOUR OWN RISK.

Thursday, April 28, 2011

Stock Uptrend Remains Solid; Dollar Decline Today Looks Suspicious


Internals were similar today as to what they were yesterday, i.e. strong bullish bias on volume just under 1 billion shares on the NYSE.  The market's float higher continues with no end in sight here.  The bears are simply non-existent and have no purpose or will right here.

Get Big Picture Index and Commodity Forecasts Here


The S&P count I have for a WXY combination correction is getting quite elongated here.  But so far it seems the most likely candidate in my view if we look at present data, or perhaps simply an ABC flat correction.  At this point, it doesn't matter.  You'll notice that so far we have two 3 wave moves on our hands with an abc decline and rally, so far.  The reason I'm skeptical of this rally being an impulse wave where it's currently in a 3rd wave of that impulse is because volume and momentum indicators (RSI) are at overbought levels and showing a bearish divergence.  This is definitely NOT the characteristics expected at the early stages of 3rd waves.  There are certainly other potential wave counts, but with 3 waves down and then 3 waves up on weak volume and momentum, it suggests it's part of a correction. 

The other possibility is that it's a very weak 5th wave that might end up truncated at some point, or perhaps it's an ending diagonal.  If the market holds up a few more days then this current WXY count I'm tracking is going to get bumped by a count suggesting a truncated 5th wave, or ending diagonal pattern forming.  But all-in-all, there are no signs of a top here.  So I expect higher levels ahead.

Learn Elliott Wave Principle


The US dollar is still dribbling lower into what will eventually be a substantial bottom and resultant monster rally.  There's been a sharp increase in volume the past week or so, a big part has to do with the Fed meeting this week of course.  But there was more volume on the dollar index today than there was on yesterday's "Fed day", and more than there's been in several months.  There was also a modest reversal bar in place today.  Nothing really convincing unfortunately, but still, something to be aware of.  With sentiment towards the dollar so extremely bearish right now, today's strong uptick in volume that's the result of a seemingly endless slow choppy dribble lower, may be a sign of capitulation and that a bottom is at hand.

I'm waiting for confirmation.  The evidence today is not nearly enough.  I want to see a sharp 5 wave rally and some swing highs broken.  Until then, I'm neutral.

PLEASE NOTE: THIS IS JUST AN ANALYSIS BLOG AND IN NO WAY GUARANTEES OR IMPLIES ANY PROFIT OR GAIN. THE DATA HERE IS MERELY AN EXPRESSED OPINION. TRADE AT YOUR OWN RISK.

Wednesday, April 27, 2011

Stocks Traded Well Today; Dollar Downtrend Remains Well Intact


Stocks traded very well today.  They started off floating higher and continued a slow methodical and healthy move higher without much volatility during and after the Fed action today.  This is either a great stepping stone for the bulls, or a big fakeout made to lull the unsophisticated bulls to sleep as the bears pull the rug out from under this market tomorrow.  I see no evidence of that happening though, so saying it will happen would simply be a guess.  Right now the evidence suggests the uptrend is still intact and higher levels will be achieved.

Trading Market Sentiment


With diverging momentum on the RSI, weak volume, and fairly optimistic sentiment, it's hard to think that the S&P is at the start of a 3rd wave higher which the bullish count might suggest.  Instead it still fits well with the combination WXY correction I've been tracking the past few weeks.  The X wave is a flat correction that will give way to a sharp 3 wave drop for wave Y.  But with the market looking strong at the moment, I'm not going to gamble on a short position here though.  I'd rather be long here with a VERY tight stop if I absolutely had to take a position.  But I don't, so I'm neutral at the moment. 

Learn Elliott Wave Principle


The dollar's slow choppy grind to new lows the past several weeks has been quite tidious to watch since I'm waiting for a major dollar bottom and reversal.  But as you can see here, there are no signs of reversal at the moment.  Today's big volume was a result of the Fed action, and a nice sharp rally tomorrow might be a sign that today's decline was a capitulation move, meaning that a bottom is in place.  So a sharp rally in the dollar (sharp decline in the euro), would get me long the dollar and/or short the euro.  Until then, I'm neutral the buck.

PLEASE NOTE: THIS IS JUST AN ANALYSIS BLOG AND IN NO WAY GUARANTEES OR IMPLIES ANY PROFIT OR GAIN. THE DATA HERE IS MERELY AN EXPRESSED OPINION. TRADE AT YOUR OWN RISK.

Tuesday, April 26, 2011

Market Should Float Until Fed Time; Euro Position Stopped Out


Waiting on shorting stocks until I got more evidence of a top proved to be a wise move.  However rolling the dice on the euro and shorting it prematurely yesterday was NOT a good choice.  Volume today was light overall, but much higher than yesterday's almost non-existent volume which was under 700 million shares on the NYSE.  Trader's are waiting for the Fed tomorrow before big volume moves occur I'm sure.  Tomorrow we get an early morning Fed announcement followed by Bernanke's face and speech.  So there should be increased volatility tomorrow and Thursday.  Be ready.....I'm looking to short when the opportunity arises.  At the moment, I am not short stocks or the euro though.  But that could easily change tomorrow/Thursday.  Be ready.

How To Trade Market Sentiment

PLEASE NOTE: THIS IS JUST AN ANALYSIS BLOG AND IN NO WAY GUARANTEES OR IMPLIES ANY PROFIT OR GAIN. THE DATA HERE IS MERELY AN EXPRESSED OPINION. TRADE AT YOUR OWN RISK.

Monday, April 25, 2011

VIX Giving Stock Sell Signal; but only Shorting Euro NOW


Internals today show us a very interesting picture when you take into account the VIX stock sell signal in place right now.  Volume on the NYSE has to be one of, if not THE, lightest volume days of the year at less than 700 million NYSE shares traded today.  I know many traders are filled with ham and pies after the Easter holiday and are waiting for the Fed meeting this week, but still, 695 million shares.....that's some light volume, and a telling picture of how attractive the stock rally is at these levels.  Things should get exciting again when the Fed speaks later this week.


The VIX closed beneath its lower bollinger band last week and then closed back above it shortly after.  This is considered a stock sell signal which is often pointed out early by Elliott Wave International's Steve Hochberg.  Lately, this stock sell signal has not worked well, so I'm counting on it loosely here.  When it does work, there is usually a 2-5 trading day delay between when the signal executes and when a sharp selloff occurs.  So in that respect, a sharp selloff should ensue anytime between now and Wednesday, more or less.

How To Trade Market Sentiment


We've been here before wavers, and the short term we often get right, but then we end up getting our faces ripped off when we hold our short positions too long in hopes of the decline turning into a larger Primary wave ((3)).  This is why I insist on only playing the short term action and trailing stops, this way if the decline turns into something real big then there is a good chance we'll ride it all the way down anyway.  But if it's another fakeout, then we can protect capital with the trailing stop.  Right now the market is setup again for at least short term pullback soon.  The RSI is falling off a cliff and a small 5 wave rally appears complete, and when you combine that with a VIX sell signal, it suggests at least a modest pullback.

There are two things to keep in mind here for the bears:

1) the uptrend is not broken yet, so shorting here is very speculative and very risky.  More conservative traders might want to be patient and wait for confirmation, or at least some evidence of the uptrend breaking down before taking a position.  That's what I'm doing.

2) From the Minor wave 4 bottom there is not a clear 5 wave move higher, suggesting the rally is not over yet.  Sure, one can count it as a 5 wave move and complete, but it definitely wouldn't have the "right look", which is an EWP guideline.  So expecting a top here from an EWP purist standpoint would not be wise.

With all said and done, my thinking on this is that it's quite possible the market is forming another top (at whatever degree), but with too many loose ends here, I'm waiting on the sidelines for more evidence that the uptrend has in fact broken and that the short side should be favored.

Learn Elliott Wave Principle


On the other hand, the currency majors appear to be breaking down.  The euro is sitting on a support shelf while the AUD and GBP have already broken down it appears.  Since the currency markets are so highly leveraged I tend to take more speculative positions since waiting for confirmation would make placing stops too far away for comfort.  I'm shorting the euro now with a stop just above last week's high.  Although this is a very speculative position I'm taking here, I think the potential reward is well worth the risk since the euro's larger trend is firmly down and I expect it to eventually get to parity once that larger downtrend resumes.

PLEASE NOTE: THIS IS JUST AN ANALYSIS BLOG AND IN NO WAY GUARANTEES OR IMPLIES ANY PROFIT OR GAIN. THE DATA HERE IS MERELY AN EXPRESSED OPINION. TRADE AT YOUR OWN RISK.

Wednesday, April 20, 2011

Slap!!

This morning I woke up, sat up in bed, scratched my head and engaged in a blank stare at my wall as I tried to wake up.  I then grabbed my iPod to see what the markets were doing and when I saw what happened it felt like this.....

I shouldn't be surprised at this since I've come out and called for sharp selloffs the past few months and probably each time the market has made a fool out of me.  Looks like my bearish calls have become quite a contrarian indicator.  I'm going to change that though.


With today's rise above 1322.88, the move down earlier this week is a clear 3 wave drop.  So the simplist interpretation, which is what I usually follow, is that it was just an ABC corrective decline and the market should be resuming its uptrend now.


But not so fast bulls, the bearish count is still intact technically.  The 3 wave decline may just have been a very small wave ((a)), and now we're in wave ((b)) which took the form of a "flat correction".  Once complete, the market should then undergo a large wave ((c)) down as part of the larger wave Y of the "combination" correction I've been tracking.

Learn Elliott Wave Principle


The next possibility is that the impulsive wave count is still intact and the funny shape is just a "flat correction" after wave (i) completed.  I don't like this count that much because the flat correction is quite long and deep, which is unlikely for a flat correction.  Although it's still possible so I'm keeping an eye on it.


Today's gap up formed what would normally be an "island reversal" but since the S&P was not in a confirmed downtrend we can't say that is the case.  However it is interesting that we have a down gap and up gap in the exact same spot.  If the bears don't drop this market soon and close the upward gap from this morning, I'd say that would be a very bullish sign for the days ahead.

So I was slapped by the market today and we are left with several options.  I like to choose the simplist of outlooks because that's usually the correct one, which is that this week was simply an ABC decline and now the uptrend has resumed.  The other options I mentioned are certainly still a possibility and any sharp reversal this week will probably move this bearish counts up on the probability chart.  So I'm just a spectator now.

Now if you'll excuse me, I'm going to play in traffic for a little while.....

PLEASE NOTE: THIS IS JUST AN ANALYSIS BLOG AND IN NO WAY GUARANTEES OR IMPLIES ANY PROFIT OR GAIN. THE DATA HERE IS MERELY AN EXPRESSED OPINION. TRADE AT YOUR OWN RISK.

Tuesday, April 19, 2011

Stock Bulls Have Shakey Legs Here, Waiting for Bears to Pounce


Stocks rallied most of the afternoon but again did so on very light volume.  The bulls still haven't come close to taking back what the bears accomplished in just an hour or two yesterday on high volume suggesting the larger trend remains down.  Once this light volume float higher ends (short of 1322.88), the market should undergo more sharp declines to new lows.  I remain bearish as long as the S&P trades below 1322.88.


(POST THIS MORNING) Stocks trading very heavy.  Yesterday the bulls did everything they could to push this market out of the red from that deep early morning selloff but they didn't even come close with the Dow still closing triple digits on the day with very bearish internals.  Now today, again the bulls are pushing hard to get this market out of the gutter and so far are failing to do so.  This tells me the headwinds the bulls are facing here are very strong and that they will lose the fight to push this market higher.  It's like those old cartoons when the guy lifts something heavy over his head and his little legs are shaking rapidly as he tries to keep the weight up.  Well, the bulls' legs are shakey here. 

Look for this bull attempt to fail well short of the 1322.88 level.  As long as the S&P stays below that level, I'm bearish.  There is good potential for large gains on the short side here in my opinion.

Learn Elliott Wave Principle


The above S&P chart shows the open gap left from Monday's big drop.  Stocks may attempt to close that gap at 1319.65.  But since it would be so deep and so close to the wave ((ii)) stopping level I'm not sure the bulls can accomplish a complete close.  Once the market moves into that gap area at all, be prepared for a sharp reversal at any time.  Playing reversal bars or reversal volume plays on the intraday charts may be a wise move tomorrow since the wave count suggests a big sharp decline coming soon.

Euro is bouncing along with stocks, once complete it should fall sharply as well.
PLEASE NOTE: THIS IS JUST AN ANALYSIS BLOG AND IN NO WAY GUARANTEES OR IMPLIES ANY PROFIT OR GAIN. THE DATA HERE IS MERELY AN EXPRESSED OPINION. TRADE AT YOUR OWN RISK.

Monday, April 18, 2011

Wave (ii) is Over, Wave (iii) Down Now Underway


Wave (ii) was quite shallow and short, but that was probably a hint as to how strong the downward pressure is on the market.  Today's breakaway gap and sharp selloff is indicative of a 3rd wave.  And since we were expecting a Minuette wave (iii), this fits well within my wave count I've been tracking lately.  Expect lower levels in the coming days/weeks.  Risk should remain just above the wave X high.

Learn Elliott Wave Principle

END OF DAY POST:


Just a quick addition to this morning's post: the market sold off hard today and spent the rest of the day floating higher.  But it still closed solidly lower.  And the move down was much stronger than the weak float to the upside, and overall volume and internals that include the move higher were still quite bearish as you can see above.  Volume finally spiked above the 1 billion share mark on the NYSE, but still quite short of my 1.2 billion share mark I'd like to see on a down move.  All-in-all though, with the wave count looking bearish and internal weakness accompanying it, this market looks bearish here for the short term at least.  That doesn't mean we won't see some pops here and there along the way, but the series of lower highs and lower lows should continue in the coming days.


The dollar broke out of its range and it did so to the downside as I suspected it would.  With sentiment at an extreme before the decline, and the long standing momentum divergences we've seen in the RSI over the past few weeks, the euro is certainly poised to continue lower from here.  I'm short and remain short.

PLEASE NOTE: THIS IS JUST AN ANALYSIS BLOG AND IN NO WAY GUARANTEES OR IMPLIES ANY PROFIT OR GAIN. THE DATA HERE IS MERELY AN EXPRESSED OPINION. TRADE AT YOUR OWN RISK.

Thursday, April 14, 2011

After 5 Waves Down, Stocks and Euro Look to Rebound


Volume remains light in the market, making it tough to get a definitive consensus of trend. Volume today was still well under 1 billion shares on the NYSE, so although there was a bullish reversal today, the light volume doesn’t make it a convincing reversal…..probably will result in just a day or two of rallying.

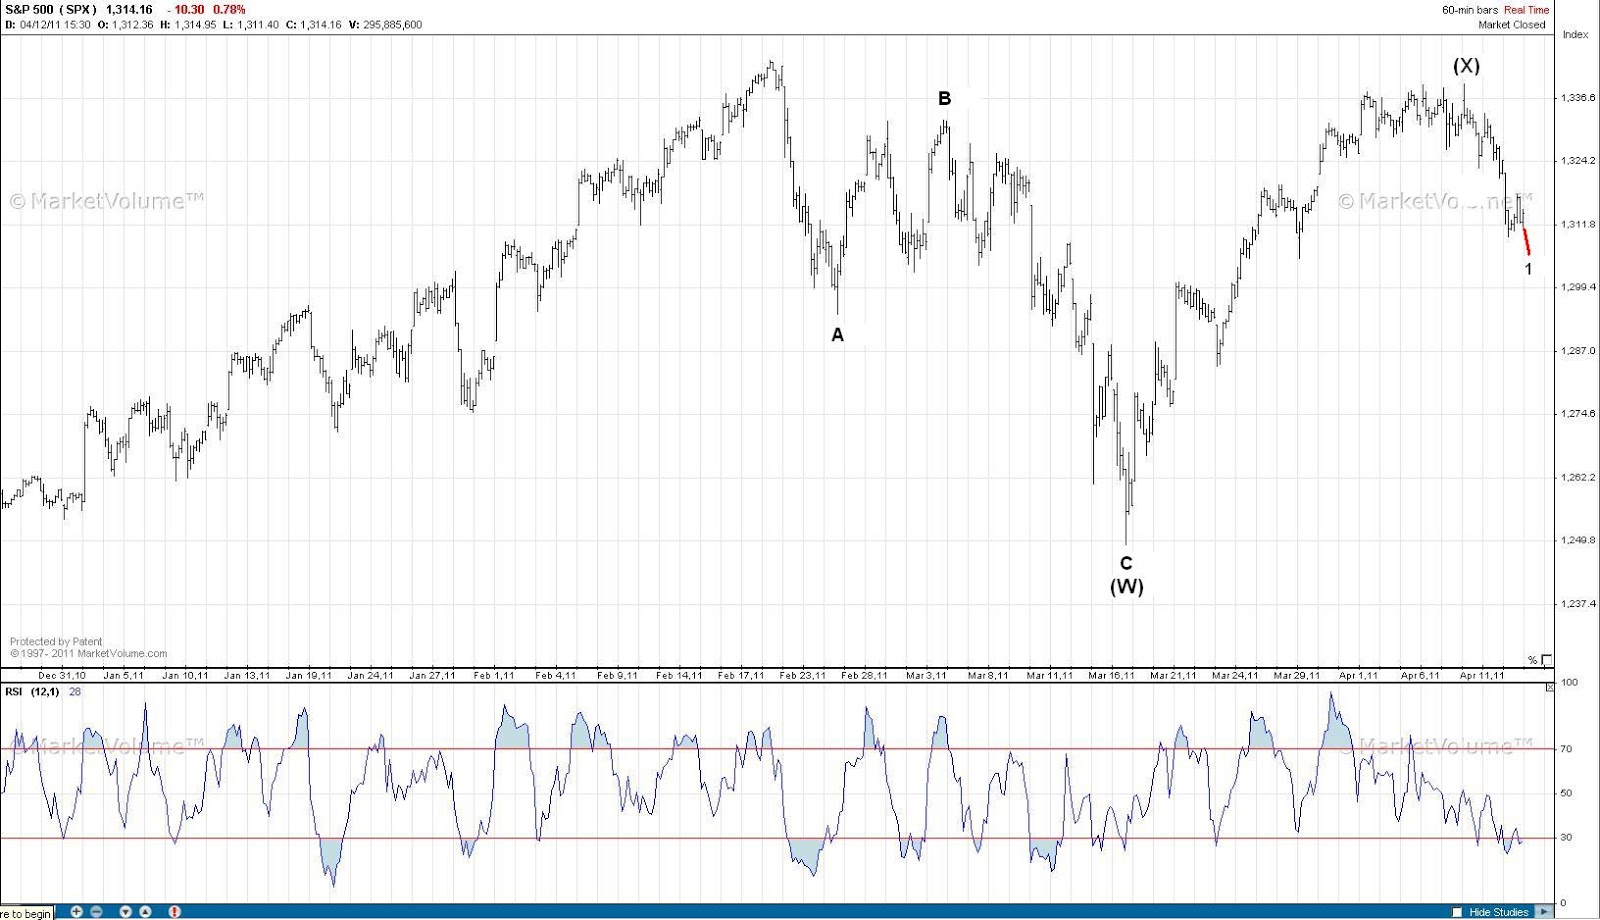
Looking at the wave count I’ve been tracking the past several weeks we can see that things are falling into place so far. I’m unsure of the degrees of trend here since the above degrees don’t fit well into the larger wave count, yet the magnitude of the moves shown here do in fact fit well with the degrees I plugged in here. So there’s conflicting issues here as far as degree goes so remain flexible in that respect.
Today we saw a nice bullish reversal since the market opened very weak and made a new low and then rallied all day and closed in the positive. But the damage has been done to the bulls since a nice 5 wave decline was printed with the action over the past few days. This suggests that the current reversal is the start of wave (ii) that should last Friday and probably at least some of Monday. The market should stay below the wave X high and eventually turn lower sharply with wave (iii) probably early next week. Ultimately, the Wave W low should be broken, which is a significant decline despite it just being part of a correction.
Learn Elliott Wave Principle


Looking at the daily chart you can see that this latest rally has been done on very weak momentum as shown by the declining volume (also seen clearly on the SPY and NYSE) and RSI. This alone is about enough I’d need to see to be getting very conservative as a bull at a minimum. But I’m not a bull, so I don’t have that problem. The only reason I feel this is just a WXY combination correction unfolding is because the drop from the high on the year is clearly a 3 wave move, which means unless that high is broken then this entire move is most likely corrective all around.


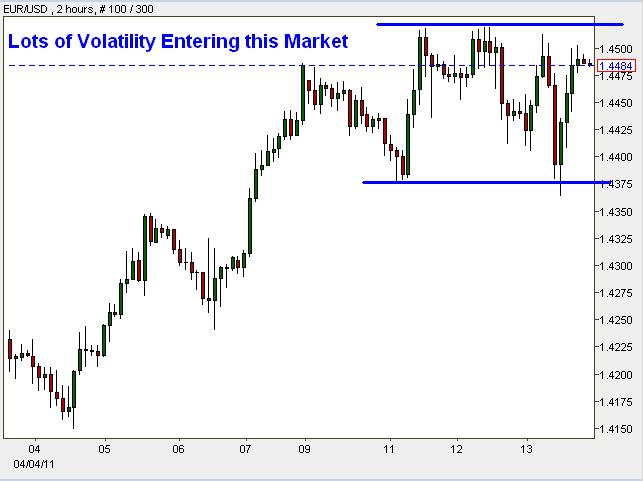
The euro’s wave count eludes me in the short and medium terms. But the long term count shows a clear downtrend. So I have a bearish bias and am currently short right now. The increase in volatility is a good sign a top is near, if not already in. A breakout should ensue soon and I feel that a breakout to the upside will probably be sharp, but short lived and sharply reversed. A breakout to the downside should result in massive US dollar short covering, sending the euro lower in a hurry. So to me, the best place to play this pair is on the short side when opportunities arise.

PLEASE NOTE: THIS IS JUST AN ANALYSIS BLOG AND IN NO WAY GUARANTEES OR IMPLIES ANY PROFIT OR GAIN. THE DATA HERE IS MERELY AN EXPRESSED OPINION. TRADE AT YOUR OWN RISK.

Wednesday, April 13, 2011

Stocks Still Floating Around, but the S&P and Euro Declined in Five Waves


Volume is still light and stocks continue to flop around directionless.  However the wave structure may give us a clue as to a what the larger trend may be.


The S&P eeked out a 5 wave decline suggesting the larger trend is now down.  Unfortunately it's occurring with weak volume and mediocre internals to the bearish side.  So it's not a convincing picture....but it rarely is I guess.  The evidence is strong enough that the rally has exhausted, so I'd short rallies with a stop just above this week's high if I was an aggressive trader.  The market is trading heavy overall, and with a 5 wave decline on our hands, a bearish bias in the short term is warranted.

Learn Elliott Wave Principle


The euro has also declined in 5 waves, although more sharply and convincing than the S&P.  Here too I favor the short side.


PLEASE NOTE: THIS IS JUST AN ANALYSIS BLOG AND IN NO WAY GUARANTEES OR IMPLIES ANY PROFIT OR GAIN. THE DATA HERE IS MERELY AN EXPRESSED OPINION. TRADE AT YOUR OWN RISK.

Tuesday, April 12, 2011

Stocks Breaking Down, but Still no Volume


Stocks fell hard this morning, accompanied by solid volume on the decline.  But unfortunately that's all the bears could do.  Stocks rallied on soft volume the rest of the day.  So the closing NYSE volume number today is a bit deceiving since it's very light for the day overall, but what you don't see is that the early decline this morning had strong volume.  I would have liked to see a close today with 1.2 billion or more shares traded, but perhaps we'll get that tomorrow.


Stocks appear to be falling impulsively but we can't conclude that quite yet.  We still need one more new low to make a nice 5 waves down complete.  But the S&P must stay below 1322.94 to keep the nicely formed impulsive decline intact. 

As for the euro, it rallied sharply despite stocks losing ground this morning but then the euro reversed sharply and never recovered.  This looks like a nice reversal pattern and is worth shorting.  So I shorted the euro this morning with a stop at last night's high.

Everything You Ever Wanted to Know About the Elliott Wave Principle, Free

PLEASE NOTE: THIS IS JUST AN ANALYSIS BLOG AND IN NO WAY GUARANTEES OR IMPLIES ANY PROFIT OR GAIN. THE DATA HERE IS MERELY AN EXPRESSED OPINION. TRADE AT YOUR OWN RISK.

Monday, April 11, 2011

Stocks Look Vulnerable Here


I’ve been talking about how weak the rally looks internally the past few weeks and how I’m looking for volume to re-enter the market to give us some momentum in either direction.  I didn’t want to take a position randomly because I know how the market can easily just float higher and higher and higher on light volume for several weeks.  And that’s exactly what it has done.  But now the daily price action is starting to match the weakness the internals have shown the past few weeks.  Today’s internals continue that trend with a measly 817 NYSE shares traded, but decliners well exceeded advancers by 1,178; a bearish indicator here.
When volume returns, it should move this market sharply.  If it shoots higher with that volume, I believe it would be a capitulation move, not the start of the next rally leg lasting months.  So it should be capped and reversed in fairly quick order.  I wouldn’t short into the rally, I would simply get out of its way and let it run its course and wait for signs of a top.  Then I’ll try shorting against a recent swing high.  The other option is that the market just shoots lower from current levels either Tuesday or Wednesday this week.  If so, and volume increases on the decline, I’d short into that weakness. 
Earnings Season: Strong Earnings Mean a Strong Stock Market -- Right?


With a clear 3 wave drop from the high on the year the only accurate way to count this is an ABC decline within a larger correction, most likely a WXY combination.  The market should soon be undergoing another 3 wave drop to form wave (Y).  Making a new high on the year would negate this count from contention and most likely mean the 3 wave decline was simply an ABC zig-zag correction within a larger 4th wave.  But under this scenario, the market would soon top and reverse anyway.  So I favor the short side now and am looking for an opportunity to get short. 
Everything You Ever Wanted to Know About the Elliott Wave Principle, Free


The daily S&P chart tells a grim picture for stocks.  Volume has fallen significantly as the market has risen, suggesting the rally has little teeth to it and that it’s most likely just a correction [which I’m labeling Wave (X)].  Also notice the RSI has already reversed and has been headed lower for days while price has consolidated.  I can’t emphasize enough how weak this market looks right now.  But without any solid evidence of a top, we have to expect it to float higher….and continue to wait.


The euro count eludes me for the short and medium terms.  The larger downtrend count remains intact though so I want to look for shorting opportunities.  A reversal day, sharp decline and/or an impulsive move lower would get me to attempt a small short position.  Aside from that, I’m on the sidelines here.

PLEASE NOTE: THIS IS JUST AN ANALYSIS BLOG AND IN NO WAY GUARANTEES OR IMPLIES ANY PROFIT OR GAIN. THE DATA HERE IS MERELY AN EXPRESSED OPINION. TRADE AT YOUR OWN RISK.

Tuesday, April 5, 2011

Market Looks Weak, but will the Rally Stop?


This market is a snoozefest for a sidelined bear.  Internals continue to be lethargic, but price continues higher anyway.  Today's NYSE volume was a whopping 829 million on a flat day.  Very few traders have any interest in the markets right now.  And I'm one of them.  I still feel that when volume returns, we need to watch the price action and follow the herd, whichever way it's going.  Until then, I'm avoiding this thinly traded market right now.


Above is the S&P SPDR (SPY) illustrating the weakening momentum with volume increasing on the decline and decreasing on the market's rally.  Also note that the RSI has a bearish divergence in place and suggests at least a short term pullback is just ahead.

Learn Elliott Wave Principle


Lastly, the major indices are diverging at the moment creating yet another bearish setup and opportunity for the bears to smack this market down, if they want to.  So far the bears have failed to muster up any strength, and when they have, they have failed to sustain it.  But above you'll see that the Dow has made a new high yet the Nasdaq Composite and the S&P has not.  As long as this divergence remains in place, the market is very vulnerable to sell off.  I personally would wait for some signs of a top, like an impulsive decline or midday reversal.  But for the gamblers out there, shorting the S&P or Composite with stops just above their highs would be a gamblin move perhaps worth taking.  But it's just that at this point......a gamble.

I've been having computer problems lately and have been working long days on a big project so I probably won't be back unless something significant happens in the market the rest of the week.  But I'll be back to normal posting next week.


PLEASE NOTE: THIS IS JUST AN ANALYSIS BLOG AND IN NO WAY GUARANTEES OR IMPLIES ANY PROFIT OR GAIN. THE DATA HERE IS MERELY AN EXPRESSED OPINION. TRADE AT YOUR OWN RISK.

StatCounter