Wednesday, July 20, 2011

S&P Set to Drop; Euro to Follow at any Time Now


The S&P's big move yesterday had no follow through today, and volume was at a pathetic 794 million NYSE shares.  Not what I'd expect on a Wednesday after a big rally the day before.  But the bears have failed to come in and control this market as well.  At the moment, the bulls look tired and are having a tough time getting volume in on their side with a sustained rally.  This could spell trouble for the bulls the rest of the week, if not longer.


I was tracking a 5 wave rally count that had recent weakness as a wave ((iv)).  But Monday's decline overlapped wave ((i)), violating an EWP rule and therefore rendering this bullish count invalid.  So we have more overlapping waves on our hands, making me conclude we're probably in some type of flat or triangle correction.  The other conclusion is that a much larger top is forming, and all the diverging behavior between indices and sectors along with sloppy overlapping price action is all just part of a large topping process.  Too early to tell right now, but it's definitely on the radar.

Using Elliott Waves: As Simple As A-B-C


Weekly momentum is not showing a bullish picture.  Looking at the RSI compared to the S&P's head and shoulders pattern you can see that the new high (the head) was not confirmed by the RSI.  Then the right shoulder on the S&P exceeded the left shoulder while that move in the RSI left a peak well under that of the left shoulder.  This, along with the bearish stochastics on the weekly chart as well, gives us more evidence to support that a head and shoulders top may completing, and the next big move will be to the downside.

Also of note is that the Nasdaq was much weaker today that the Dow and S&P.  Intel (INTC) closed slightly down on the day but posted a solid earnings report after the closing bell, yet shares are down over 2% after hours at the time I'm writing this.  The mood seems a bit sour in the market right now.  Watch for a sharp decline soon in the overall stock market.  How far or long it will last I don't know, but the market appears grumpy right now.

Nothing has changed for the euro.  I'd still be cautiously short against 1.4577.


The Personality of Stock Market Waves

Elliott waves don't merely reflect prices plotted over time. Each wave has its own "personality." Listen to this video by EWI's Wayne Gorman to learn more about the psychology behind the waves and how it affects your investment decisions.


This video was taken from the free Club EWI video series: Learn the Why, What and How of Elliott Wave Analysis. This 3-video series is a great way to get started with the Wave Principle. You can get these videos free with a Club EWI Membership.
Watch your free videos now

Already a Club EWI member? Access the video series Learn the Why, What and How of Elliott Wave Analysis here

PLEASE NOTE: THIS IS JUST AN ANALYSIS BLOG AND IN NO WAY GUARANTEES OR IMPLIES ANY PROFIT OR GAIN. THE DATA HERE IS MERELY AN EXPRESSED OPINION. TRADE AT YOUR OWN RISK.

Monday, July 18, 2011

Stocks Flip Floppin Around, Indecisive; Euro Should Move Lower

Blogger isn't letting me upload my charts right now so I'll just have to give a short description of today's action:

STOCKS


The internals today were slanted heavily on the bearish side despite the late day comeback in stocks.  90.6% of total NYSE volume was to the downside and there were 2,569 decliners and only 446 advancers.  But volume overall was very light at only 871 million shares traded.  Not typical of a large 3rd wave down starting as some wavers may be leaning towards at the moment.  That's not to say they're wrong, I just don't see the evidence here.  First you have a 3 wave decline from the high on the year, then it flip flopps around on light volume......that doesn't seem like a big 3rd wave kick off, but we'll see.

Excluding the wave count, the bears can hang their hats on two things in my view:

1) the S&P has formed what looks like a head shoulders top on the daily chart.

2) the Nasdaq 100 has diverged from the rest of the major indices and made a new high on the year and that divergence has now been in place for several days, often a subtle indicator of a trend reversal in the overall market.

So the wave count and internals don't support a big decline is starting right now while basic techincal analysis does.  With an indecisive and unclear market structure, I choose to stand aside until things clear up a bit.

EURO


As for the euro, it's not behaving like I'd expect a 3rd wave to behave so I'm skeptical of my big bearish call.  But on the daily charts you can see it made a new low and hasn't bounced much since doing so.  So I'm still leaning toward the bearish side in the short term at least, as long as 1.4577 is not broken.

Learn Elliott Wave Principle


PLEASE NOTE: THIS IS JUST AN ANALYSIS BLOG AND IN NO WAY GUARANTEES OR IMPLIES ANY PROFIT OR GAIN. THE DATA HERE IS MERELY AN EXPRESSED OPINION. TRADE AT YOUR OWN RISK.

Thursday, July 14, 2011

Euro Set up Nice for Bears Here


Nothing has changed in my view of stocks since my last post.  But the euro has presented itself with a nice setup for the aggressive bears here.  The Minor 5 wave count I labeled in my llast post has become invalid since the 4th wave entered into the 1st wave's territory.  What's important now though is the strong impulsive nature of the decline and where the current rally has so far stopped at.  You can see on the above chart that the euro has rallied sharply and closed an open gap left from a few days ago, but has then sharply reversed after doing so, hence the long candlestick wick.  What's also of interest is that the reversal took place near a fibonacci 61% retracement level, which is a common reversal point for 2nd waves.

Although very risky, I thinking aggressive bears could attempt a short position here with a stop just above the overnight high.  Sure, the euro can blast right through that stop like nothing at any moment.  But that tight risk level is dwarfed by the reward potential of a catching the very early stages of a large 3rd wave down.

How to Find and "Hook" Potential Trade Setups


PLEASE NOTE: THIS IS JUST AN ANALYSIS BLOG AND IN NO WAY GUARANTEES OR IMPLIES ANY PROFIT OR GAIN. THE DATA HERE IS MERELY AN EXPRESSED OPINION. TRADE AT YOUR OWN RISK.

Wednesday, July 13, 2011

Stock Outlook Mixed; Euro Breaking Down

Late last week we saw some topping action that suggested weakness going into this week.  And we got it.  But it may be over now.  There is still a clear 3 wave decline (ABC) from the high on the year in the S&P, so a new high on the year seems likely.  We can't forget that.  Only the Nasdaq 100 managed a new high while the other major indices failed.  Now, the rally from the wave C low looks impulsive, with the recent weakness this week being a wave ((iv)).  If correct, stocks should be on their way to new highs on the year soon.

How to Find and "Hook" Potential Trade Setups

If you close your eyes and pretend that there is not an ABC three wave decline from the high on the year, then this chart might convince you of taking a bearish position.  There is an imperfect 5 wave decline that just completed on the intraday charts.  This alone is not compelling enough to me to get short.  But a failure to break above 1360 and a sharp decline to a new low would get me on the bearish side rather quickly.

Learn Elliott Wave Principle


The euro is declining in a nice impulsive patern, it even subdivides nicely into 5 wave moves.  The chart speaks for itself, the euro will confirm that it has started a major downtrend when wave 5 breaks down to a new low.

PLEASE NOTE: THIS IS JUST AN ANALYSIS BLOG AND IN NO WAY GUARANTEES OR IMPLIES ANY PROFIT OR GAIN. THE DATA HERE IS MERELY AN EXPRESSED OPINION. TRADE AT YOUR OWN RISK.

Friday, July 8, 2011

Friday's Decline May be Sign of Significant Reversal


Although it is a laid back summer Friday, today's decline may signal a significant reversal is at hand.  I thought the major indices would march to new highs before any significan reversal but today's action may mean things fall a bit short of that target.  The Nasdaq 100 is the only major index that made a new high.  The Composite, Dow and S&P did not.  That in itself is a warning sign for the market since only the higher risk speculative tech stocks were able to make new highs while the big blue chip solid names failed to do so and dipped out of the rally early perhaps.

It is a Friday so I don't want to get too excited about the action today.  As always, the way the market closes will be important.  Closing on the lows would be a good sign a significant reversal is in place and that the bearish side should be favored for short term players, while a sharp rally into the close getting the indices to even or in the positive would favor the bulls.

Learn Elliott Wave Principle


The euro's triangle count is still well on track.  EWP states that "e" waves in a triangle are usually the result of a reaction to a news event.  Well, we had a poor jobs report this morning and the euro declined a bit, fitting well with the wave ((e)) interpretation I have above.  If the above count is correct, Monday should bring a very sharp rally thrust from the triangle to a new high.  But a break below wave ((c)), and especially wave ((a)), would negate the triangle and lead to further heavy selling.


PLEASE NOTE: THIS IS JUST AN ANALYSIS BLOG AND IN NO WAY GUARANTEES OR IMPLIES ANY PROFIT OR GAIN. THE DATA HERE IS MERELY AN EXPRESSED OPINION. TRADE AT YOUR OWN RISK.

Wednesday, July 6, 2011

Medium Term Outlook for Stocks, Euro, Clearer than Long Term


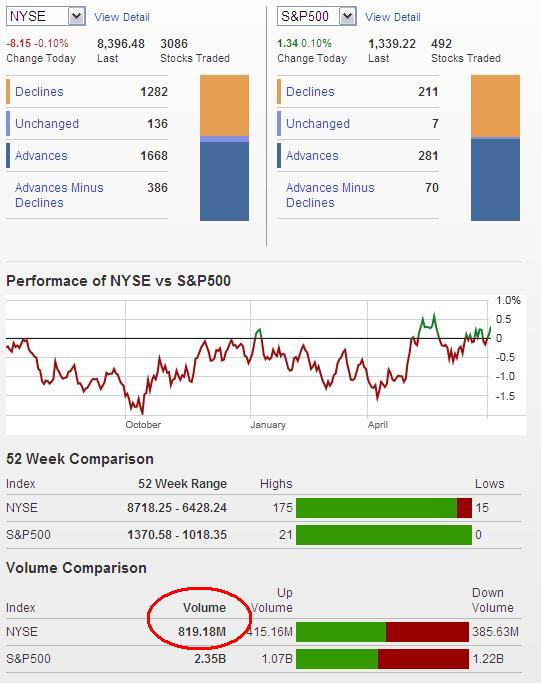
Internals were flat today and volume was extremely low at 819 million shares on the NYSE, so enthusiasm to buy the rally here has waned.  I think that a small decline or some sideways action the next few daysmight be in order.

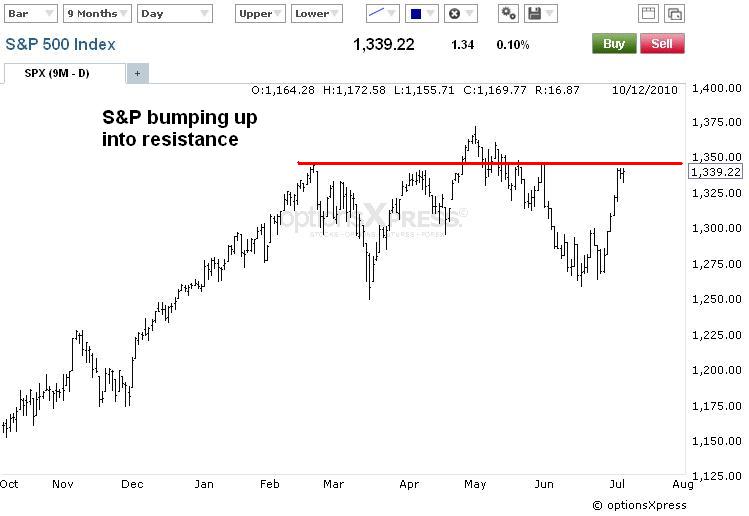
The S&P is now bumping up against a resistance line that has been in place for a long time.  Momentum for the current rally appears to be softening, so it might be tough to get through this resistance on the first try.  I expect some consolidation or pullback here before the market charges back up to break above this resistance.

Learn Elliott Wave Principle


The Dow and S&P sport a lot of 3 wave moves, both up and down, over the past several weeks, making it difficult to get a good idea of a longer term wave count.  So I'm focusing on the short term, and keeping it basic.  The Nasdaq 100 is the only index that has a nice EWP pattern, which is a flat correction.  What the longer term count is, I'm not sure at this point.  But the series of 3 wave moves all over the place in the major indices are either flat corrections, or the making of triangles, or a combination of the two between the various indices.

Either way, I have no reason to abandon the bullish outlook for stocks in the medium term.  Aside from some sideways action or a small pullback at resistance here, I think the markets are in an uptrend and the bullish side should be played when opportunities arise.

How to Set Protective Stops Using the Wave Principle


I'm being very speculative here by labeling the euro a triangle above, but until a new swing high or low is established, the price action is telling us it's consolidating which is oftentimes a triangle in EWP terms.  So I'll take a chance and follow this count.  Now this is a bullish triangle so a sharp thrust higher should get underway in the next few days once wave ((e)) ends.  So be ready.  But a break below the wave ((c)), and especially wave ((a)), lows will negate this triangle and open the door to further selling in the euro.

PLEASE NOTE: THIS IS JUST AN ANALYSIS BLOG AND IN NO WAY GUARANTEES OR IMPLIES ANY PROFIT OR GAIN. THE DATA HERE IS MERELY AN EXPRESSED OPINION. TRADE AT YOUR OWN RISK.

Friday, July 1, 2011

Stocks Should Get to New HIghs on the Year Soon; Euro Faltering

Keeping it simple and looking at the pattern of swing highs and lows earlier this week paid off.  Once the series of lower highs and lower lows was broken, the market has been surging higher and higher.  Those who followed that made a nice profit very fast.  So it looks like the recent decline was a 3 wave move, a correction which I labeled ((a))((b))((c)).  So stocks should be working their way to new highs on the year shortly.  It's possible we get another down leg to a new low if the correction decideds to turn into a double zig-zag, but it would still be a 3 wave move, giving us the clue we need to know the larger trend.  But seeing as this correction for a Minor wave 4 is already quite large compared to its brother Minor wave 2, I doubt wave 4 will materialize into anything larger. So look for the uptrend to remain intact in the coming days.

Although it it's a little late to get bullish here at these levels, it does seem the path of least resistance right now is up.  I'd be bullish, or on the sidelines.

Learn Elliott Wave Principle


The euro might be running into trouble here.  It tends to follow stocks, more or less, and despite todays big rally in stocks, the euro is struggling.  In fact, it appears to be establishing a head and shoulders top with the right shoulder falling short of the the left shoulder's level, suggesting a lot of internal weakness.  When you combine that with the diverging RSI you have the potential for the euro to slide soon.  I'm bearish the euro here against this week's high.

How to Set Protective Stops Using the Wave Principle


PLEASE NOTE: THIS IS JUST AN ANALYSIS BLOG AND IN NO WAY GUARANTEES OR IMPLIES ANY PROFIT OR GAIN. THE DATA HERE IS MERELY AN EXPRESSED OPINION. TRADE AT YOUR OWN RISK.

Tuesday, June 28, 2011

Downtrend May Have Been Broken in Stocks

A little over a week ago I issued a warning to the bears because there were signs in place a bullish reversal was in the works.  With several trading days printed since then, we can see what I was talking about more clearly.  You can see that the downtrend from the high on the year was not impulsive looking, so we had to look to another method of determining the trend and short/long term outlooks of that trend.  The best I could come up with without the help of EWP, was looking at the set of lower swing highs and lower swing lows defining the trend.  And that's what we've had.  But since the reversal took place a week or so ago, you can see that the market failed to make a new low, and then made a new high recently.  This spells out even more danger for the bears right now since this is the first solid sign that at least the short term downtrend has broken.

Since we don't have an impulsive decline yet, and so far there's only a choppy 3 waves down from the high on the year, this recent development in swing highs/lows makes bearish positions very risky here.  A break above 1311.80 would solidify the entire decline from the highs on the year was a 3 wave move, which is corrective, and that new highs were right around the corner.  Staying below 1311.80 keeps the bears hopes alive, but it would take a new low to rejuvenate the bears' chances and create what could be interpreted as an impulsive decline.

How to Set Protective Stops Using the Wave Principle


The euro is a mess.  My impulsive wave count I was tracking is not looking good as the euro is having a hard time making new lows.  It's consolidating on the daily chart in a triangle looking pattern.  This will lead to a breakout soon.  If it's an EWP triangle then that means the breakout will be to the upside.  It would take a sharp reversal to a new low soon for me to get bearish this pair again.

PLEASE NOTE: THIS IS JUST AN ANALYSIS BLOG AND IN NO WAY GUARANTEES OR IMPLIES ANY PROFIT OR GAIN. THE DATA HERE IS MERELY AN EXPRESSED OPINION. TRADE AT YOUR OWN RISK.

Thursday, June 16, 2011

Euro and Stock Bear WARNING


Price action today in the S&P and the euro suggest a possible bullish reversal just took place which might act as a floor for these markets for at least a few days.


Volume was solid today, similar to yesterday's, only the internals were flat as the market seemed a bit confused today.  But with a strong rally at the close, at the moment it's sending up flags that the bulls might have regained control of the market for now.

Learn Elliott Wave Principle


Seeing this ending diagonal-ish looking structure here in the daily S&P chart is not encouraging for the bears.  The "bunching" up of price usually occurs before a very big and sharp reversal.  We may get some more choppy downward movement for a few days but at some point this market will give.  There will be a very sharp move to the upside or downside judging by the structure developing.  And right now I'd guess that the move will be to the upside since it usually precedes a reversal, but either way, be prepared for a sharp move.  Taking profits on some aggressive short positions might be wise if the overnight session holds firm or rallies big.

Six Straight Weeks of Decline Take DJIA Below 12,000: What Now?


The euro is not my friend today either since it put in a potential daily reversal candle itself.  This sends up the warning flags to me and had me put a stop at 1.4496 on my short position.  A move above that level will make the recent decline a 3 wave move, which is a correction, and imply new highs are on the way.  So any movement above that level means I shouldn't be short.


PLEASE NOTE: THIS IS JUST AN ANALYSIS BLOG AND IN NO WAY GUARANTEES OR IMPLIES ANY PROFIT OR GAIN. THE DATA HERE IS MERELY AN EXPRESSED OPINION. TRADE AT YOUR OWN RISK.

Wednesday, June 15, 2011

Stocks Working Toward 1250 Support; Euro in 3rd Wave Down


Internals today were solidly bearish.  Everyone was a seller today, and all day.  Yesterday's rally was a sucker's rally.  No capitulation, no bottom.  Volume even picked up a bit today after yesterday's big move higher.  The bears remain in control.

Below is what I posted this morning:


The S&P relieved some of the oversold measures with yesterday's rally.  I'd have liked to see another day or two of relief rallying to have a better feeling about harder selling ahead but so far it doesn't look like it will do that.  The S&P seems poised to continue toward the 1250 level I've mentioned before.  Right now we just have a series of 3 wave moves all over the place so I'm counting this decline as a correction at the moment.  The behavior of the S&P around the 1250 level and the wave count that develops at that time will help us better assess the bigger picture potential of the decline.  But right now, I'm just targeting 1250 in the S&P.

Learn Elliott Wave Principle


The euro's wave ((ii)) bounce was short lived as a new low was established in today's trading.  All signs point to a large sharp move lower being underway in the euro as wave ((iii)) down gets firm control of this pair.

PLEASE NOTE: THIS IS JUST AN ANALYSIS BLOG AND IN NO WAY GUARANTEES OR IMPLIES ANY PROFIT OR GAIN. THE DATA HERE IS MERELY AN EXPRESSED OPINION. TRADE AT YOUR OWN RISK.
Monday, June 13, 2011

Stocks Still Struggle to Mount Rally; Euro Completed 5 Waves Down from High

The S&P has completed a 3 wave rally to a new high, and has so far only completed 3 waves down from that high.  Volume and intensity on the decline are a bit tepid so I'm still concluding that this current weakness is just a correction of a larger bull move higher.  That could change though with some sustained sharp declines with increasing volume and bearish internals.  But right now, the market is in a temporary downtrend that doesn't appear over quite yet. 

The best guess here is that the market is unfolding in a "flat correction", which is derived from the 3 wave rally to a new high.  According to EWP, this type of behavior lends itself to flat corrections.  So that means a 5 wave decline for wave C within that flat correction is underway now.  So the market should hit, and perhaps slightly exceed, the 1250 level before bottoming.  The action surrounding 1250 will be important to the bigger picture.  A sharp reversal and rally near that level will make it probable a bottom is in and that the market is on its way to new highs on the year.  But if the market accelerates the downtrend and drops significantly through 1250, it may mean a bigger decline is underway than expected.  So I'm watching the action around 1250 closely.

Learn Elliott Wave Principle


The evidence of a major euro top is strong.  Normally when I say that though, I'm proven wrong shortly afterward.  But the evidence speaks for itself.  Momentum diverged on the final push to a new high, then a head and shoulders pattern formed, followed by a 5 wave impulsive decline.  So the evidence is strong a major euro top is in, and any sharp rally that occurs I'd see as an opportunity to get short, or add to existing short positions.

PLEASE NOTE: THIS IS JUST AN ANALYSIS BLOG AND IN NO WAY GUARANTEES OR IMPLIES ANY PROFIT OR GAIN. THE DATA HERE IS MERELY AN EXPRESSED OPINION. TRADE AT YOUR OWN RISK.
Thursday, June 9, 2011

Euro Catching up with Stocks


Nothing has changed in my outlook on stocks.  They continue to trade heavy and the trend is still down.  Some indicators are now oversold intraday, but there's usually a lot of divergence occuring before a meaningful bottom gets put in, and that's not there quite yet.  Stocks may bounce in the very short term, but the trend remains firmly down regardless.

The euro appears to have finally topped and is now going to play catchup with stocks to the downside.  Looking above at the 2hr euro chart you can see a strong rally leading into a head and shoulders topping pattern.  This is a good sign the euro has toppped.

Learn Elliott Wave Principle


Another good sign the euro has topped is the impulsive decline it's tracing out from the high.  Not only is there a clear small 5 waves from the top, but wave (iii) is an extremely sharp decline which is what we'd expect to see if the above count is correct.  So the euro looks very weak and vulnerable here.

PLEASE NOTE: THIS IS JUST AN ANALYSIS BLOG AND IN NO WAY GUARANTEES OR IMPLIES ANY PROFIT OR GAIN. THE DATA HERE IS MERELY AN EXPRESSED OPINION. TRADE AT YOUR OWN RISK.

Tuesday, June 7, 2011

Stocks Remain in Downtrend


Stocks continue to trade horribly and so the downtrend remains well intact.  The bulls were at it again today, trying to put a floor in this market and surge the market higher.  However the rally stalled late in the morning and flip flopped around until eventually collapsing into the close.  The buying power just isn't there, and yet there is no panic despite the constant selling pressure the past few weeks.  Bottom lin: expect the market to continue lower for at least the short term as it keeps the trend of lower lows and lower highs intact.

The euro is still looking farely strong although starting to show signs of possible weakness.  But right now they're only "possible signs" of weakness, nothing convincing.  Momentum has started to diverge and the euro is having a hard time sustain its recent strength on the surges higher.  Once I get a reversal bar or impulsive decline, I'd be slamming the short side on this.


PLEASE NOTE: THIS IS JUST AN ANALYSIS BLOG AND IN NO WAY GUARANTEES OR IMPLIES ANY PROFIT OR GAIN. THE DATA HERE IS MERELY AN EXPRESSED OPINION. TRADE AT YOUR OWN RISK.

Monday, June 6, 2011

S&P Downtrend Intact, but Nothing Impulsive Yet; Euro SHOULD Reverse Lower Soon


Stocks continue to trade very heavy.  The bulls attempted to put a floor in the market through the first half or so of the trading day but gave up as the close neared.  The bears still have control and today's internals highlight that fact.  Volume was modest at 954 million NYSE shares traded with 92% of stocks trading to the downside, and 449 of the S&P 500's stocks closing the day down.  The selling in June is probably more than just some kind of new month profit taking since May failed the rally for the year.  The decline has developed into a little more than that.  But without a clear EWP count, I'm still cautious getting too excited and overleveraged on the bearish side here.


Without a clear impulsive count on the decline I have to use retraint on the short side.  On the last swing high (3rd red line to the right on above chart) I thought shorting after that day's close was a good risk/reward opportunity on the short side since a new swing high failed to be established.  That "bet" paid off well as the market has slid ever since.  Late last week I thought taking profits on part of that short position to protect gains was a good idea.  The market has continued lower though.  But I would not close the rest of my short position here since there is no sign of a bottom.  Granted, those signs often come in the overnight futures session and there's little one can do to protect themselves from a monster rally in the cash market first thing in the morning.  But I'm going to play it tight and protect gains and simply trail this decline lower until I'm stopped out. 

The play here is simple, as long as the market keeps making lower highs and lower lows, I want to remain short.  If this is the big Primary wave ((3)) then there will be plenty of opportunities to pile on after we get some big impulsive wave counts.  I don't want to get ahead of myself though, I want to trade what I see now, in the short term.  And the short term action tells me to play it on the short side, with a small position, and have a quick trigger finger to stop/exit out of the position.


The euro has been a bit frustrating lately.  Stocks have fallen and yet the euro has continued its rally.  It's now very deep for the projected (c) wave of a flat correction so I'm not that confident in the count here.  There's nothing suggesting the euro's rally is nearing an end other than this wave count.  If the count is correct, there is little room for the euro to move any higher.  As a euro bear I'd like to see it reverse lower very soon to keep this count in play.

How to Put the Wave Principle to Work
In the video below, EWI Senior Commodity Analyst Jeffrey Kennedy walks you through a basic checklist of how to put the Wave Principle to work. This clip was taken from The Wave Principle Applied webinar, originally recorded for Futures Junctures subscribers.

Get 45 pages of FREE practical lessons in Elliott Wave International's Best of Trader's Classroom eBook


Would you like to learn more about trading with the Wave Principle? Get 45 pages of FREE practical lessons in Elliott Wave International's Best of Trader's Classroom eBook . Taken from Jeffrey Kennedy's renowned Trader's Classroom series, this FREE 45-page collection offers 14 actionable lessons that will help you determine entry points, stop levels and price targets for the markets you trade.

Download The Best of Trader's Classroom now


PLEASE NOTE: THIS IS JUST AN ANALYSIS BLOG AND IN NO WAY GUARANTEES OR IMPLIES ANY PROFIT OR GAIN. THE DATA HERE IS MERELY AN EXPRESSED OPINION. TRADE AT YOUR OWN RISK.

Thursday, June 2, 2011

Headlines are Doomy and Gloomy


News headlines are looking awfully bleak this morning.  I said yesterday that I expected some follow through to the downside this morning and I'd take profits when that happened.  Well that's exactly what we got, and taking profits seems like a good idea with these gloomy headlines above.  I'd still keep some position on short, but I'd trail the stop down with the market.  It's approaching oversold on at least a short term basis pretty soon.

Bottom line: The market has fallen so much so fast that we are approaching oversold on a short term basis.  When you combine that with the gloomy news headlines we see this morning, I'd like to take some profits here to protect gains, and then trail my stop lower as the market heads lower.

PLEASE NOTE: THIS IS JUST AN ANALYSIS BLOG AND IN NO WAY GUARANTEES OR IMPLIES ANY PROFIT OR GAIN. THE DATA HERE IS MERELY AN EXPRESSED OPINION. TRADE AT YOUR OWN RISK.

StatCounter