This Elliott Wave blog is dedicated to sharing Fibonacci ratios and other technical analysis for forex signals, index futures signals, options signals, and stock signals. Elliott Wave Principle puts forth that people move in predictive patterns, called waves. Identify the wave counts, and you can predict the market.
Thursday, March 17, 2011
Stock Rally Looks Corrective, Downtrend Still Intact; Euro Finishing Triangle
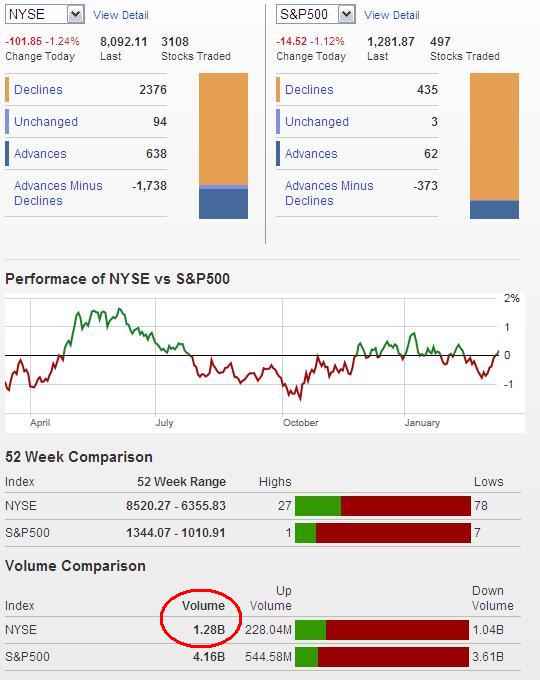
Looking at the internals of today’s action it helps me answer the question I had all day: was today’s rally a correction within a larger downtrend, or did a bottom just get put in and a rally to new highs on the year coming? Looking at the internals it’s clear that today’s action fits much more with a correction than a bottom and reversal. Today’s volume was 1.04 billion NYSE shares compared to yesterday’s down day volume of 1.13 billion shares, and Tuesday’s 1.28 billion shares suggesting much less enthusiasm to the upside than downside. Also, today only had 1,392 more advancers than decliners on the NYSE and 316 more on the S&P, which are much less numbers than we’ve seen on down days the past few weeks. So these are not stellar numbers for such a big rally after a downtrend that’s lasted several weeks. Also note that the Nasdaq Composite closed with only about half of the percentage gains as the S&P and Dow indices. I know Japan is playing a big role in tech’s lagging here, but just looking at this from a technical analysis standpoint, the technology sector’s lagging is often viewed as bearish since higher risk stocks often lead the overall market (note that the Nasdaq 100 which is all technology stocks fared a little better than the Composite at 1.01% gains today).
So looking at these internals now, today’s rally is probably just a correction, and that a resumption of the downtrend to new lows is imminent. Of course, that may change with robust internals tomorrow or later on, but as it stands right now the larger downtrend is still well intact. The bulls took down no key levels, nor did it break the downtrend in price action, and the internals today were far from stellar.
Get Bob Prechter's Latest Elliott Wave Theorist Letter Free!
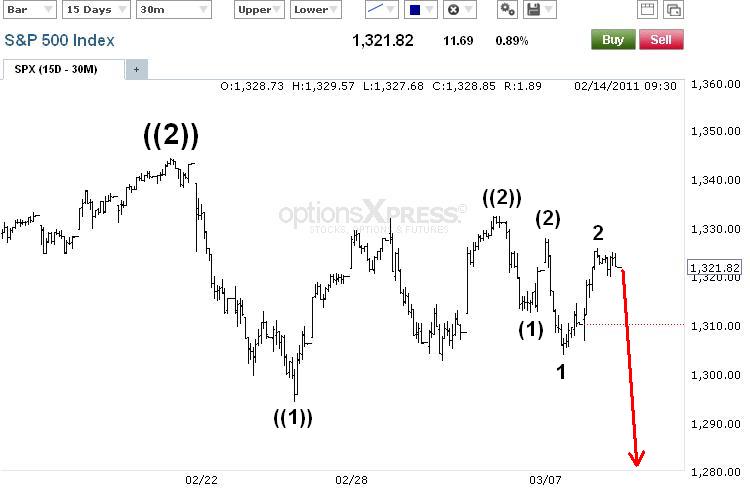
The S&P chart above shows that despite the big rally today, the series of lower highs and lower lows remains intact on even the 30min chart. It’s a good sign for the bears, but not a requirement for success. As long as the Minute wave ((i)) low of 1294.25 remains intact then I’m firmly bearish stocks.
Elliott Wave International's Commodity Freeweek!
On a minor note, I wanted to point out that the Nasdaq Composite (and NDX) did not participate in the late day rally that the S&P and Dow embarked on. You can see that it remained quite flat while the S&P surged higher on the above chart. Now I know the Japan crisis is leaning harder on tech stocks than others, but taking this at face value it MAY be a very subtle signal that more selling pressure is coming sooner than we think. We’ll see tomorrow if this little divergence turns into something much bigger.
The euro has continued its rally, as well as kicking me in the pants, as I was stopped out again last night on my short trade. I see no signs of a top right now so I’m neutral in the short term. It appears a triangle might be forming now as part of a 4th wave. So a sharp thrust higher to a new high and then reversal would then be in order in the Asian and European sessions tonight. Doing so might signal a longer term top and reversal, so I’ll be watching the action closely tomorrow morning to try and attempt another short position. Since I’m long term bearish the euro, I’m only looking for shorting opportunities right now.
PLEASE NOTE: THIS IS JUST AN ANALYSIS BLOG AND IN NO WAY GUARANTEES OR IMPLIES ANY PROFIT OR GAIN. THE DATA HERE IS MERELY AN EXPRESSED OPINION. TRADE AT YOUR OWN RISK.
Wednesday, March 16, 2011
Stocks Continue to Trend Down, no End in Sight Yet; Euro Poised for Big Decline
EWI's FreeWeek is Here! Get full FREE access to Elliott Wave International's most popular commodity forecasting service
The magnitude of this 3rd wave has called for me to adjust the degrees of trend I’ve been labeling as the 1st and 2nd waves. Now I have a more appropriate Minute waves ((i)) and ((ii)) down from the February high. At this point, we have enough selling and profits on the short side to just take a step back and focus on the bigger picture here in my view. So I’m not interested in counting every little sub-wave within this wave count at the moment. The important key to take home from this is that a 3rd wave is underway, internals are supportive of momentum still on the bears’ side, and the series of lower highs and lower lows remains intact. So the trend is firmly down and the short side is still the path of least resistance.
Support doesn’t really begin until 1225, but this market should move close to the 1170-1185 area before even thinking about forming any significant bottom. The area of the prior 4th wave tends to be a good area to find good reversal points. That area is still a ways away.
Learn Elliott Wave Principle
Above is a close up of the price action and wave count. I’m merely showing this because as it stands now, this chart looks extremely bearish and suggests a large almost straight line down move could be coming at any time. This rolling-over structure is often what precedes major sell offs. So be ready.
The euro’s 1 hour chart appears to have signaled a reversal so far. Amazingly, despite two new major swing highs at this very deep Minute wave ((ii)) retracement, it still has not exceeded the high put in earlier this month. Now we currently have a double top formation, and lots of selling pressure capping the market’s rallies at the moment as you can see from this afternoon’s big spike and reversal. Also notice that the RSI is lagging badly, diverging from the last few highs that price has made.
The evidence is strong that the euro is at the forefront of a major decline here. I’m short again the euro and will stop out if a new high on the month is made.
PLEASE NOTE: THIS IS JUST AN ANALYSIS BLOG AND IN NO WAY GUARANTEES OR IMPLIES ANY PROFIT OR GAIN. THE DATA HERE IS MERELY AN EXPRESSED OPINION. TRADE AT YOUR OWN RISK.
Tuesday, March 15, 2011
Stocks Should Continue Lower; Euro Still Searching for a Top
My thoughts and prayers are with our Japanese friends across the sea, and with those who have family and friends affected by the disaster there. It’s such a sad and tragic event. Growing up in southern California I’ve been through several earthquakes and the biggest was a 6.0 magnitude that I was literally right on the epicenter of. It was insane. Sitting in my house felt like sitting in the back of an old small beatup pickup truck driving 50 miles an hour over thousands of speed bumps. Our house had separated from the hillside it was on and soon determined to be uninhabitable by the authorities, so it was completely torn down, along with around 30% of my neighborhood. I can’t begin to imagine being even remotely near an 8.9 magnitude quake, then getting hit with a tsunami right after. Tragic.
As for the markets, in yesterday’s post I said:
“Tomorrow [Tuesday] will be a key day as more traders will be at their desks and hitting the go-buttons. Below I mention the bears' breaking point to the upside, so the bears need to see that level hold and volume increase on moves to the downside if a larger downtrend is fact underway. …Watch for volume in conjunction with the price action.”
I wanted to focus on price action and volume because volume was tame on Monday with a whacky indecisive move in price which is usually followed up by a breakout on strong volume. The direction of that breakout should determine the short/medium term trend. Today you can see that we in fact did have strong volume on today’s decline at 1.28 billion NYSE shares. Advancers vs. decliners and up/down volume was not jaw dropping like I’d expect from a 3rd wave at various degrees, but the late day rally probably skewed those numbers a bit into the close for the bulls. Although the wave count in the S&P is not perfect, all signs point to lower levels ahead. I believe the buy-the-dip crowd is assuming the Japanese catastrophe and Libya unrest are only temporary speed bumps in a very healthy bull market, and are buying now for long term investments. This buying power is preventing a capitulation, or washout, which usually causes the market to bottom. So ironically, the buy-the-dip crowd might actually be facilitating and lengthening the decline. So today’s late day rally doesn’t concern me at all.
Get Bob Prechter’s Latest Elliott Wave Theorist Free Until March 21, 2011
The above count remains on track although far from ideal. And with the series of lower highs and lower lows being the trend right now, I’d stay short this market. Needless to say I’d really like to see all the recent swing highs remain intact until we get a nice clear 5 wave impulsive decline on the table. But ultimately 1325.74 remains the breaking point for the bears. Prices must stay below that level in my opinion if the bears want any chance of controlling this market longer term. There are several gaps left open the past few days so we’ll have to watch those when a sizeable bounce occurs. Every day for the rest of the week is a “POMO day” so there might be some buying power entering the markets midday. But without a solid rally with explosively bullish internals, I would treat any rally as a shorting opportunity. As long as 1325.74 remains intact, expect lower levels in stocks for the foreseeable future.
Learn Elliott Wave Principle
The euro made a new therefore negating the call for a top with an impulsive 5 wave decline. However the hourly chart shows a candlestick reversal pattern after making its new high. This is too short of a time for me as a swing trader, but for short term aggressive traders I see this as a short term short trade with a stop just above today's high as a good risk/reward trade. I'll be waiting for a 5 wave decline or a similar reversal pattern on the 4hr charts or bigger.
PLEASE NOTE: THIS IS JUST AN ANALYSIS BLOG AND IN NO WAY GUARANTEES OR IMPLIES ANY PROFIT OR GAIN. THE DATA HERE IS MERELY AN EXPRESSED OPINION. TRADE AT YOUR OWN RISK.
As for the markets, in yesterday’s post I said:
“Tomorrow [Tuesday] will be a key day as more traders will be at their desks and hitting the go-buttons. Below I mention the bears' breaking point to the upside, so the bears need to see that level hold and volume increase on moves to the downside if a larger downtrend is fact underway. …Watch for volume in conjunction with the price action.”
I wanted to focus on price action and volume because volume was tame on Monday with a whacky indecisive move in price which is usually followed up by a breakout on strong volume. The direction of that breakout should determine the short/medium term trend. Today you can see that we in fact did have strong volume on today’s decline at 1.28 billion NYSE shares. Advancers vs. decliners and up/down volume was not jaw dropping like I’d expect from a 3rd wave at various degrees, but the late day rally probably skewed those numbers a bit into the close for the bulls. Although the wave count in the S&P is not perfect, all signs point to lower levels ahead. I believe the buy-the-dip crowd is assuming the Japanese catastrophe and Libya unrest are only temporary speed bumps in a very healthy bull market, and are buying now for long term investments. This buying power is preventing a capitulation, or washout, which usually causes the market to bottom. So ironically, the buy-the-dip crowd might actually be facilitating and lengthening the decline. So today’s late day rally doesn’t concern me at all.
Get Bob Prechter’s Latest Elliott Wave Theorist Free Until March 21, 2011
The above count remains on track although far from ideal. And with the series of lower highs and lower lows being the trend right now, I’d stay short this market. Needless to say I’d really like to see all the recent swing highs remain intact until we get a nice clear 5 wave impulsive decline on the table. But ultimately 1325.74 remains the breaking point for the bears. Prices must stay below that level in my opinion if the bears want any chance of controlling this market longer term. There are several gaps left open the past few days so we’ll have to watch those when a sizeable bounce occurs. Every day for the rest of the week is a “POMO day” so there might be some buying power entering the markets midday. But without a solid rally with explosively bullish internals, I would treat any rally as a shorting opportunity. As long as 1325.74 remains intact, expect lower levels in stocks for the foreseeable future.
Learn Elliott Wave Principle
The euro made a new therefore negating the call for a top with an impulsive 5 wave decline. However the hourly chart shows a candlestick reversal pattern after making its new high. This is too short of a time for me as a swing trader, but for short term aggressive traders I see this as a short term short trade with a stop just above today's high as a good risk/reward trade. I'll be waiting for a 5 wave decline or a similar reversal pattern on the 4hr charts or bigger.
PLEASE NOTE: THIS IS JUST AN ANALYSIS BLOG AND IN NO WAY GUARANTEES OR IMPLIES ANY PROFIT OR GAIN. THE DATA HERE IS MERELY AN EXPRESSED OPINION. TRADE AT YOUR OWN RISK.
Monday, March 14, 2011
Stocks Stair-Step Lower; Euro Surges but Remains Short of New High
Internals today show medium bearish momentum behind the move today. The ups and downs are really quite normal in comparison to the price action today, but the key number here is volume. On the NYSE, only 963 million shares were traded. So although today's price action and internals were firmly bearish, there wasn't much consensus internally for the moves today. So tomorrow will be a key day as more traders will be at their desks and hitting the go-buttons. Below I mention the bears' breaking point to the upside, so the bears need to see that level hold and volume increase on moves to the downside if a larger downtrend is fact underway.
As for the short term, with a series of lower highers and lower lows on the table so far, I'm short term bearish this market. But without clear and definitive impulsive declines it's hard to get too excited in the medium and long term as a bear. Hopefully we'll get some clarity tomorrow. Watch for volume in conjunction with the price action.
Learn Elliott Wave Principle
The wave b triangle that was left on the table Friday is now so unlikely that it's practically eliminated from contention. That leaves the aggressively bearish count as top choice. With the series of lower highs and lower lows in place, it's possible this count represents that a series of several 1 and 2 waves are unfolding at varying degrees. If so, 1325.74 needs to remain intact for that scenario to unfold, so I remain bearish as long as the S&P stays below that level. Ideally, the market should rally little from here. At this point with all the choppy movement with a downward bias, the bears would ideally like to see a sharp move lower to resolve these proposed 1 and 2 waves at various degrees with a sharp downward 3rd wave. I know that may sound confusing, but the bottom line is that a sharp move down on strong volume real soon would put the longer term bearish wave count in a strong position.
Big Advantages of Trading with the Wave Principle
The euro has rallied much more than expected. If the euro has started a downtrend from the March 7th high, then 1.4029 obviously must remain intact. But with the euro so close to that level it's tough to be confident it will hold. That doesn't mean I'll turn bullish if the level is exceeded. I'm long term bearish the euro so I'll be looking for shorting opportunities only. If 1.4029 is broken I'll sit on the sidelines until signs of another top present themselves.
PLEASE NOTE: THIS IS JUST AN ANALYSIS BLOG AND IN NO WAY GUARANTEES OR IMPLIES ANY PROFIT OR GAIN. THE DATA HERE IS MERELY AN EXPRESSED OPINION. TRADE AT YOUR OWN RISK.
Thursday, March 10, 2011
1 Count Down, 2 Left; Euro is Bearish
The breakout I mentioned yesterday sure came true today as an across the board bloodbath took place right from the jump this morning. Headlines in some major financial media outlets said that poor US data was the reason for the slide, but I noticed the US futures were down big early last night, well before that data came out. Wavers didn’t need a crystal ball to predict this breakout, they just need to count the triangle and play the sharp move that was imminent. The breakout to the downside today broke through my key level of 1294.26 by just a hair which eliminates the bullish scenario calling the recent action a 4th wave triangle. Now there are only two scenarios left, both of them are listed below.
As for the internals, as one would think, they were very bearish today. There were 2,037 more decliners than advancers on the NYSE, and 447 more advancers on the S&P. 89.6% of total volume on the NYSE was to the downside, and total volume surged today compared to yesterday coming in at 1.15 billion shares compared to yesterday’s 870 million shares. So the market was solidly bearish and the momentum is in the bears’ corner right now. But the past several months this hasn’t led to much follow-through from the bears. The bears come in for a day or two and then the bulls easily takeover and push the market to new highs. So again we’re left with a test of the bears’ will. Knowing the preferred wave counts will help us determine what to look for to see if the bears have what it takes to control this market over indefinitely.
Above is the Minuette wave (b) triangle I listed yesterday. This is far from an ideal triangle so it makes this a big shaky as far as probability. The 5 wave decline we see is Minuette wave (c), and might have a little more downside movement tomorrow before it bottoms, most likely completing Minute wave ((iv)), then rallying to new highs to complete Minor wave 5 of Intermediate wave (C) of Primary wave ((2)).
Learn Elliott Wave Principle
This next count is very aggressively bearish, but much like the triangle count listed above, this count here is not perfect either. Submicro wave (2) is shorter than Miniscule wave 2 which is one degree smaller. This is not typical for impulsive waves, so it makes this count a bit questionable. However the market doesn’t unfold perfectly, and this count does not violate any EWP rules so it still remains a possibility. Under this count, stocks are at the beginning of a major downtrend that will take the S&P down at least 50-100 points from current levels. If correct, there should be heavy selling in the next few days since this is a 3rd wave at 3 different degrees of trend.
Big Advantages of Trading with the Wave Principle
The euro’s upward correction last night was very weak, much weaker than expected, and it fell hard into today’s close making fresh new lows along the way. This could mean that the new downtrend starting is very strong where upward corrections will be short, and shots lower will be steep. I’m seeing a few 5 wave moves to the downside so that keeps me bearish.
PLEASE NOTE: THIS IS JUST AN ANALYSIS BLOG AND IN NO WAY GUARANTEES OR IMPLIES ANY PROFIT OR GAIN. THE DATA HERE IS MERELY AN EXPRESSED OPINION. TRADE AT YOUR OWN RISK.
Wednesday, March 9, 2011
Stocks About to Explode, Play the Breakout; Euro Dropped in 5 Waves
The market did nothing today as far as price action goes as it continued to consolidate in a tighter and tighter range, typical of a triangle pattern. Volume also continues to decline as the range in price gets tighter, also typical triangle behavior. Other than that, nothing of note to report. The price action and internals suggest a triangle is finishing up and will result in a sharp breakout.
Above is the 4th wave triangle I talked about yesterday. This scenario now seems more likely after today's very tight range on light volume. It's certainly not the perfect triangle, but more subdivisions in the coming hours/days may make us adjust the labels a bit. But the end result will be the same, i.e. a sharp thrust to higher to a new high on the year. Adhere to the levels I mentioned in yesterday's post for my opinions on guidance to trade with.
Learn Elliott Wave Principle
EWP states that triangles only occur in 4th, B and X waves. Since I've already discussed the 4th wave, and the X wave is almost impossible here, I thought I'd show the B wave triangle. Here we'll see a sharp thrust lower for wave ((c)) which will probably end the downward correction and lead to new rally highs eventually. I'm unsure how this fits into the bigger wave count so I'm not considering it yet. But it is something to be mindful as we move forward, just in case we get a sharp downward move, those of us waiting for a big 3rd wave here should keep this count in mind in order to keep us honest while trading.
Again, the 1-2, 1-2, 1-2 count is still on the table but less likely. We should soon get a sharp thrust in either direction and it will help us eliminate one of the above counts. But the tightening action of price and volume suggest a big breakout either up or down is about to occur, so being setup to take advantage of a sharp move in either direction seems wise here. Option players might want to think about a "straddle" here.
The euro followed my forecast yesterday for one more new low to give us a nice 5 wave decline from the high. So far my gut instinct has paid off and now we have solid EWP evidence a top is in. I'm a seller on rallies as long as 1.4035 remains intact.
PLEASE NOTE: THIS IS JUST AN ANALYSIS BLOG AND IN NO WAY GUARANTEES OR IMPLIES ANY PROFIT OR GAIN. THE DATA HERE IS MERELY AN EXPRESSED OPINION. TRADE AT YOUR OWN RISK.
Tuesday, March 8, 2011
Stocks: To Triangle, or Not to Triangle; Euro Almost Completing 5 Waves Down
Internally the market was very bullish today in and of itself, however volume was very light and it did not match the bears’ intensity to the downside yesterday. Today the NYSE had 1,526 more advancers than decliners while yesterday had 1,608 more decliners than advancers. Today’s S&P advancers over decliners were about the same as yesterday’s so that’s a neutral result. Volume on the NYSE’s down-day yesterday was 1.03 billion shares while today’s up-day was only 987 million shares. Also, price today did not recover all losses from yesterday. So the bears held on to slight advantage by the skin of their teeth.
The aggressively bearish count above is not looking good from a probability standpoint. There are just too many wave 1s and 2s in place. From my experience, when I start counting a lot of 1 and 2 waves at various degrees it’s because I’m going against the trend, and trying to justify choppy price action with 1 and 2 waves. Although the above count is sound as far as EWP is concerned, it seems a bit unlikely. Only a very aggressive shot lower tomorrow, while not breaking above 1327.68 in the morning, would move this count up in probability.
Learn Elliott Wave Principle
The above count suggests a triangle is underway, and it would definitely explain the very choppy sideways nature of this market lately. Without breaking out to a new low or new high for about two weeks now, it makes this count more likely. A break below 1302.58 would put this count in severe jeopardy, while a break below 1294.34, or break above 1332.28, would completely eliminate it.
So to give you the bottom line, in order to take a position short term we need to know what the possibilities are, and I listed the top ones above. Staying within the levels I mentioned the triangle requires means that a very sharp shot higher to new highs on the year will be on the way once the triangle is completely. Of course, we’d like to get long with a stop just below 1302.58 or 1294.34 (depending on risk tolerance) in anticipation for the shot higher. However a break below 1302.58, and especially 1294.34, would eliminate the triangle and make the more aggressively bearish count more likely and therefore suggest a short position is preferred.
Big Advantages of Trading with the Wave Principle
The euro continued to fall last night as I would have wanted it to after taking a bit of a gamble on a short term short trade once I saw some subtle topping behavior yesterday. Even though we only have 3 waves down so far from the high, we only need one more new low to make the decline 5 waves. Doing so would be solid evidence that a top was in place and that we should favor the short side indefinitely. A break above 1.3956 before making a new low would cause some overlap and make this count invalid.
PLEASE NOTE: THIS IS JUST AN ANALYSIS BLOG AND IN NO WAY GUARANTEES OR IMPLIES ANY PROFIT OR GAIN. THE DATA HERE IS MERELY AN EXPRESSED OPINION. TRADE AT YOUR OWN RISK.
Monday, March 7, 2011
Bears Showing up for a Fight; Euro Shorting Opportunity for Aggressive Bears
I'm very short on time but am posting this since some significant developments occurred today.
Internals were very bearish again today, and on a Monday no-less, which has traditionally been owned by the bulls. The internals weakness along with some small 5 wave counts on the smaller timeframes and the breaking down of 1312 at today's close make it an interesting play for the bears here.
1312 was taken out today at the close, erasing that big bullish surge last week and triggering a short position on my part. Under this count above, a series of 1s and 2s are unfolding and should soon give way to a wave 3 at several degrees which essentially means a sharp almost straight line down. As long as 1327.68 remains intact, I feel comfortable being short here, a break below 1294.26 will make me extremely comfortable.
Learn Elliott Wave Principle
The alternate wave count that I'd like to see eliminated very quickly is the bullish triangle scenario above. Under this interpretation we'll see more up-down action for a net sideways move that will result in a sharp thrust higher to new highs on the year. A break below 1294.26 will negate this triangle and get me even more short this market.
EURO
As for the euro, today's reversal looks nice but didnt' really break any key levels or support. But the action in the AUD/USD and GBP/USD on the other hand, looks very bearish. I took an aggressive stance and shorted the euro on today's weakness against the recent highs. With stocks looking poised to possibly fall hard and the euro overbought, I thought I'd take a shot. But right now this is more of a calculated gamble with a very small position rather than calling a solid top and putting in a big long term position.
PLEASE NOTE: THIS IS JUST AN ANALYSIS BLOG AND IN NO WAY GUARANTEES OR IMPLIES ANY PROFIT OR GAIN. THE DATA HERE IS MERELY AN EXPRESSED OPINION. TRADE AT YOUR OWN RISK.
Sunday, March 6, 2011
Waiting for the Breakout in Stocks; Euro Still in Bull Mode
Thursday I said that the bears needed to get to work Friday if they wanted any chance to take over this market in the short/medium term. They did in fact make an attempt and pushed the market down hard but failed to match the internal intensity the bulls had the day before, and failed to convincingly erase the bulls' gains or take out a key level. So although the bears made a valiant attempt to roar back, so far it has failed to result in anything to convince me that they've taken back control of this market.
I want to see the 1312 level taken out and closed beneath in order for me to get short again. That's the breakout level from Thursday that started the surprise bullish run up to a new high. If the bears can get a close beneath 1312 it will tell me that the run higher was just a correction and that all that bullish momentum behind it was erased and that it was a failed push higher. That would indeed get me bearish and short again.
However, if the 1332.28 level is taken out to the upside then that might get me bullish and long this market for a very short term trade. The bears have failed to convincingly reclaim this market, and the bulls have really taken the reins and pushed this market higher so a new high above 1332.28 will erase all doubt in the uptrend in my view and get me long for the short term.
Learn Elliott Wave Principle
The euro keeps pushing higher and I see no evidence of a topping process occuring. So the euro's uptrend remains well intact. One thing to be aware of is that the 4hr RSI is at a level that has previously marked tops as you can see from my chart above. This doesn't mean that the euro will top right now though. All it means is that it's starting to get a little overbought, and longs should be cautious and alert here. Since the larger trend is still down in my view, I'm simply waiting for signs of a top to get short.
Breaking News Bulletin: News Is NOT the Main Driver of Stock Market Trends
PLEASE NOTE: THIS IS JUST AN ANALYSIS BLOG AND IN NO WAY GUARANTEES OR IMPLIES ANY PROFIT OR GAIN. THE DATA HERE IS MERELY AN EXPRESSED OPINION. TRADE AT YOUR OWN RISK.
Friday, March 4, 2011
Thursday, March 3, 2011
Bulls Gut Punch Bears, Obtain Full Control of Stocks; Euro Looks Higher
The market rallied today as expected. But it rallied much stronger and higher than I expected. Does this look and feel like a Primary wave ((3)) decline folks? Not to me. But let’s focus on the short term since that’s the best strategy in my view. Internals on this rally were extremely strong, the bulls had full control from the start of the trading day to the end. Advancers and up volume crushed the bears today and total volume was also solid. It’s days like today that often put a floor in the market for days/weeks. So be ready for more upside if the bears don’t show up Friday.
The major indices made new highs today so I’m on the sidelines again. Only a big time bearish reversal to the downside Friday that erases what the bulls did today would get my attention again on the short side. But right now, the bulls have control. Tomorrow will be an important day for the markets.
Learn Elliott Wave Principle
Since the market did not break above February’s high, the bearish count technically remains intact. However my experience tells me it’s extremely unlikely this count will pan out, unless the market tanks hard tomorrow to erase today’s bullish move. The correction for Micro wave ((2)) is now too long and deep for my comfort, and the fact that the bears flexed their muscles last week and created all kinds of bearish evidence and yet still could not defend this week’s highs tells me the trend is still up.
So it’s quite possible the decline last week was a Micro ABC, and this week’s action is part of a 1-2 sequence (i and ii). We’ll know soon which count is correct. I’m on the sidelines for the moment, but follow through higher tomorrow would probably get me in on the long side.
Last week I showed this chart with the big daily bearish engulfing candle. Today you can see that this bearish formation has now been erased. It blows my mind how many times the bears get great setups in wave counts, optimism, momentum, and basic chart studies and yet the bulls come in and erase them all with ease in short order. But hey that’s the market, and that’s also a sign that the trend remains firmly up. I’m not getting in this market’s way on the short side unless the bears can step up Friday.
Breaking News Bulletin: News Is NOT the Main Driver of Stock Market Trends
The euro has been flip flopping all over the place with 3 wave rallies and declines for the past several months now. The big strong moves the past couple days and new high this week leave me thinking 1.4250 will be challenged and broken soon as well. The decline from that area a few months earlier looks more like a 3 wave move than a 5 wave move, so I think that area is vulnerable to be taken out at the moment. With the longer term trend still down I don’t like getting long here, but I’m certainly not getting short here while it’s in full bull mode. So much like stocks, I’m on the sidelines for now.
PLEASE NOTE: THIS IS JUST AN ANALYSIS BLOG AND IN NO WAY GUARANTEES OR IMPLIES ANY PROFIT OR GAIN. THE DATA HERE IS MERELY AN EXPRESSED OPINION. TRADE AT YOUR OWN RISK.
Wednesday, March 2, 2011
Stocks Correcting; Euro to Fall any Time
The market had trouble finding its legs today, but with 5 waves down possibly complete right now, the floppy nature of the price action and internals closing quite favorable to the bulls on a flat day, I’d have to say that we’re probably in a bullish correction sequence here, possibly for the rest of the week. Volume was a bit light at 1.02 billion NYSE shares, but despite the bulls’ lack of momentum and the flat close on the day, there were a lot more advancers than decliners on both the NYSE and S&P. Plus, up volume well exceeded down volume on the NYSE. Not exactly a show of force and control by the bears if the short term downtrend is still intact. The internals’ data suggest we’re probably in an upward correction right now that may last a day or two.
The wave count supports what the internals are telling us. With 5 waves down counted complete, we should get a series of 3 wave moves to complete Submicro wave (2). Right now the 3 wave rally that just completed is too small in price and time to make it likely to have completed Submicro wave (2). Plus with the internals still strong, it suggests more subdivisions higher. I’m projecting a “combination correction” in the form of at least a WXY at the moment. This should take us to the end of the week and possibly early Monday. 1332.09 remains the key level for the short term bears in my view. That level must remain intact for us to have strong confidence that a longer term downtrend is underway.
Learn Elliott Wave Principle
The euro finally made a new high. I want to stand aside and wait for signs of a top and reversal before I attempt another short position. The larger term trend is still firmly down, but the short term trend appears to be up for the moment. Waiting for the short term bulls to give way to the long term bears again seems like the best option at the moment.
PLEASE NOTE: THIS IS JUST AN ANALYSIS BLOG AND IN NO WAY GUARANTEES OR IMPLIES ANY PROFIT OR GAIN. THE DATA HERE IS MERELY AN EXPRESSED OPINION. TRADE AT YOUR OWN RISK.
Tuesday, March 1, 2011
The Evidence is Strong that the Stock Downtrend has Resumed; Euro Looking Vulnerable
The market fell hard most of the day suggesting Micro wave ((3)) is now underway. Volume was solid at 1.2 billion shares on the NYSE, but not jaw-dropping. Nonetheless, down volume crushed up volume, there were 1,574 more decliners than advancers on the NYSE, and 427 more decliners on the S&P. So quite a bearish day internally, and after a trailing off bullish push the past couple days, it looks like today’s action was a sign of a trend change to the downside now.
The S&P stopped just shy of the 78.6% Fibonacci retracement level I mentioned yesterday. The target level I wanted to get short was between 1315-1320, and anything above. So far, that call is in the profit. I would like to have my stop just above today’s high. But more conservative traders might want to keep their stops just above 1344.07 until we get a new low beneath 1294.26.
In reference to last week’s lows in stocks, Monday I said, “The Nasdaq Composite did not confirm the last new low in the Dow and S&P and the market has been in rally-mode ever since. I'll be looking for another such divergence, only reversed, to mark a top.” Today we got that divergence I was looking for. You can see from the red lines on my S&P and Nasdaq charts (blue lines mark the divergence at the low). Divergences like these often accompany reversals in trend. So here’s another check market to put in the bearish column.
Learn Elliott Wave Principle
As you can see above, the Dow, S&P and Nasdaq Composite all topped out between their 61% and 78% Fibonacci retracement levels. These two levels are textbook EWP typical stopping levels for second waves. So again, the evidence mounts on the bearish side.
Lastly, today’s daily candlestick in the S&P created a huge bearish engulfing pattern where today’s high was above the previous candle, and yet today’s close was below the previous candle’s intraday low. This pattern often occurs at reversal points as well.
So there you have it, on a silver platter….ready for the bears to gobble it up. Nothing is guaranteed in this business though, it’s all about probabilities. And right now the probabilities definitely favor the bearish side. So I would still trade cautiously and with a solid risk management plan. No matter how good the setup is, it can still be wrong…..plan accordingly.
When You FEEL the Elliott Waves, Your Eyes Become Wide Open
How the waves of social mood led to an investment method worth looking into
-Elliott Wave International
Still no new high for the euro, yet the US dollar has made a new low. Looking at how weak the euro’s price action has been this week, supplemented by the diverging RSI on the 4 hour chart, it looks like this pair might not make that new high. But I don’t want to jump the gun here since I don’t have any evidence of a top in the euro. So I’ll wait for a close below 1.3700 before I get short again. But looking at the price action here and the overstretched rallies in oil, gold and silver, I think a close below 1.3700 will happen sooner rather than later.
PLEASE NOTE: THIS IS JUST AN ANALYSIS BLOG AND IN NO WAY GUARANTEES OR IMPLIES ANY PROFIT OR GAIN. THE DATA HERE IS MERELY AN EXPRESSED OPINION. TRADE AT YOUR OWN RISK.
Monday, February 28, 2011
Stock Rally at Good Reversal Point; Euro Still Has New High Ahead
The market has rallied as expected. The Nasdaq Composite did not confirm the last new low in the Dow and S&P and the market has been in rally-mode ever since. I'll be looking for another such divergence, only reversed, to mark a top. Above you can see the wave count and that the S&P is in between two common fibonacci levels for 2nd waves to stop at (61% and 78%). Internals today are still quite strong but it's too early to just give it all to the bulls the rest of the day. I'll be looking for signs of a reversal both internally, and in the price action today.
Learn Elliott Wave Principle
The Dow on the other hand is having trouble getting above its 61% fibonacci retracement level suggesting this index may be topping right now. I don't see any other signs of that at the moment though, so this behavior here is simply just something to watch at the moment. The S&P might want to push into its 78% retracement level which should get the Dow to a new high on the day, so calling "top tick" here doesn't seem wise. But the behavior both in price, internally, and momentum is worth watching in the indices right now since they are in fact at levels that normally market tops and reversals if the larger trend has indeed turned down.
When You FEEL the Elliott Waves, Your Eyes Become Wide Open
How the waves of social mood led to an investment method worth looking into
Elliott Wave International
As I've said before, the euro is not tracing out clear elliott wave patterns so I'm stuck with the basics on this pair. Seeing a 3 wave drop 1.3863 it is clear that at least one more new high above that level must be achieved before looking for a top and reversal. The pair made it within pips of making that new high last night, but so far is left just shy of doing so. I still think we'll see another push to above 1.3863, although coming below 1.3700 would put that into some doubt.
PLEASE NOTE: THIS IS JUST AN ANALYSIS BLOG AND IN NO WAY GUARANTEES OR IMPLIES ANY PROFIT OR GAIN. THE DATA HERE IS MERELY AN EXPRESSED OPINION. TRADE AT YOUR OWN RISK.
Subscribe to:
Posts (Atom)