Friday, May 28, 2010

Strange Day Today, How do we Weigh the Evidence?


So today was a strange day since I expected buyers to push this market higher into the long weekend on light volume so money managers could inflate their books for an otherwise horrible month for stocks. But that didn't happen obviously. Instead, once the Spain downgrade news hit the floor the market tanked, rebounded a bit which nearly got the NDX to a new high before violently selling off into the close near the lows on the day. The sharp selloffs late in the day ARE in fact characteristic of what we can expect from a wave (iii) of 3 of [3] or C. Plus the wave structure counts complete very easily at this juncture with a WXY double zig-zag correction composing wave (ii). Whether it complete or not, you can easily see that this rally looks very labored, and is not unfolding impulsively. So I have high confidence that this rally starting this week is just a correction.

With that said, there are a few problems concluding with high confidence that wave (ii) is complete:

1) Today was the end of a horrible month for stocks, so perhaps anyone who made a little gain on this recent wave (ii) rally would want to lock those gains in for the month of May on their books. This would result in another buying spree early next week when the new month starts.

2) There's a 3 day weekend and investors are still spooked, and with the Spain news hitting the wires late in the day, no one wanted to be caught fully long on a 3 day weekend where more news can come out and wipe people out next week. This is also evidenced by the VIX which surged 8% on the day, suggesting that investors are still nervous and buying put options to protect positions over the weekend. But if nothing happens over the 3 day weekend, it may mean the buying spree continues next week into at least the 1105-1120 range I cited yesterday.

3) The market declined in a series of 3 wave drops this afternoon, suggesting this is just a correction. I looked at some of the other main indices to try and see if any made a new high, which would create a divergence and therefore explain why the S&P and Dow did not make new highs after their corrective looking decline. But only the Nasdaq 100 came close to making a new high, falling less than a point short of that new high. It's possible to count the decline as a "leading diagonal", but that is unlikely to be the structure that kicks of a wave 3 at multiple degrees.

4) Despite the Friday before a holiday weekend, volume was fairly strong considering the circumstances. So how does that factor in? Unfortunately I'm not sure, but I thought it was interesting that there was some volume on the board today.

Unfortunately there are too many "X factors" and inconsistencies in the overall outlook at this point to conclude with high certainty that wave (ii) has ended. But we should know soon enough on Tuesday when trading resumes. A wave (iii) of 3 of [3] or C should be unmistakeable in structure as it should practically be a straight line down. Anything short of that would most likely mean this was just the start of a mild correction before we make new highs into the 1105-1120 zone I mentioned yesterday. It would take a break of 1066 in the S&P cash index to significantly strengthen the evidence that wave (iii) of 3 of [3] or C is underway. Until then, I'll expect the market to climb higher where I'll add to my short positions on the way up with my stops placed just above 1174.


PLEASE NOTE: THIS IS JUST AN ANALYSIS BLOG AND IN NO WAY GUARANTEES OR IMPLIES ANY PROFIT OR GAIN. THE DATA HERE IS MERELY AN EXPRESSED OPINION. TRADE AT YOUR OWN RISK.

Thursday, May 27, 2010

Wave (ii) Continues


The above chart is of the daily S&P cash index. It shows how simple candlesticks can tell us what the crowd is doing. Tuesday the bears pushed the market down heavy, but the bulls sharply reversed that, creating a bullish reversal candlestick. After a small setback yesterday, the bulls regained firm control of the market today with about 3% gains across the board. Does it feel like a wave 2 yet? I'd sure say so. This wave 2 should alleviate the large amount of pessimism and panic that wave (i) of 3 of [3] or C created and get those cartwheeling blindly optimistic bulls back on CNBC talking about "great values" again.

Also notice on the above chart that strength is still showing in the candlestick formations. After a big reversal day Tuesday, today the market closed up big on its highs. This suggests we have a bit further to go for wave (ii) to end.


So far, I'm counting wave (ii) as a double zig-zag. It can always morph into a triple zig-zag, but I'll make the market prove that to me. The market closed above 1100 today so I'm already dipping my toe into the short side again with a stop just above 1174. The market has strong resistance to break through in the 1105-1120 range due to fibonacci retracement levels, and prior congestion areas. There's also an open chart gap at 1115 that will probably be filled before wave (ii) ends, so I'll be watching that level carefully.

So right now, it appears that wave (ii) is going to push higher and at least get into the solid resistance range of 1105-1120 quite soon. The action of the market around that area may help us determine how mature wave (ii) is.


PLEASE NOTE: THIS IS JUST AN ANALYSIS BLOG AND IN NO WAY GUARANTEES OR IMPLIES ANY PROFIT OR GAIN. THE DATA HERE IS MERELY AN EXPRESSED OPINION. TRADE AT YOUR OWN RISK.

Wednesday, May 26, 2010

Wave (ii) Has Two Equal Interpretations


The market rallied in the morning but had no follow-through, then reversed sharply into the close. Although the reversal has only created 3 waves from today's high, it definitely has the possibility of morphing into a larger 5 wave impulsive decline. Above are the internals that were flipped from very strongly bullish, to closing the day practically flat.


BEARISH COUNT


The above count suggests that wave (ii) is already complete after getting to the prior 4th wave area of 1090. This means that wave (iii) of 3 of [3] or C is now underway. There should no mistake about this wave as it should be practically a straight line down. Anything short of that type of behavior tomorrow would make this count highly suspect. The opportunity here is great for the bears with a great shorting opportunity for huge profits and minimal risk as stops can be placed just above today's highs. So the key to determining if this count is correct is if today's highs remain intact, and if the market undergoes absolutely fierce selling very soon. If not, then the short term bullish outlook below will be the most likely count.


BULLISH COUNT


The fact that the internals of the market still closed somewhat flat despite the big down move at the close makes me think this short term bullish count is also a strong possibility as well. This count also supports the time element associated with wave (ii) compared to wave (i). Since wave (ii) would have completed after about 1 1/2 days of trading for the bearish scenario mentioned earlier to occur, it weakens its probability a little bit. But since this is a wave 3 of [3] or C we're in now, that type of short rallying is quite possible. Regardless, the above short term bullish count is possible as well, and it will become my top count if the market doesn't tank hard tomorrow. This would suggest that wave (ii) is still underway, and after wave X bottoms, another 3 wave ABC rally will occur above today's highs, most likely well into the 1100s.

So there you have it. If the market just absolutely tanks tomorrow, then the bearish count first mentioned is the most likely scenario. But if the market doesn't tank hard tomorrow, then this bullish count will get priority.


PLEASE NOTE: THIS IS JUST AN ANALYSIS BLOG AND IN NO WAY GUARANTEES OR IMPLIES ANY PROFIT OR GAIN. THE DATA HERE IS MERELY AN EXPRESSED OPINION. TRADE AT YOUR OWN RISK.

Tuesday, May 25, 2010

Wave (ii) of 3 of [3] or C is Underway


The market surged lower in wave v of (i) early this morning with extremely weak internals making me think that possibly my primary count might be wrong and that we're in some degree of 3rd wave. With that in mind, I was looking for continuation to the downside with the same internals and strong volume the rest of the day in order to confirm that hunch. The opposite happened though. There was absolutely no follow through after this morning's drop and the market spent all day working higher with increasingly bullish internals and strong volume. So the primary count I listed yesterday remains on track. Wave (i) has completed and now a wave (ii) rally is underway. The first target is the prior wave 'iv' area around 1090. But since it's a second wave it probably will be a bit deeper than that. So I'm looking at the 1115 level for perhaps a better stopping point. We'll get a better idea of when this thing may top as the structure unfolds.

The key level for the bears is 1174. As long as that remains intact, I see this current rally as an excellent opportunity to establish, or add, short positions to catch a wave (iii) of 3 of [3] or C, which would of course be a massively fast and strong decline. But the market must stay below 1174, otherwise it will look more like a 3 wave decline from the highs on the year which suggests the market will continue on higher from there to make more new highs.


Above is a daily chart showing the S&P's reversal today that created a bullish reversal candlestick. There has been a lot of support at this level over the past few months as you can see. But what's important is that for the first time, the S&P broke the series of higher lows it's maintained since the March 2009 low. Outside of using EWP, that's one of the first signs that a trend is broken. So if this wave (ii) rally is capped below 1074 and then reverses to break today's lows in the future, it will be yet another great indicator that will strongly bolster the view that the big wave [3] or C is underway. But in the short term, the wave count and the above daily candlestick, have the market appearing to be in rally mode for a little while.


And lastly, above is the count no one wants to talk about, or think about. Above is the very bullish possible alternate count. As long as the market stays below 1174, then this count is not likely. There is just too much technical evidence that the larger uptrend from the March 2009 lows has exhausted so this count has no merit unless the market can prove that it does. It will only prove it has merit if it can get the S&P above 1174.

On a psychological note: I noticed this morning as the futures were down heavy that there were a lot of doom and gloomers on CNBC. This normally gives me pause and has me thinking about covering some or all of my shorts. But because we might be in a large wave [3], I know that we may get that kind of psychology through a lot of the move down, especially when we reach the "point of recognition" which will be at a wave 3 at mutliple degrees. But today that hunch proved right as the market was just too oversold, and the news and mood just too negative to sustain further losses. This wave '(ii)' rally will have to alleviate that doom and gloom mood before wave '(iii)' can start. But what's interesting is that I'm already seeing signs of it today. Carter Worth on CNBC already told people to start buying and that support has been reached, and other folks are "buying the dip" and suggesting we're in a range now. Once we get toward the wave '(ii)' top we should see most people on financial news talking again about all the stocks they're buying and focusing again on the so called "Recovery", without much regard for the downside risk. Then we'll know that wave '(ii)' is in it's last throws. So be on the lookout for the bulls to regain confidence and get blindly optimistic again in the financial media. That will be another que to start getting short again, in my opinion.


PLEASE NOTE: THIS IS JUST AN ANALYSIS BLOG AND IN NO WAY GUARANTEES OR IMPLIES ANY PROFIT OR GAIN. THE DATA HERE IS MERELY AN EXPRESSED OPINION. TRADE AT YOUR OWN RISK.

Is Today's Decline a 5th Wave as Forecast?


The market continued lower this morning, right on track with my two top counts posted yesterday, although the internal weakness of this market suggests the alternate count for a "flat correction" is most likely not valid anymore. The 2nd alternate (bullish) has been completely eliminated. The primary count suggests this current decline today is wave 'v' of '(i)'. But looking at the internals of the market I'm not so sure of that anymore. As you can see above, the NYSE has 92% of its stocks trading to the downside, 93.7% of volume to the downside, and only 14 stocks in the S&P 500 trading higher today. This is a very weak market, across the board selling, with the bears firmly in control. This is not typical of a 5th wave which should have more moderate internals that diverge from the very weak internals of wave 'iii'. Today's internals are more like a 3rd wave. It's POSSIBLE that what I have labeled as wave 'iv' is actually a wave 'ii' and we're in wave 'iii' right now. So that's something to consider.

The action of the market later today and into the close will be important. If the market can rally back strongly and improve the above internals on solid volume then it's quite likely today's decline was in fact wave 'v' as charted above, and that a fairly large wave '(ii)' rally will be underway soon. If the market closes on, or near, its lows on the day then I might have to rework the count to make it much more aggressively bearish in the short term.

More later.


PLEASE NOTE: THIS IS JUST AN ANALYSIS BLOG AND IN NO WAY GUARANTEES OR IMPLIES ANY PROFIT OR GAIN. THE DATA HERE IS MERELY AN EXPRESSED OPINION. TRADE AT YOUR OWN RISK.

Monday, May 24, 2010

Market Tried Popping, then Dropped

Primary Wave Count


The market dropped early in the morning but spent most of the day rallying after that which flipped a triple digit Dow loss into a gain by late morning. But in the last half hour of trading, the bears came roaring in and pushed this market down. The rally today was extremely weak as you can see it looks like an ending diagonal-type structure, and the internals on the move higher were nothing to get excited about. The last half hour though destroyed the bulls' hopes and the internals quickly went quite negative into the close as the market closed on the lows and took back all of Friday's gains. Also keep in mind that Friday's crazy late day rally and huge volume could easily be due to options expiration occurring that day, and that Mondays have been very bullish the past several months. So today's feeble push higher and reversal to close on the lows speaks loudly as to the strength of the downtrend, and that the bulls are tired and getting smaller in numbers.

There are three ways to view the current short term structure in my opinion and I have them listed in priority of likelihood. Please click here to view the larger degree wave count in yesterday's post. The above chart is a closeup S&P chart of the past 3 trading days. It's possible to count the correction complete today with wave C of 'iv' being an ending diagonal, but today did not exceed wave the wave 'a' high so it's a bit suspect. However if wave C is an ending diagonal, then it implies that the rally was extremely weak, and it would explain why it couldn't muster up a new high to begin with. So it does remain quite possible. Plus, the intensity and speed of the selling into the close does look and feel like the larger downtrend has resumed. Under this count, we should see continued selling tomorrow to complete wave 'v' of '(i)' that will go to below 1055.90. A break above 1090.16 would negate this count, while a break below 1070.31 would increase this count's likelihood.


First Alternate Count


The above count is my alternate count showing that a "flat correction" is underway. This is because wave 'a' is composed of three waves up, and that today's high did not exceed the wave 'a' high, suggesting that perhaps there's more upside to go for wave 'iv'. If this count is correct, we should see the S&P break below 1055.90 where it should soon reverse and rally sharply in a wave 'C' to complete wave 'iv' just above 1090.16.

So both counts suggest weakness to new lows in the very short term. In order to discern between the two counts I'll look at the internals and wave structure. Extremely bearish internals combined with clear 5 wave patterns would have me conclude that wave 'v' is underway. Seeing as that 5th wave can be extended waves, and that the current wave 'iii' is not too long for a wave 3, it's possible that wave 'v' could really shoot to much much lower levels. Any lack of the above mentioned evidence would keep me on guard for the flat correction scenario and a sharp reversal after a new low beneath 1055.90.


Second Alternate Count


Lastly, here's my third most likely count, a bullish count. This would have been my first alternate count if it weren't for the fact that today's late day selling came with about 2 S&P points of the 1070.31 level that will negate the entire count. And seeing as that the momentum to the downside was increasing at the end of the day, it's quite likely the market will have a weaker open tomorrow morning that will break below 1070.31, negating this count. Plus, the wave 'ii.' of C correction is extremely deep here, and although possible, it's quite unlikely. Also, waves 'i.' and 'ii.' are quite long in time and price compared to the wave 'a' subwaves, so this count doesn't have EWP's "right look" either. But a sharp surge higher tomorrow on strong internals will put this count right up front since it's still possible.

So there you have my three top counts. I think it's important to keep the bigger picture in focus while trying to maneuver in and out of these short term moves which analysis of them is very speculative. The bigger picture suggests we are in a major declining phase in a wave (i) of 3 of [3] or C. I'd only be looking for selling opportunities and keep risk controlled.


PLEASE NOTE: THIS IS JUST AN ANALYSIS BLOG AND IN NO WAY GUARANTEES OR IMPLIES ANY PROFIT OR GAIN. THE DATA HERE IS MERELY AN EXPRESSED OPINION. TRADE AT YOUR OWN RISK.

Sunday, May 23, 2010

Monday Pop, then a Drop


It's been an extremely busy week for me and I'll finally be back to posting the usual posts in a more timely manner starting Monday.

Friday was a wild day and had monster volume with the Dow closing up triple digits. On the surface it looks like the bulls put in a bottom and might be back in control. But Friday was options expiration, so the big volume number is probably just attributed to that instead of a rush of bulls coming into the market. And the big triple digit Dow rally came in the last 30 minutes of trading, more in line with options expiration, or short covering into the weekend, rather than a big bullish move also. The late day rally also lines up well with the current wave count above. It shows wave 'iii' ended and now at least an ABC rally for wave 'iv' is now underway, if it didn't already finish on Friday. Despite that the futures are down right now in overnight trading (9pm PST), I feel Friday's late day rally will continue on into Monday as well, especially since Mondays have been bullish days for the past few months anyway. But the rally should be capped at 1115 in the S&P cash index since that's where wave 'i' ends, and more heavy selling to new lows should occur soon. If 1115 is broken, then the wave structure I have above is wrong, and the market is probably just subdividing lower which would actually suggest even more aggressively bearish moves to the downside. Only a break above 1174 would severely weaken the short term bearish case. So as long as 1174 remains intact, I'll be looking at counting the market from only a bearish perspective. Any rally tomorrow that remains below 1115 might be a good opportunity for the very aggressive bears to get short and put stops just above 1115.

So the key level for the above count to remain on track is 1115, and the key level for the overall short term bearish case remains at 1174.


PLEASE NOTE: THIS IS JUST AN ANALYSIS BLOG AND IN NO WAY GUARANTEES OR IMPLIES ANY PROFIT OR GAIN. THE DATA HERE IS MERELY AN EXPRESSED OPINION. TRADE AT YOUR OWN RISK.

Thursday, May 20, 2010

Market in Wave 3 and Various Degrees, Still More Downside to Come


Above are the internals showing the insanely bearish foundation of the market move today. Volume as a whole was huge on a big down move which is basically bearish in and of itself, down volume represented 98.6% of total volume, and 18.6 stocks were down for every 1 stock up, and the S&P only had 3 stock advancing. So it was a broad based 'sell everything' decline today. This is textbook EWP wave 3 internal structure. It also means that further declines are to come. Tomorrow is options expiration day so it could be another wild day. Today's late day selling and the financial news in panic mode right now, I can see a sharp decline tomorrow morning and then perhaps a rally to end the day. But this absolutely no time to get cute on trying to catch bottoms in my opinion. If anything I would be ready to where if there is a bounce higher, it might be an opportunity to sell into it. All my key levels I've mentioned over the past week have bee destroyed so I think this market is headed lower....much lower. The evidence that wave [3] or C is underway is very high right now. I'm looking to sell into any significant rally the comes about, but most likely that means I'll be waiting for wave (1) to end and will get short on the big wave (2) once it gets underway.


Above is a cleaned up chart with proper degrees of waves I feel are likely at the present time. This also fits in with my guess that tomorrow will give us a sharp selloff early and perhaps a rally at the end of the day since this count has us in a wave 'v' of '(iii)' of 3. So wave 'v' may shoot down tomorrow and lead to a somewhat muted or flat correction for wave (iv). This is merely a guess and in no way am I taking an short positions off the table in preparation for that, and I'm definitely not getting long this market at any time. All it means is that I'm ready and prepared for the volatility coming.

The market should be heading lower and I'd only be looking for short entries.


PLEASE NOTE: THIS IS JUST AN ANALYSIS BLOG AND IN NO WAY GUARANTEES OR IMPLIES ANY PROFIT OR GAIN. THE DATA HERE IS MERELY AN EXPRESSED OPINION. TRADE AT YOUR OWN RISK.

Market Should be in a Wave iii of (iii) of 3 of [3] or C

Market Internals


I was unable to access my computer and could only use my iPod to put up last night's post so I couldn't put up any charts or get too detailed. So I'm putting up an early post to make up for last night.

1149 remains key for the S&P cash index for the bears. I got a screen shot of today's market internals and you can see that in the NYSE and S&P that buyers are almost non-existent. Although it's early, if this holds up, it's definitely characteristic of a wave 3 at some degree. Barring a massive reversal today, the key levels I wanted to see taken out in the S&P have been destroyed (click here for original post).


15min S&P Cash Index Wave Count


The inernals so far show massive selling across the board which is indicative of a wave 3. The above chart shows that we could be in a wave iii of (iii) of 3 of [3] or C. So massive unrelenting selling is in order right now. The first support target is the lows made a couple weeks ago on that so called "error", which we knew was not true. The market is about to prove us right as it heads toward those lows at 1066 because it shows that the market really did want to go to that level and that it just wasn't an error.


S&P Cash Index Daily Chart


Above is just a look at the bigger picture through the daily S&P chart. You can see that there is still heavy selling to much lower levels on the horizon. 1149 remains key for the bears.


PLEASE NOTE: THIS IS JUST AN ANALYSIS BLOG AND IN NO WAY GUARANTEES OR IMPLIES ANY PROFIT OR GAIN. THE DATA HERE IS MERELY AN EXPRESSED OPINION. TRADE AT YOUR OWN RISK.

Wednesday, May 19, 2010

1149 is Key for the Bears

I'm unable to post a full update tonight. The bottom line is that the markets downtrend remains intact and I expect much lower levels in the coming days/weeks. As long as 1149 in the S&P cash index remains intact, I am comfortable being fairly heavily short. I should be able to do a normal post tomorrow, hopefully sometime in the morning.

Todd

Tuesday, May 18, 2010

Downtrend May Have Resumed

Primary Wave Count


The market shot up this morning to complete wave (ii) and spent the rest of the day declining. It was a very orderly sell off that steadily pulled the market down while floating the VIX higher. There was no 'panic', it was all well thought out and orderly selling. This type of behavior can be brutal to the bulls because a slow bleed usually has a hard time squeezing shorts and therefore bottoms and buying power are harder to come by. The market simply just trickles down lower and lower. If the above wave count is correct, there should be very little alleviation in selling. The market should be headed much lower, with the first target being 1066, but it should continue on down down down. The count remains valid as long as 1174 remains intact.


Much Less Likely Alternate Count


At first, watching today's slow and choppy decline had me thinking it had to be a 'B' wave within wave (ii), and that a strong wave 'C' rally above 1149 would complete wave (ii). But two things stood out that severely weakened this view:

1) The market closed the day with NYSE down volume representing 88.7% of total volume. I would expect a wave B to have up/down volume closer to break even, not overwhelming selling. This is more indicative of a wave 3 at some degree. So again, the top count looks more likely.

2) The market maintained a series of lower highs all day, and every attempt to snap a rally higher, especially into the close, had failed. A wave 'B' is usually a 3 wave affair, or some combination thereof, but today's structure does not resemble any 3 wave combination, more like an elongated impulse.

So although this count is still possible, it's a distant 2nd compared to my top count.

Stock Market Support Shelf


It appears that the 1120 level is a support shelf, at least temporarily, for the S&P cash index, and it closed right on it. Most of the other major indices also closed right around their support shelves as well. So the fact that this level didn't lead to a sharp rally, and in fact closed right on it, is a good sign that this support will be taken out fairly soon. Looking at the daily charts, there should be little support until it reaches the levels of "the big selloff" a couple weeks ago, which is 1066 in the S&P. So a strong break below 1120 should lead to a quick move to the 1066, and according to my top count, it will go much further below 1066 as well.


USD/JPY Support Shelf


Above is the USD/JPY (US dollar vs. japanese yen) I've been tracking the past few weeks since it looks very similar to the structure of the stock market. It trades 24 hours a day so it's good to watch overnight to perhaps give a clue to what will happen during the next cash index session in stocks. The USD/JPY also looks bearish at various time frames, and it also has a support shelf. So for those that don't follow the futures can follow the USD/JPY overnight to give a clue if perhaps the stock market's cash indices will follow suit once they open. FXCM has free real time charting at click here. Looking at the S&P futures right now, the June contract is trading around 1110, which is below its support shelf. Acceleration to the downside would be a good sign that the US cash indices will tank tomorrow too. But the futures have been down big overnight quite a few times in the past several days, and have almost always been completely reversed by the time the US session gets underway. So this is nothing to get too hung up on, but something interesting to follow throughout the night, be eventually the futures WON'T reverse.


PLEASE NOTE: THIS IS JUST AN ANALYSIS BLOG AND IN NO WAY GUARANTEES OR IMPLIES ANY PROFIT OR GAIN. THE DATA HERE IS MERELY AN EXPRESSED OPINION. TRADE AT YOUR OWN RISK.

Monday, May 17, 2010

Short Term Downtrend Extended, Now Correcting


The futures dropped big Sunday night but rallied back big time to start the US session in positive territory. Then the bears showed up again and pushed the market significantly lower in the morning only to see the bulls come back and push the market into a slightly higher close. It appears that a series of 1 and 2 waves have been unfolding since the top a couple weeks ago. Today's decline looks like a wave 'v', which was just a continuation and extension of the previous downtrend. I originally thought the 5 wave decline was completed Friday and wave (ii) was either done, or would be done soon. Today's 5 wave decline and sharp reversal means I need to alter the count a bit to have today being the end of the 5 wave decline composing wave (i). So now wave (ii) is underway, and it appears higher levels will be achieved tomorrow before wave (iii) of 3 of [3] or C gets underway. The market can turn down at any moment, and at this degree of trend it means it will be almost a straight line down. So I don't want to get too cute here. I simply want to be short now with stops just above 1174. If the market turns higher from here I'd merely look at that as an opportunity to get more short as long as it stays below 1174.


Above is a daily chart in the S&P that is bothering me a bit. It shows several candlesticks that have long wicks on their undersides showing the power of the bulls coming in and preventing the bears from maintaining losses into closes. Now this can be explained with EWP on the intraday charts by the series of one and two waves that unfolded from the top, but without EWP it would appear that strong support is forming around current levels. But a strong close beneath today's low of 1114.96 would be a big sign that EWP is prevailing and that these potential bullish candlesticks really don't have much potential at all.


PLEASE NOTE: THIS IS JUST AN ANALYSIS BLOG AND IN NO WAY GUARANTEES OR IMPLIES ANY PROFIT OR GAIN. THE DATA HERE IS MERELY AN EXPRESSED OPINION. TRADE AT YOUR OWN RISK.

Sunday, May 16, 2010

More Weakness Ahead


Not much new to add or project from what I've been posting last week. The five wave drop into Friday's low tells us that the larger trend is probably down. Seeing as that this may be a wave 3 of 3 of 3 or C means that the selling may be extremely intense. The late day rally from Friday I tentatively labeled wave C of ii. It's quite shallow so I think it's quite possible for a much deeper sharp rally Monday to finish off wave ii. However looking at the S&P futures down double digits this evening makes me want to possibly count wave ii complete already, and that wave iii of (iii) of [3] or C might possibly get underway Monday.

1174 in the S&P cash index remains key for the short term bears.


PLEASE NOTE: THIS IS JUST AN ANALYSIS BLOG AND IN NO WAY GUARANTEES OR IMPLIES ANY PROFIT OR GAIN. THE DATA HERE IS MERELY AN EXPRESSED OPINION. TRADE AT YOUR OWN RISK.

Friday, May 14, 2010

Five Waves Appear to Have Formed From the Top


The S&P blasted right through 1145, and did so with a 5 wave impulsive decline from the highs. Internals are extremely bearish right now as basically only seller are in the market. The bears are in firm control. Obviously, the start of that 5 wave decline at 1174 is key to the short term bearish case. So risk can be placed above there for short term bearish trades in my opinion. With 5 waves down from the high it suggests that the larger trend is now down and that we have AT LEAST another down leg after a relief rally. The S&P's low on the day is 1128, so that also eliminates the bullish count I have been tracking the past couple days as well. So two key levels were broken through in just the first couple hours of trading. So today's decline has been productive for the bears. 1110.88 is the next key level for the bears to obtain, and a break below 1100 would all but confirm that a major down-phase is underway.

Just as a side note, for those interested I placed this morning's CNBC interview with Prechter below.


PLEASE NOTE: THIS IS JUST AN ANALYSIS BLOG AND IN NO WAY GUARANTEES OR IMPLIES ANY PROFIT OR GAIN. THE DATA HERE IS MERELY AN EXPRESSED OPINION. TRADE AT YOUR OWN RISK.

Thursday, May 13, 2010

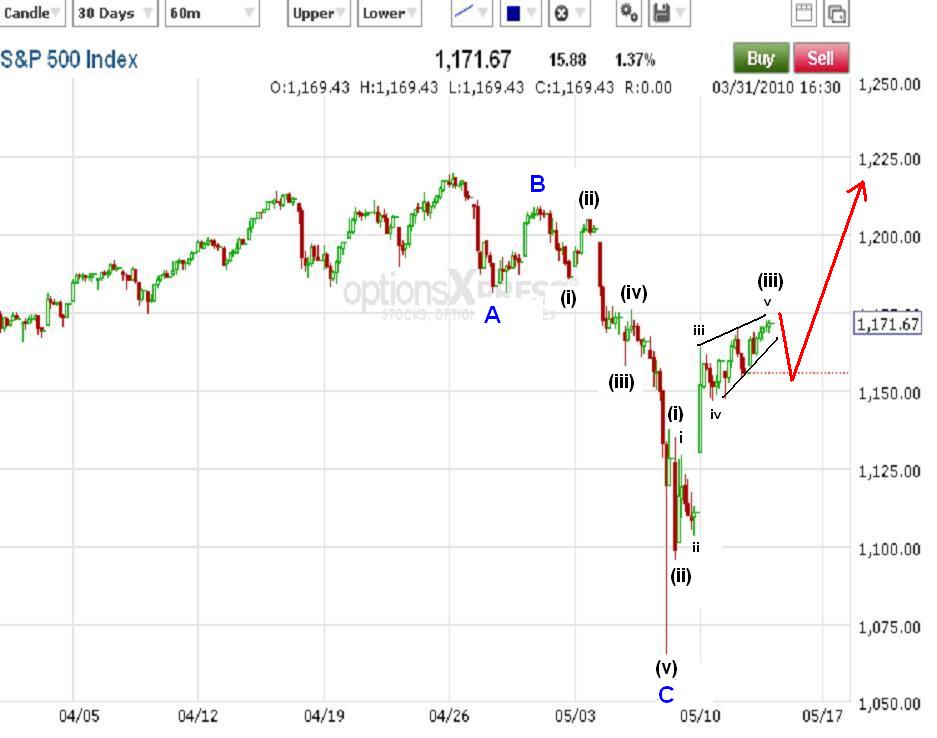
The S&P Should Target the 1150 Area, Then Tell us What the Larger Trend is

Daily S&P Cash Index


Yesterday's post laid out two scenarios: one bullish and one bearish. I know, saying the market will go either up or down doesn't really do anybody any good. But at this time we just need to keep both counts in our sights and let the market play out so we can see which one appears more likely to be unfolding. Looking at yesterday's bearish and bullish charts you can see that something like an ending diagonal was occuring in both, and that at least a near term pullback would occur no matter which count proved to be correct.

We see in the above daily chart that the resistance zone I cited yesterday remains well intact. That area is a major congestion area and very important for the bearish case. If that ceiling doesn't contain this current rally, then the short term bearish case is in severe trouble. But so far it's held, and today was a nice impulsive looking reversal that closed on the lows for the day. Something that hasn't happened in a while. So resistance held, and we finally see a solid sign of weakness in the market. On top of that, today's internals were quite flat as the market was flat most of the day. But the late day selloff soon changed that where closing NYSE downside volume was 78% of total volume, and pushing the Dow down over 100 points. So the bears really roared back into the close. Plus, the VIX closed up 4.55%, so there was definitely some fear at the end of today. Not exactly what I'd expect if the "all clear" signals were raised since the Greek bailout. But with that said, the S&P has still rallied at total of 108 points from last week's low, so the bulls do have something to hang their hats on.

S&P 60 min Chart Bearish Count


So let's look at the wave count. Above is the bearish count from yesterday (click here for yesterday's bullish count). Both the bullish and bearish counts remain valid and quite possible. So how do we find out which one is most likely correct? Glad you asked. The fact that there is an apparent ending diagonal that just occurred, it's more likely that the bearish count is underway because it's much more common for such a structure to occur at the end of a wave 'C' than it occurring at the end of a wave '(iii)'. In the bullish count, it's possible the ending diagonal was wave '(v)', instead of wave 'v' of '(iii)' as shown in the chart. But the problem is that wave '(ii)' and wave '(iv)' would not proportionate in time or size at all as wave '(ii)' is much bigger and longer than what wave '(iv)' would be. So I think it's best to label the bullish count wave 'iv' at a smaller degree. If so, it means that it's a wave '(iii)' ending with an ending diagonal. That's fairly rare.

An ending diagonal, or similar structure, is a signal of the market trend exhaustion. It's a sign that the preceding trend is really tired and going to be reversed soon. Because of this, we often see sharp reversals that retrace most of the diagonal pattern quickly, if not much more. So regardless of whether the bullish or bearish count is correct, we should see the S&P get to at least the 1150 area soon. Retail sales data is coming out tomorrow, to which I could care less about, but some people in the market will have a lot of interest in those numbers so we may get some movement in the morning from that data. It may also be important to pay attention to how the market closes tomorrow. If the market closes down fairly big and the VIX spikes higher, this may be very bearish since it shows that people don't want to be long going into the weekend and that they're buying a lot of option put protection. Bulls having a lot of fear going into a weekend is not the sign of a healthy market, rather it's the sign of a market on the brink.

So let me list the following levels that will strengthen the bearish count more and more as each level is taken out:

1) breaking below 1145 in a strong impulsive manner is a good start for the bearish case, but the market still has a lot of work to do to convince me wave (iii) of 3 of [3] or C is underway.

2) breaking below 1129.32 would mean that the bullish count I have labeled right now is invalid since wave '(iv)' would enter the price territory of wave '(i)', which is a big rule breaker in EWP. So this would make the bearish count much more likely.

3) getting to 1110.88 would close that huge monster gap left from Monday's "the world is saved" rally and erase all the Greece bailout gains. That would be very bearish and almost confirm that the market was headed much lower from there.

4) breaking below 1100 would pretty much officially eliminate all of the viable and likely bullish scenarios I can see, so this would confirm that at least last week's lows of 1066 will be broken soon.

In today's late day selloff, it appears that we may have wave 1, 2 and 3 down from today's highs. Let's see if we can get waves 4 and 5 to unfold tomorrow morning. From there we'll watch how the market behaves around 1145, i.e. if the market shoots right through it then that's bearish, but if the market flip flops or reverse around it then it MIGHT be bullish. And lastly, let's watch to see if people are buying or selling with any intensity into the close, and if the VIX is soaring from fear going into the weekend. Hopefully we'll get some good movement tomorrow to give us a better idea of the larger trend going into the weekend. But right now, I feel the bearish count is slightly more likely than the bullish count simply because of the ending diagonal pattern fitting better with a wave 'C' than a wave '(iii)'.


PLEASE NOTE: THIS IS JUST AN ANALYSIS BLOG AND IN NO WAY GUARANTEES OR IMPLIES ANY PROFIT OR GAIN. THE DATA HERE IS MERELY AN EXPRESSED OPINION. TRADE AT YOUR OWN RISK.

StatCounter