Friday, October 8, 2010

Still Waiting....Wave Count Still Sub-dividing Higher

So the market grinds higher, giddy that the Fed's Quantitative Easing 2 (QE2) is probably all but certain at this point.  I view taking the approach to the market where you're buying stocks because things are so bad that the government will jump in and do something is not sane or appropriate for the stock market.  It's made the market into a Las Vegas poker game where it's not about investing, it's just about ouplaying the other guy.  And we know how well governments have done with holding the market up over sustained periods of time.  Refer to yesterday's USD/JPY chart of what happened after the Bank of Japan intervened with the yen.  Hoping for bad news to get government help is like getting hit by a car and on the way to the hospital in an ambulance you're hoping your injuries are really really bad so that you'll get pain medication and disability from work.  It's sad.  But the market is always right, and it wants to go higher.  So logic is irrelevant.  I see no signs of a top at this point so I have to look to higher levels.
The above wave count suggests an ending diagonal-type structure may be unfolding right now.  The preceding price action supports the interpretation that a 5th wave is unfolding, and the diverging RSI since the peak of Subminuette wave iii also supports the 5th wave interpretation.  The structure is struggling to obtain new highs, despite the feel that this market has done nothing but rally straight up for weeks.  So the market looks tired, but there are no signs of a top, in fact it appears the market wants to push higher with QE2 assisting that move higher.
As I mentioned Tuesday, the big rally that day on high volume and strong internals concerned me a bit as a bear since that type of behavior usually acts as a launching pad for a strong bullish move in the coming days/weeks.  It appears that might be the case this time as well.  In order to reverse that bullish setup, I'd like the market to close beneath it's Tuesday intraday low which 1140.68 in the S&P cash index, and 10,711.12 in the Dow.  Doing so would be a good sign that a major top may be in place.
NOTE: EWI has a New ETF Flash Service for anyone interested.
These flash alerts instantly deliver specific buy/sell recommendations. When one subscribes, they are notified of only the highest-confidence opportunities. 
ETF Opportunity Flash, edited by Wayne Stough, alerts subscribers to multi-time frame opportunities in ETFs tracking 1) S&P/Dow, 2) Nasdaq, 3) Russell 2000, 4) T-bonds, 5) Gold/Silver, 6) U.S. dollar and other sectors. (Subscribers can expect 1-5 high-confidence opportunities per month.)  EWI's Newest Service Picks ETFs: Interview with the Editor 

In a follow up to a chart I posted earlier this week, the Nasdaq 100 continues to lag the S&P and Dow as shown on the above top chart over a 10 day period.  In addition, you can see that recently the XLF (financials) have started to peel away from the S&P as well.  On the hourly and daily charts you'll notice that the XLF has still failed to make new highs where the rest of the market has done so.  This is very bearish behavior since the overall market cannot sustain a big bullish move without the financials in my view, and if technology continues to lag then it's a good sign things are getting really bad internally.  It also fits well that the Nasdaq 100 is lagging over this 10 day period since it aligns itself well with the RSI divergence noted on the 2hr S&P chart I posted all the way up top which is typical for 5th and final waves.

Sentiment measure I've read recently have suggested a strong bullish sentiment in the market.  So those bulls need to feel compelled to switch to bears in order to flip this market's trend to the downside.  It might be tough with QE2 on the table.  But we'll see.  Europe has some underlying problems surfacing again so we'll see if that picks up steam or not.


Lastly, looking at the weekly stochastics for the S&P you can see that they're in overbought territory and will pinch and cross down at anytime.  One strong weekly close should do the trick.  In previous instances where this occurred since the March 2009 bottom we can see that it's led to declines, some much bigger than the others.  But notice that as the rally became more and more mature, the declines got bigger and bigger, for the most part.  This is not a good timing indicator at this point since momentum can remain at extremes for a long time, but once we get the cross down it should be a good signal that Minor wave 2 is complete.

To add more basic technical indicator methods to your toolbox, you can learn how to use bar patterns to spot trade setups. There are now even more ways you can use common bar patterns to spot high-probability trading opportunities: 30 charts across 15 pages: Download Your Free Bar Patterns Report Now.

PLEASE NOTE: THIS IS JUST AN ANALYSIS BLOG AND IN NO WAY GUARANTEES OR IMPLIES ANY PROFIT OR GAIN. THE DATA HERE IS MERELY AN EXPRESSED OPINION. TRADE AT YOUR OWN RISK.

Thursday, October 7, 2010

Waiting.....


Get Your Free Report: How to Use Bar Patterns to Spot Trade Setups


Our friends at Elliott Wave International, the world’s largest market forecasting firm, have just updated their free report, How to Use Bar Patterns to Spot Trade Setups. With thousands of downloads, “Bar Patterns” has always been a huge hit with traders. But now it’s been packed with even more ways you can use common bar patterns to spot high-probability trading opportunities: 30 charts across 15 pages.

Don’t miss out on this opportunity to learn simple new ways to spot valuable trade setups in the charts you view every day.

Download Your Free Bar Patterns Report Now.


PLEASE NOTE: THIS IS JUST AN ANALYSIS BLOG AND IN NO WAY GUARANTEES OR IMPLIES ANY PROFIT OR GAIN. THE DATA HERE IS MERELY AN EXPRESSED OPINION. TRADE AT YOUR OWN RISK.

Wednesday, October 6, 2010

Rally Goes Flat Quick


PLEASE NOTE: THIS IS JUST AN ANALYSIS BLOG AND IN NO WAY GUARANTEES OR IMPLIES ANY PROFIT OR GAIN. THE DATA HERE IS MERELY AN EXPRESSED OPINION. TRADE AT YOUR OWN RISK.

Bulls Not Following Through...........So Far


PLEASE NOTE: THIS IS JUST AN ANALYSIS BLOG AND IN NO WAY GUARANTEES OR IMPLIES ANY PROFIT OR GAIN. THE DATA HERE IS MERELY AN EXPRESSED OPINION. TRADE AT YOUR OWN RISK.

Tuesday, October 5, 2010

Bulls Gore Bears Quickly and Control the Markets


Don't forget to download the free booklet, "How To Use Bar Patterns To Spot Trade Set-ups", for more basic technical analysis methods, like the ones I just mentioned, to add to your toolbox.


The euro made a new high, negated the possible 5 wave impulsive decline I was tracking yesterday.  It looks like it will be making a charge to the 1.40 level.  Again, when the euro tops, so should equities.


PLEASE NOTE: THIS IS JUST AN ANALYSIS BLOG AND IN NO WAY GUARANTEES OR IMPLIES ANY PROFIT OR GAIN. THE DATA HERE IS MERELY AN EXPRESSED OPINION. TRADE AT YOUR OWN RISK.

Bears Don't Follow Through....Bulls Back in Firm Control


With today's rally to a new swing high, the decline from last Thursday's high (as shown here in the Dow) is a 3 wave move.  This means it's just a correction and suggests the market will charge higher in the coming days/weeks.


Not only is the decline in 3 waves, but the rally we're seeing now looks impulsive.  So the EWP evidence is strong that the market will continue charging to new highs in the coming days/weeks and at least attempt to enter my 1173-1181 reversal zone I've mentioned in the past.

One thing to note is that this big rally is supposedly in reaction to the Bank of Japan lowering interest rates to zero, and some other positive US data.  The move by the BoJ is more important to me.  These rallies from government intervention are often short lived and completely reversed.  So the action may have thrown a wrench into the wave count and make it difficult for wavers to get on board the short side.  Just like I want to see follow-through for the bears on the short side, I also want to see it on the bull side on rallies.  So tomorrow and Thursday will be more important than what happens today.

The euro made a nice 5 wave decline last night that I eluded to in yesterday's post. But the start of that 5 wave decline was exceeded early this morning so that count is invalidated.  When the euro turns, so should stocks.


PLEASE NOTE: THIS IS JUST AN ANALYSIS BLOG AND IN NO WAY GUARANTEES OR IMPLIES ANY PROFIT OR GAIN. THE DATA HERE IS MERELY AN EXPRESSED OPINION. TRADE AT YOUR OWN RISK.

Monday, October 4, 2010

Pretty Good Action Today for the Bears......Now the Follow-Through?


Internals today tell me that the decline was quite strong and the modest bump up in volume MIGHT be a good indicator of what might be coming this week.  If the market continues to decline while volume increases, it will be a big indication that minor wave 2 has topped and we're in minor wave 3.  The decline today was led by the small caps and technology while the VIX closed up 4.58%, so risk was pulling back today which could be the first signs of full on risk aversion coming back to the forefront after the long "risk on" trade that resulted from the Fed announcing they're going to become everyone's trading/investing backstop.  I expect volume to continue to increase on the move down otherwise we'll have to consider this pullback to just be part of a correction before charging to new highs.  But we'll wait to see what happens first before we start thinking about all that.


So it looks like my count from late last week was more accurate than the one I posted Sunday night.  It appears the ending diagonal (Elliott Wave Tutorial, 3.1), which is better represented in the Dow, has ended with a "throw-over" spike higher and reversal.  As I stated last Thursday, in Prechter and Frost's Elliott Wave Principle they state that, "Within a parallel channel or the converging lines of a diagonal, if a fifth wave approaches its upper trendline...[on heavy volume], it indicates a possible penetration of the upper line, which Elliott called 'throw-over'" (p. 73).  Thursday's uptick in volume into the 1.2 billion shares level certainly qualifies as heavy volume since volume of the past several weeks has held steadily below 1 billion shares most of the time.  So we certainly have a good structure here for solid Elliott Wave Principle counts that can give us solid confidence that some degree of top is already in place.

So we now need to see the decline unfold in larger impulsive patterns to help confirm that the larger trend has in fact turned down.  The larger the 5 wave impulsive patterns we see to the downside, the larger the degree of trend that has been reversed.  So we need to keep establishing shelves of resistance that can keep an impulsive count on track at larger and larger degrees.  Right now I see the 1148.26 level in the S&P cash index as a key level that needs to remain intact for now in order for us to remain confident that a significant top is in, and not just a minor short term setback.


Although the financials looked like they were going to continue with some strength into today's action, they ended up closing at about the same percentage down as the Dow, which was the strongest of the main indices I track.  But the financials are still dragging massively from the S&P as you can on the hourly charts.  As long as this behavior continues, it flashes a big warning sign for the bulls.  The market cannot sustain any meaningful rally over the long term without financials in my view.

Today's S&P close was the lowest close since September 23rd, signaling that the market wants to head lower for at least the short term.  Also notice on the daily chart that the RSI was diverging lower while price continued higher and it has now resulted in the lowest price close in over a week. 

The daily stochastics also show a diverging structure, trending to the downside, and with plenty of room to run as well.  Another bearish structure seen through a basic technical indicator.


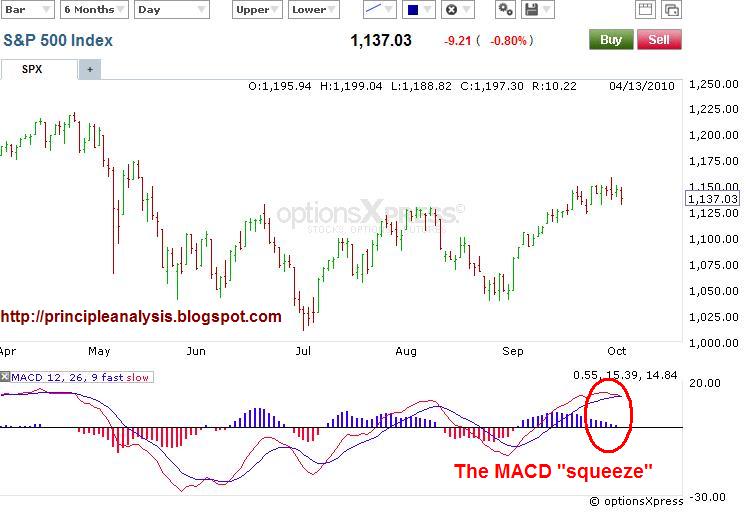
And now the MACD "squeeze" is occurring big time on the daily chart.  You can see the moving averages are pinched, creating the "squeeze" on the histogram (circled in red).  This is another bearish structure and signals a big trend reversal may be setting up, and could already be in the making as we can see from what I mentioned above.

Don't forget to download the free booklet, "How To Use Bar Patterns To Spot Trade Set-ups", for more basic technical analysis methods, like the ones I just mentioned, to add to your toolbox.

FOREX


Today's decline in the euro is a promising start to what could be the initial signal that the major top I'm looking for might be in.  I was really hoping we'd break to a new low beneath 1.3665 to confirm that the decline was a 5 wave drop on the 15min chart.  This would of course be a great sign that wave 2 had completed and the euro's descent to much lower levels is underway.  This would also be another piece of evidence that the stock market has also topped as well.  So I'll be watching the pair into the Asian and european sessions tonight to see if it can in fact break that 1.3665 level soon, and add another check mark to the list of evidence we want to see to confirm that a major top in both equities and the euro is likely in.

Right now the odds favor those major tops being in right now, but we're far from confirming it with high certainty.  But that doesn't mean I don't see good opportunities for the bears here with good risk/reward ratios in various markets.


PLEASE NOTE: THIS IS JUST AN ANALYSIS BLOG AND IN NO WAY GUARANTEES OR IMPLIES ANY PROFIT OR GAIN. THE DATA HERE IS MERELY AN EXPRESSED OPINION. TRADE AT YOUR OWN RISK.

Sunday, October 3, 2010

The Week Ahead; Also a Look at Forex (EUR and GBP)

Administrative note: it's come to my attention that some bloggers are posting my charts and posts directly to their blogs.  I have no problem with this AS LONG AS THEY GIVE ME CREDIT FOR THE WORK.  That primarily means leaving a hyperlink to my website (http://principleanalysis.blogspot.com/) and leaving my website address on the charts.  Thank you.


My stance still remains solid for a high to be in place as of last Thursday.  But the lack of follow through, SO FAR, has me preparing for further upside.  Perhaps the ending diagonal type pattern (Elliott Wave Tutorial, 3.1) will extend a bit further, leading to more choppy rising potential.  A sharp blast higher would probably negate this count and make the rise a thrust from a 4th wave triangle with an attempt to get into the 1173-1181 zone I mentioned in previous posts.


Above is just a time relationship chart I did over the weekend showing why I have less confidence in a top being in now than I did going into Friday's action.  That doesn't mean a top may not be in, but the chances just seem a little less likely at this point.

As you can see from the 5min S&P chart, the impulsive decline from last Thursday was 27 bars, or 135 minutes while the ensuing corrective rally has taken 127 bars and 635 minutes.  That's quite a loooooong correction relative to the impulsive wave down it's correcting.  So if a top was in Thursday, I expect heavy selling early Monday morning to eliminate some doubt.


On the daily chart of the S&P you can see the results of divergence on the ROC compared to price.  When the ROC has not confirmed a new high or low, it has resulted in a solid reversal in the past.  Currently, we have a potential divergence in the ROC from the S&P's price, so a turn down in price with a nice daily close down should confirm this and help us add to the evidence of a major top being place.

For other basic technical indicators to help supplement your trading, don't forget to check out the free "How To Use Bar Patterns To Spot Trade Set-ups"  trading booklet while it's still available for free.


The daily euro count is looking ready for a top and reversal, although there are no signs of that happening yet.  The RSI is entering significantly overbought territory on the daily chart, the rally is looking like a 3 wave move and has entered a strong fibonacci reversal zone.  I think when the euro turns, so will stocks.


As I've stated before, the daily british pound vs. the dollar chart shows a divergence between the euro vs the dollar daily chart as the euro has been making new highs will the pound has not.  The last time this happened, it led to thousands of pips being shed from the EUR/USD.  But it also should be noted that the divergence lasted quite a few weeks before the euro fell.  So the current divergence doesn't imply that it will top tomorrow, but I feel that it does show that the major top and decline I'm expecting is imminent. 

The hourly charts of the euro and pound also show a divergence.  The euro has climbed significantly in this respect while the pound has failed to make new highs and has been flat.  So as long as this divergence occurs on the hourly charts, it's possible we'll find a top in the euro very soon.

PLEASE NOTE: THIS IS JUST AN ANALYSIS BLOG AND IN NO WAY GUARANTEES OR IMPLIES ANY PROFIT OR GAIN. THE DATA HERE IS MERELY AN EXPRESSED OPINION. TRADE AT YOUR OWN RISK.

Friday, October 1, 2010

Guest Article on Forex Trading


Why Do 95% of Traders Fail?
Most people who decide to embark upon the journey of becoming a professional trader in the stature of the legendary George Soros have no idea how difficult the path to consistent profitability is going to be.  New traders often think they will be able to open a trading account with as little as $10,000 and be able to live off of trading profits the rest of their lives.  But oh, how different reality tends to be.  Everyone knows the industry statistic that 95% of traders fail.  That is reality.  Most traders who open a trading account will lose most or all of the trading account within a few months.
Many people will realize the reality of life as a trader is much more difficult than what they had originally anticipated; thus, they give up on trading and move on to a new professional pursuit.  Then, there is a second group of people that blow up that first account, but they develop a love for trading and decide to refund the account, study, and continue toward the quest of consistent profitability.  Eventually as the months and years go on, more and more of this remaining group of traders fall by the wayside and give up on the dream of trading consistently.  And in the end, only about 5% of traders succeed and make a legitimate living from trading financial markets.  The question we need to answer is why?
I believe it can be argued that a large majority of the 95% of traders that fail, fail due to preventable reasons.  In other words, there are practical things traders can do to prevent failure, and unfortunately most traders do not implement these practical steps.  In this article we will address one specific step traders can take to dramatically increase the probability of trading success over the long-term.
Before we delve into the specific action step, let’s examine more closely why traders fail.  Although there are many generalities such as lack of discipline, poor money management, etc, the real reason traders fail is simple—they are losing money!  Why are they losing money?  It has to be one of two reasons.  Either they do not have a strategy that yields positive expectancy (makes money over time), or they do not execute their strategy.  Every trader who has failed and given up on trading has failed because of one of these two aspects of trading.
Strategy Development
Fundamentally, a technical trading strategy must yield positive expectancy.  Positive expectancy is a statistics term from mathematics that means when the strategy is backtested over historical data, it yields positive expectancy, or it makes money.  If a strategy cannot make money when tested over historical data, then it has negative expectancy, and cannot expect to produce profits in the future.  Thus, a trader who trades a strategy with negative expectancy has no chance of profiting in financial markets over the long-term, even on a forex demo account.
Thus, a trader must test his strategy over historical data and prove that his approach makes money.  This can be done in two ways.  The first is to have a programmer code out the strategy and then backtest the strategy and gather hard data concerning win/loss percentage, max drawdown, average winner, average loser, etc.  All of this data should be analyzed very closely in order to assess how to best trade the strategy in real-time in order to maximize profitability.  This exercise will give you a huge amount of confidence in your trading strategy, and when it is not performing at its peak, you will have the ultra-important element of confidence in order to continue trading the strategy and not give up.
The second option you have is to manually backtest the system.  This includes scrolling back through years and years of historical data with forex brokers in order to test your strategy in all market conditions.  Each time the setup occurs, take notes on whether the strategy was a winner or a loser, and why.  This style of backtesting is much more tedious and consumes much more time, but it can bring an even stronger sense of confidence to a trader.
In conclusion, there are many reasons that traders fail, but one of the primary reasons is that they have not become convinced of the merits of the strategy they are trading, and this is absolutely essential to long-term success as a trader.  Conducting personal research will help invaluably.

Bears Keep Putting the Smack Down, but Waiting for Follow-Through


The 5min Dow chart above shows that both yesterday and today the bulls came out of the gates strong, gearing up to gather momentum and surge this market to the moon with a vacuum affect first thing in the morning.  It failed miserably both times suggesting a process of reversing the bullish trend may be underway. 

Yesterday the rally was reversed sharply in an impulsive manner to a new low.  Then today the bulls rallied again right at the open, but not nearly as strong or high, and yet again the bears put the smack down and brought the market to a new low.  So the bulls are showing some exhaustion and the bears are starting to wakeup.  But now the bears need to gain control and not just play defense. 

Right now the move after the impulse decline yesterday morning is sideways and choppy, fulfilling its expectation of being a correction, which I am calling Submicro wave (2) which is shown in yesterday's post.  But the action from the high this morning is not impulsive so it suggests a new high on the day above the Dow's 10,866 will occur either today or Monday before Submicro wave (3) gets underway.  But the rally should stay below yesterday's high at 10,949.  Now this is what the market action would be if it moved in perfect Elliott Wave form.  But we know that's not always the case.  So even though the perfect scenario would mean a new high on the day while remaining below yesterday's high for Submicro wave (2) to top, we know that it can actually tank hard to the downside at any time.  So beware.

Aside from the lack of an impulsive decline today, we should also note that the euro rallied big today and is showing no signs of weakness, the VIX is falling, and Goldman Sachs and financials are showing relative strength to the rest of the market which all suggests the market isn't quite ready to get Submicro wave (3) underway quite yet. 

But as long as yesterday's highs remain intact, I'm firmly bearish in the short term.

PLEASE NOTE: THIS IS JUST AN ANALYSIS BLOG AND IN NO WAY GUARANTEES OR IMPLIES ANY PROFIT OR GAIN. THE DATA HERE IS MERELY AN EXPRESSED OPINION. TRADE AT YOUR OWN RISK.

Thursday, September 30, 2010

A Top Looks Good Right Here


Internals today are what would be expected with prices in the major indices closing down the way they did.  We got a nice surge in volume today, on a down day no less, which is probably just end of quarter jostling by fund managers. 

The rally this morning looked like the S&P wanted to breakout to my targeted resistance range of 1173-1181 as it surged well beyond the key 1150 level.  But the market quickly rejected this rally, sending it downward to new intraday lows in a clear impulse pattern that I'm labeling Submicro wave (1) as you can see in my below wave count on the intraday chart.

Today's reversal comes right at the end of a great September for the bulls and at the end of a great quarter for stocks.  It also comes at a time when the wave count and sentiment extremes suggest a major top should occur any moment now.  Us wavers call it Minor wave 2.  So in just looking at the charts, today may well mark a top.  But a break above today's high simply means another charge toward the 1173-1181 area before Minor wave 2 tops and reverses.


Today on the drudgereport there were two stories: one pointing out the great run stocks have had, and one pointing out the horrible decline the US dollar has had.  I believe both are the cusp of major reversals.  I consider Drudge an electronic international newspaper.  It's not a financial publication, it's just a grouping of international stories of interest going on during the day.  So it has mainstream outreach that can be useful in my hasty analysis of sentiment.  So when when stocks do so well and the US dollar does so bad that it makes Drudge headlines to get to the mainstream, it may mean things are about to reverse, at least in the short term.

On the other hand, today's rally and reversal structure was no secret in financial media as CNBC documented it and had a discussion with the FastMoney traders about the action.  So in that respect, it may be too obvious to mark a top.  But seeing as that Drudge is not financial based, and gets much more readers per day than CNBC's FastMoney to have a more "mainstream" audience to it, I'll hold my contrarian position a little more reliably with Drudge.  But we'll see.


Looking at the daily S&P wave count it sure would count well as complete here.  The struggle at the 61.8% fibonnaci level  (Elliott Wave Tutorial, 8.1) with a pop above it that's quickly reversed in an impulsive manner is certainly a good time to mark a top to Minor wave 2.  Also notice that we finally got some RSI divergence on the daily chart as you can see above.  This is typical behavior in 5th and final waves that often lead to big moves once the reversal occurs.  And when the divergence occurs on the daily charts, those reversal are often quite large.


The small intraday counts nicely well with a major top being in place today.  Subminuette wave v traced out an ending diagonal (Elliott Wave Tutorial, 3.1), which resulted in "throw-over" to complete the pattern with this morning's rally.  In Prechter and Frost's Elliott Wave Principle they state that, "Within a parallel channel or the converging lines of a diagonal, if a fifth wave approaches its upper trendline...[on heavy volume], it indicates a possible penetration of the upper line, which Elliott called 'throw-over'" (p. 73).  Today's uptick in volume into the 1.2 billion shares level certainly qualifies as heavy volume since volume of the past several weeks has held steadily below 1 billion shares most of the time.

If the count is correct, Submicro wave (1) finished early this morning, and the choppy 3 wave rise later in the day MAY have completed Submicro wave (2).  If so, tomorrow morning will lead to a sharp Submicro wave (3) down and put this current count well on track.  But if the market wants to push a little higher first, as long as it stays below today's high, this count still remains valid but we'll just have to push Submicro wave (2) up a bit higher.

The ending diagonal count certainly looks weak, as ending diagonals usually do. But this one looks horribly weak, so much so that it looks more like a 4th wave triangle followed by a sharp 5th wave thrust and reversal this morning.  There's little difference in the two in that they both mean a top is likely in and lower levels ahead.

Other than the RSI, this other basic technical indicator is showing a nice bearish setup on the dialy charts too.  It's taken a long time for the divergences on the intraday charts to move their way to the larger time frames, but here we are finally.  The MACD has started to "squeeze", a behavior typical of a market reversing trend.  And on the daily charts, this probably means a big move to the downside once confirmed.  Again, this aligns with the wave count calling for Minor wave 3 down getting underway.

Nothing new on the euro or the US dollar.  Their still working their way into their reversals.  Their reversals should coincide fairly closely with the reversal in equities.

For those of you who like supplementing your wave counts and trading with basic technical indicators and patterns, don't forget to check out this free resource while it's available for free: "How To Use Bar Patterns To Spot Trade Set-ups". 


PLEASE NOTE: THIS IS JUST AN ANALYSIS BLOG AND IN NO WAY GUARANTEES OR IMPLIES ANY PROFIT OR GAIN. THE DATA HERE IS MERELY AN EXPRESSED OPINION. TRADE AT YOUR OWN RISK.

Looking for a Top


We got a nice shot higher and reversal today which is what we'd like to see at a top.  It also fits nicely with the wave count I've been tracking the past few days and the decline from today's high looks impulsive.  I'm counting it as a Submicro wave (1) down on the Dow 5min chart above.  The count suggests perhaps a little more upside today before topping out below today's highs and rolling over sharply in Submicro wave (3) down.  If today's highs are broken it simply means it will continue trying to get into my S&P reversal range of 1173-1181.

More later...

PLEASE NOTE: THIS IS JUST AN ANALYSIS BLOG AND IN NO WAY GUARANTEES OR IMPLIES ANY PROFIT OR GAIN. THE DATA HERE IS MERELY AN EXPRESSED OPINION. TRADE AT YOUR OWN RISK.

Wednesday, September 29, 2010

Market Rally Looking Real Tired; Will it Finally Give Way to the Bears? Also, a Look at Currencies.


Internals today were about as bearish as I'd expect with today's action action.  They were just mildly bearish and the price decline was the same.  The one point of interest is the slight increase in volume we're starting to see now.  Notice that we've popped above 1 billion shares again.  Still this is very low for the market in general, but relative to the past several weeks, this is a bit of an uptick.  We'll see if this uptick in volume results in what usually has happened in the past few months in that volume increases on declines, or if it's simply end of quarter josseling by fund managers.

Also of note is the relative weakness in financials compared to the S&P and Dow like I mentioned in this morning post.  The financials are showing significant and prolonged weakness compared to the overall market, and that's a huge warning sign as long as it continues in my view.  Also, the VIX climbed higher almost 3% today with just a mild decline in the indices. Again the VIX to me is also signaling a backdoor cautiousness that's working it's way slowly and stealthily into this market as apparently recently a lot of folks are doubting the latter end of this rally and buying a lot of put options for protection, or maybe even speculation.

Above is just an updated wave count on the S&P from yesterday.  It actually did exactly what I projected in giving us a little drop down to the lower end of the diagonal triangle I think might be forming.  If an ending diagonal (Elliott Wave Tutorial, 3.1) is forming then it brings about a great opportunity for the bears since they are clearly identified structures, represent extreme weakness in the uptrend, and lead to sharp reversals.  I mentioned my case for the ending diagonal in yesterday's post as well. And today I posted the RSI as well to show you that it's diverging lower compared to price, which is typical of 5th waves, especially ending diagonals. 

So the market can top and reverse at any time, and may have already done so, but if it hasn't, then I expect a slow grind higher for probably the rest of the week until the end of the quarter with perhaps a sharp rally and reversal to finish it off.  If the market breaks out higher to negate the ending diagonal structure, then my alternate count from yesterday's post is probably occurring which should the market to my reversal range of 1173-1181.

CURRENCIES


I think we're setting up here for a great opportunity to catch some really big moves in currencies.  I'm focusing on the majors, primarily the EUR/USD and the GBP/USD.  I think that both pairs are forming major tops and that the EUR/USD is headed to parity on the next dive lower.  That's a move I don't want to miss.  It may also trigger the top and reversal in equities and commodities as well.  So even if you don't trade currencies, I think it's worth paying attention to the euro and/or the US dollar.

I mentioned a week or so ago that there was a divergence in the EUR/USD and GBP/USD on the small timeframes but it didn't pan out as both shot to new highs shortly after.  But here we go again on the short term charts we see that the EUR/USD has been grinding out new highs this week while the GBP/USD so far has failed to do so.  As long as the GBP/USD does not make a new high on the week, I interpret this as immediately bearish & could be the first signs of a major top, which means a major bottom in the US dollar.


Again, the daily divergence between the two pairs still exists.  To me this is very telling and supports the thesis that the pairs' rally higher since May/June is that of a correction, and will be completely reversed to the downside in the coming months.


So why is this divergence important?  Has it resulted in any reversals in the past? Good questions, and I'm glad you asked.  Above I show a similar divergence that occurred while rallying into the late 2009 top in the EUR/USD.  Notice that the EUR/USD continued to make new highs after August 4th all the way up until November 24, 2009.  But the GBP/USD made it's high on August 5th, 2009, and then made one more attempt to make a new high November 15th which failed.  Then look at the result of both currency pairs after that divergence....it resulted in complete and utter destruction to the downside.

So if history is repeating itself, the GBP/USD is again signaling that a major reversal to the downside is coming.  Once I see signs that a top and reversal might have started I'll post it here.

Check out the new bar pattern trade setups article being offered, titled, "A Trader Walks Into A Bar... Pattern: HOP-portunity On Tap."  There is also an offering for a free eBooklet on trading barpatterns titled, "How To Use Bar Patterns To Spot Trade Set-ups".  Free tools are always at least worth a look since they may assist your current trading strategy in some way.

So what do you think of my post and the market action today?  I'd like to know your thoughts and comments in the Elliott Wave Forum section. 

PLEASE NOTE: THIS IS JUST AN ANALYSIS BLOG AND IN NO WAY GUARANTEES OR IMPLIES ANY PROFIT OR GAIN. THE DATA HERE IS MERELY AN EXPRESSED OPINION. TRADE AT YOUR OWN RISK.

StatCounter