Thursday, May 20, 2010

Market in Wave 3 and Various Degrees, Still More Downside to Come


Above are the internals showing the insanely bearish foundation of the market move today. Volume as a whole was huge on a big down move which is basically bearish in and of itself, down volume represented 98.6% of total volume, and 18.6 stocks were down for every 1 stock up, and the S&P only had 3 stock advancing. So it was a broad based 'sell everything' decline today. This is textbook EWP wave 3 internal structure. It also means that further declines are to come. Tomorrow is options expiration day so it could be another wild day. Today's late day selling and the financial news in panic mode right now, I can see a sharp decline tomorrow morning and then perhaps a rally to end the day. But this absolutely no time to get cute on trying to catch bottoms in my opinion. If anything I would be ready to where if there is a bounce higher, it might be an opportunity to sell into it. All my key levels I've mentioned over the past week have bee destroyed so I think this market is headed lower....much lower. The evidence that wave [3] or C is underway is very high right now. I'm looking to sell into any significant rally the comes about, but most likely that means I'll be waiting for wave (1) to end and will get short on the big wave (2) once it gets underway.


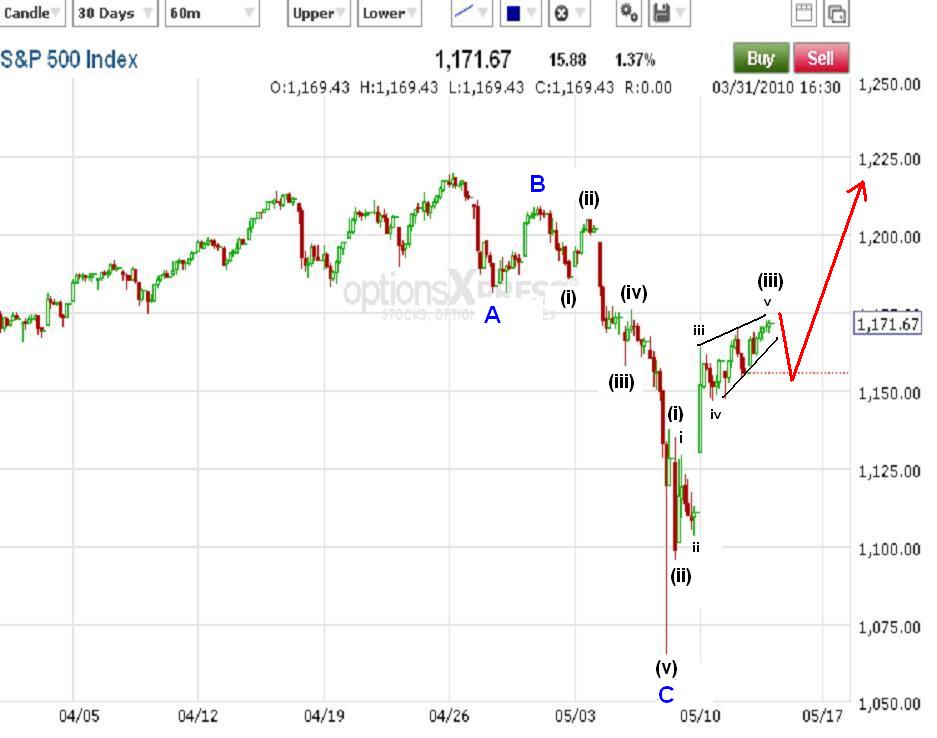
Above is a cleaned up chart with proper degrees of waves I feel are likely at the present time. This also fits in with my guess that tomorrow will give us a sharp selloff early and perhaps a rally at the end of the day since this count has us in a wave 'v' of '(iii)' of 3. So wave 'v' may shoot down tomorrow and lead to a somewhat muted or flat correction for wave (iv). This is merely a guess and in no way am I taking an short positions off the table in preparation for that, and I'm definitely not getting long this market at any time. All it means is that I'm ready and prepared for the volatility coming.

The market should be heading lower and I'd only be looking for short entries.


PLEASE NOTE: THIS IS JUST AN ANALYSIS BLOG AND IN NO WAY GUARANTEES OR IMPLIES ANY PROFIT OR GAIN. THE DATA HERE IS MERELY AN EXPRESSED OPINION. TRADE AT YOUR OWN RISK.

Market Should be in a Wave iii of (iii) of 3 of [3] or C

Market Internals


I was unable to access my computer and could only use my iPod to put up last night's post so I couldn't put up any charts or get too detailed. So I'm putting up an early post to make up for last night.

1149 remains key for the S&P cash index for the bears. I got a screen shot of today's market internals and you can see that in the NYSE and S&P that buyers are almost non-existent. Although it's early, if this holds up, it's definitely characteristic of a wave 3 at some degree. Barring a massive reversal today, the key levels I wanted to see taken out in the S&P have been destroyed (click here for original post).


15min S&P Cash Index Wave Count


The inernals so far show massive selling across the board which is indicative of a wave 3. The above chart shows that we could be in a wave iii of (iii) of 3 of [3] or C. So massive unrelenting selling is in order right now. The first support target is the lows made a couple weeks ago on that so called "error", which we knew was not true. The market is about to prove us right as it heads toward those lows at 1066 because it shows that the market really did want to go to that level and that it just wasn't an error.


S&P Cash Index Daily Chart


Above is just a look at the bigger picture through the daily S&P chart. You can see that there is still heavy selling to much lower levels on the horizon. 1149 remains key for the bears.


PLEASE NOTE: THIS IS JUST AN ANALYSIS BLOG AND IN NO WAY GUARANTEES OR IMPLIES ANY PROFIT OR GAIN. THE DATA HERE IS MERELY AN EXPRESSED OPINION. TRADE AT YOUR OWN RISK.

Wednesday, May 19, 2010

1149 is Key for the Bears

I'm unable to post a full update tonight. The bottom line is that the markets downtrend remains intact and I expect much lower levels in the coming days/weeks. As long as 1149 in the S&P cash index remains intact, I am comfortable being fairly heavily short. I should be able to do a normal post tomorrow, hopefully sometime in the morning.

Todd

Tuesday, May 18, 2010

Downtrend May Have Resumed

Primary Wave Count


The market shot up this morning to complete wave (ii) and spent the rest of the day declining. It was a very orderly sell off that steadily pulled the market down while floating the VIX higher. There was no 'panic', it was all well thought out and orderly selling. This type of behavior can be brutal to the bulls because a slow bleed usually has a hard time squeezing shorts and therefore bottoms and buying power are harder to come by. The market simply just trickles down lower and lower. If the above wave count is correct, there should be very little alleviation in selling. The market should be headed much lower, with the first target being 1066, but it should continue on down down down. The count remains valid as long as 1174 remains intact.


Much Less Likely Alternate Count


At first, watching today's slow and choppy decline had me thinking it had to be a 'B' wave within wave (ii), and that a strong wave 'C' rally above 1149 would complete wave (ii). But two things stood out that severely weakened this view:

1) The market closed the day with NYSE down volume representing 88.7% of total volume. I would expect a wave B to have up/down volume closer to break even, not overwhelming selling. This is more indicative of a wave 3 at some degree. So again, the top count looks more likely.

2) The market maintained a series of lower highs all day, and every attempt to snap a rally higher, especially into the close, had failed. A wave 'B' is usually a 3 wave affair, or some combination thereof, but today's structure does not resemble any 3 wave combination, more like an elongated impulse.

So although this count is still possible, it's a distant 2nd compared to my top count.

Stock Market Support Shelf


It appears that the 1120 level is a support shelf, at least temporarily, for the S&P cash index, and it closed right on it. Most of the other major indices also closed right around their support shelves as well. So the fact that this level didn't lead to a sharp rally, and in fact closed right on it, is a good sign that this support will be taken out fairly soon. Looking at the daily charts, there should be little support until it reaches the levels of "the big selloff" a couple weeks ago, which is 1066 in the S&P. So a strong break below 1120 should lead to a quick move to the 1066, and according to my top count, it will go much further below 1066 as well.


USD/JPY Support Shelf


Above is the USD/JPY (US dollar vs. japanese yen) I've been tracking the past few weeks since it looks very similar to the structure of the stock market. It trades 24 hours a day so it's good to watch overnight to perhaps give a clue to what will happen during the next cash index session in stocks. The USD/JPY also looks bearish at various time frames, and it also has a support shelf. So for those that don't follow the futures can follow the USD/JPY overnight to give a clue if perhaps the stock market's cash indices will follow suit once they open. FXCM has free real time charting at click here. Looking at the S&P futures right now, the June contract is trading around 1110, which is below its support shelf. Acceleration to the downside would be a good sign that the US cash indices will tank tomorrow too. But the futures have been down big overnight quite a few times in the past several days, and have almost always been completely reversed by the time the US session gets underway. So this is nothing to get too hung up on, but something interesting to follow throughout the night, be eventually the futures WON'T reverse.


PLEASE NOTE: THIS IS JUST AN ANALYSIS BLOG AND IN NO WAY GUARANTEES OR IMPLIES ANY PROFIT OR GAIN. THE DATA HERE IS MERELY AN EXPRESSED OPINION. TRADE AT YOUR OWN RISK.

Monday, May 17, 2010

Short Term Downtrend Extended, Now Correcting


The futures dropped big Sunday night but rallied back big time to start the US session in positive territory. Then the bears showed up again and pushed the market significantly lower in the morning only to see the bulls come back and push the market into a slightly higher close. It appears that a series of 1 and 2 waves have been unfolding since the top a couple weeks ago. Today's decline looks like a wave 'v', which was just a continuation and extension of the previous downtrend. I originally thought the 5 wave decline was completed Friday and wave (ii) was either done, or would be done soon. Today's 5 wave decline and sharp reversal means I need to alter the count a bit to have today being the end of the 5 wave decline composing wave (i). So now wave (ii) is underway, and it appears higher levels will be achieved tomorrow before wave (iii) of 3 of [3] or C gets underway. The market can turn down at any moment, and at this degree of trend it means it will be almost a straight line down. So I don't want to get too cute here. I simply want to be short now with stops just above 1174. If the market turns higher from here I'd merely look at that as an opportunity to get more short as long as it stays below 1174.


Above is a daily chart in the S&P that is bothering me a bit. It shows several candlesticks that have long wicks on their undersides showing the power of the bulls coming in and preventing the bears from maintaining losses into closes. Now this can be explained with EWP on the intraday charts by the series of one and two waves that unfolded from the top, but without EWP it would appear that strong support is forming around current levels. But a strong close beneath today's low of 1114.96 would be a big sign that EWP is prevailing and that these potential bullish candlesticks really don't have much potential at all.


PLEASE NOTE: THIS IS JUST AN ANALYSIS BLOG AND IN NO WAY GUARANTEES OR IMPLIES ANY PROFIT OR GAIN. THE DATA HERE IS MERELY AN EXPRESSED OPINION. TRADE AT YOUR OWN RISK.

Sunday, May 16, 2010

More Weakness Ahead


Not much new to add or project from what I've been posting last week. The five wave drop into Friday's low tells us that the larger trend is probably down. Seeing as that this may be a wave 3 of 3 of 3 or C means that the selling may be extremely intense. The late day rally from Friday I tentatively labeled wave C of ii. It's quite shallow so I think it's quite possible for a much deeper sharp rally Monday to finish off wave ii. However looking at the S&P futures down double digits this evening makes me want to possibly count wave ii complete already, and that wave iii of (iii) of [3] or C might possibly get underway Monday.

1174 in the S&P cash index remains key for the short term bears.


PLEASE NOTE: THIS IS JUST AN ANALYSIS BLOG AND IN NO WAY GUARANTEES OR IMPLIES ANY PROFIT OR GAIN. THE DATA HERE IS MERELY AN EXPRESSED OPINION. TRADE AT YOUR OWN RISK.

Friday, May 14, 2010

Five Waves Appear to Have Formed From the Top


The S&P blasted right through 1145, and did so with a 5 wave impulsive decline from the highs. Internals are extremely bearish right now as basically only seller are in the market. The bears are in firm control. Obviously, the start of that 5 wave decline at 1174 is key to the short term bearish case. So risk can be placed above there for short term bearish trades in my opinion. With 5 waves down from the high it suggests that the larger trend is now down and that we have AT LEAST another down leg after a relief rally. The S&P's low on the day is 1128, so that also eliminates the bullish count I have been tracking the past couple days as well. So two key levels were broken through in just the first couple hours of trading. So today's decline has been productive for the bears. 1110.88 is the next key level for the bears to obtain, and a break below 1100 would all but confirm that a major down-phase is underway.

Just as a side note, for those interested I placed this morning's CNBC interview with Prechter below.


PLEASE NOTE: THIS IS JUST AN ANALYSIS BLOG AND IN NO WAY GUARANTEES OR IMPLIES ANY PROFIT OR GAIN. THE DATA HERE IS MERELY AN EXPRESSED OPINION. TRADE AT YOUR OWN RISK.

Thursday, May 13, 2010

The S&P Should Target the 1150 Area, Then Tell us What the Larger Trend is

Daily S&P Cash Index


Yesterday's post laid out two scenarios: one bullish and one bearish. I know, saying the market will go either up or down doesn't really do anybody any good. But at this time we just need to keep both counts in our sights and let the market play out so we can see which one appears more likely to be unfolding. Looking at yesterday's bearish and bullish charts you can see that something like an ending diagonal was occuring in both, and that at least a near term pullback would occur no matter which count proved to be correct.

We see in the above daily chart that the resistance zone I cited yesterday remains well intact. That area is a major congestion area and very important for the bearish case. If that ceiling doesn't contain this current rally, then the short term bearish case is in severe trouble. But so far it's held, and today was a nice impulsive looking reversal that closed on the lows for the day. Something that hasn't happened in a while. So resistance held, and we finally see a solid sign of weakness in the market. On top of that, today's internals were quite flat as the market was flat most of the day. But the late day selloff soon changed that where closing NYSE downside volume was 78% of total volume, and pushing the Dow down over 100 points. So the bears really roared back into the close. Plus, the VIX closed up 4.55%, so there was definitely some fear at the end of today. Not exactly what I'd expect if the "all clear" signals were raised since the Greek bailout. But with that said, the S&P has still rallied at total of 108 points from last week's low, so the bulls do have something to hang their hats on.

S&P 60 min Chart Bearish Count


So let's look at the wave count. Above is the bearish count from yesterday (click here for yesterday's bullish count). Both the bullish and bearish counts remain valid and quite possible. So how do we find out which one is most likely correct? Glad you asked. The fact that there is an apparent ending diagonal that just occurred, it's more likely that the bearish count is underway because it's much more common for such a structure to occur at the end of a wave 'C' than it occurring at the end of a wave '(iii)'. In the bullish count, it's possible the ending diagonal was wave '(v)', instead of wave 'v' of '(iii)' as shown in the chart. But the problem is that wave '(ii)' and wave '(iv)' would not proportionate in time or size at all as wave '(ii)' is much bigger and longer than what wave '(iv)' would be. So I think it's best to label the bullish count wave 'iv' at a smaller degree. If so, it means that it's a wave '(iii)' ending with an ending diagonal. That's fairly rare.

An ending diagonal, or similar structure, is a signal of the market trend exhaustion. It's a sign that the preceding trend is really tired and going to be reversed soon. Because of this, we often see sharp reversals that retrace most of the diagonal pattern quickly, if not much more. So regardless of whether the bullish or bearish count is correct, we should see the S&P get to at least the 1150 area soon. Retail sales data is coming out tomorrow, to which I could care less about, but some people in the market will have a lot of interest in those numbers so we may get some movement in the morning from that data. It may also be important to pay attention to how the market closes tomorrow. If the market closes down fairly big and the VIX spikes higher, this may be very bearish since it shows that people don't want to be long going into the weekend and that they're buying a lot of option put protection. Bulls having a lot of fear going into a weekend is not the sign of a healthy market, rather it's the sign of a market on the brink.

So let me list the following levels that will strengthen the bearish count more and more as each level is taken out:

1) breaking below 1145 in a strong impulsive manner is a good start for the bearish case, but the market still has a lot of work to do to convince me wave (iii) of 3 of [3] or C is underway.

2) breaking below 1129.32 would mean that the bullish count I have labeled right now is invalid since wave '(iv)' would enter the price territory of wave '(i)', which is a big rule breaker in EWP. So this would make the bearish count much more likely.

3) getting to 1110.88 would close that huge monster gap left from Monday's "the world is saved" rally and erase all the Greece bailout gains. That would be very bearish and almost confirm that the market was headed much lower from there.

4) breaking below 1100 would pretty much officially eliminate all of the viable and likely bullish scenarios I can see, so this would confirm that at least last week's lows of 1066 will be broken soon.

In today's late day selloff, it appears that we may have wave 1, 2 and 3 down from today's highs. Let's see if we can get waves 4 and 5 to unfold tomorrow morning. From there we'll watch how the market behaves around 1145, i.e. if the market shoots right through it then that's bearish, but if the market flip flops or reverse around it then it MIGHT be bullish. And lastly, let's watch to see if people are buying or selling with any intensity into the close, and if the VIX is soaring from fear going into the weekend. Hopefully we'll get some good movement tomorrow to give us a better idea of the larger trend going into the weekend. But right now, I feel the bearish count is slightly more likely than the bullish count simply because of the ending diagonal pattern fitting better with a wave 'C' than a wave '(iii)'.


PLEASE NOTE: THIS IS JUST AN ANALYSIS BLOG AND IN NO WAY GUARANTEES OR IMPLIES ANY PROFIT OR GAIN. THE DATA HERE IS MERELY AN EXPRESSED OPINION. TRADE AT YOUR OWN RISK.

Wednesday, May 12, 2010

Market at Crossroads and Needs to Perform to the Downside Quickly if Wave [3] or C is Underway

S&P Key Resistance


I don't have much time to get into great detail this afternoon so I spent most my time having the charts do the explaining to me. The strength in the market is not really conducive of a correction at this point. So the bearish outlook I've been talking about lately has decreased in likelihood. Goldman Sachs also made a new high, negated the 5 wave drop I mentioned yesterday. However since the current rally is supposed to be a wave (ii), we can expect similar-type strength to occur. However, I feel it's gotten to a point where it's almost too much to be the characteristic of a correction. Don't get me wrong, there is plenty of evidence to support the wave (ii) scenario, but now there is evidence building quickly for the bullish side as well.

I have to draw a line in the sand so I know when to start abandoning the wave [3] or C outlook for now. 1180-1185 in the S&P cash index has been a prior congestion area as you can see from the above chart. If the market can get solidly above that range and sustain it, then I would be reluctant to maintain aggressively bearish positions at that time. The behavior around that level is key. If the S&P struggles and reverses the 1180-1185 area, then the bearish view is still on track. But if it cuts through it like it wasn't even there and then holds above it for the close or for a few hours, then I will interpret that as the market wants to make new highs on the year and that wave [3] or C is NOT underway at this time.

I feel we're left at crossroads today, with two possibilities that now unfortunately have equal weighting as far as their likelihood. One is bullish and one is bearish (see below). Notice that both counts below suggest an ending diagonal is forming (see ascending triangle on charts). So just because we may get a sharp selloff soon, that doesn't necessarily mean that wave [3] or C is underway again. We still need to be mindful of the bullish scenario that allows for a correction before resuming its uptrend as well. A break below 1140 would drastically reduce the bullish count's odds of occuring, a break below 1130 would be a very strong signal that the bullish interpretation below was unlikely, and a break below 1110 would confirm that the bullish interpretation is not occurring.

BEARISH COUNT


BULLISH COUNT


Tuesday, May 11, 2010

The Market is Seteup for a Possible Major Decline Soon

Internals Mixed


Above is a screenshot of today's finishing internals. You can see that there were more advancing stocks than declining stocks on the NYSE, yet downside volume well exceeded upside volume; and enough so that the NYSE closed down more than any of the other major indices at -0.50%. So a lot of stocks were up today, but not with much conviction. The conviction was on the sell side with a concentrated amount of stocks. That's bearish. Also notice that the S&P had more decliners than advancers. So after a monster 400 point Dow rally and saving Greece from immenent destruction, the markets could not get any follow through today. After yesterday's rally, it's already out of gas, which makes it more likely that yesterday was more short covering than anything. Just my opinion.


Updated 5min S&P Cash Index Chart


So above is an updated 5min S&P cash chart that I put up a few minutes after placing my full post up yesterday (click here for yesterday's chart). As yesterday's chart shows, it appeared we needed one more up-leg to finish off wave (v) of C before looking for a top. This top I'm looking for may be significant since the ensuing decline would be a wave 3 at various degrees, which means an almost straight line down. So I'm on high alert for a potential top to make sure I maximize the possibilities at this juncture.

Today the market fulfilled the expectation for that one up-leg and then met resistance and reversed at the 1170 level. With it now possible to count 5 waves up complete for wave C right now, the internals turning negative immediately after a 400 point Dow rally and Greece bailout, the reversal late in the day to turn the major indices mixed into the close, and the structure of Goldman Sachs' decline late in the day I talk about below, I think it's possible a major top is in. If correct, the amount of selling pressure will be enormous. If we don't get enormous selling pressure real soon, then most likely at least my short term wave count is wrong and that we'll eventually see higher levels soon. If that proves to be the case, the low 1180s should prove to be a very difficult ceiling for the bulls to break above. So regardless of the short term behavior of the market in the coming days, I expect tough resistance in the 1180-1185 area.


Goldman Sachs Declined in 5 Waves Today


One thing I noticed today was the fact that Goldman Sach declined in a nice 5 wave impulsive structure as you can see above. It doesn't get much better than this as far as EWP wave structure goes. Goldman's top back in April signaled the tops in many indices in the broader market back then (Goldman's April 16th top compared to the Dow and S&P's April 26th top. So even though this is just a 3min chart and not as reliable as a daily chart, perhaps these 3min charts above showing a late 5 wave decline is Goldman again is signaling to us that the broader market is topping too. We'll know soon enough. As long as Goldman stays below 145.50 then I view the overall market as extremely bearish. Above are the two possible counts for the corrective phase following the 5 wave drop and have equal weighting of probabilities in my opinion.

Judging by the non-impulsive looking declines in the major indices, it's possible they will pop up for one more new high while Goldman Sachs does not. In this case, the first scenario on top calling for at least one wave C rally before topping should be the preferred count. Goldman may then rollover while staying under 145.50 and the major indices may do so from new highs. This is very speculative, but the declines so far in the major indices do not look impulsive so it's possible they may have short lived new highs before topping. So watch Goldman Sachs and the 145.50 level tomorrow!


Bigger Picture


With all that said, let's look at the bigger picture so we know what we're focusing on. Wave (ii) should be topping soon, if it hasn't already done so today. The market opened down about 100 Dow points but rallied all morning into almost triple digit positive territory. So the bulls grabbed the reins and took control. However the rally was hard faught and choppy with moderately postive internals. Then later in the day, the bulls ran out of gas and the market rolled over, closing with bearish internals, and the indices started rolling over right after Goldman had already started to roll over mind you (Goldman Sachs appears to be leading the overall market lately). That reversal held into the close and it formed a nice reversal candlestick on the daily charts for the S&P.

So when you take this evidence and combine it the short term analysis I mentioned above, I see a good setup for the bears here to possibly catch a wave (iii) of 3 of [3] or C, which would be an extremely strong and sharp decline, well below the lows established last week. So because of the magnitude and profit potential for the bears at this point, I'm on high alert and am very actively trading right now to try and catch this top and reversal. If a top is in right now, there should be little mistake about it. The market should decline in an extremely sharp and unrelenting manner in the coming days.


Decline Structure Similarity


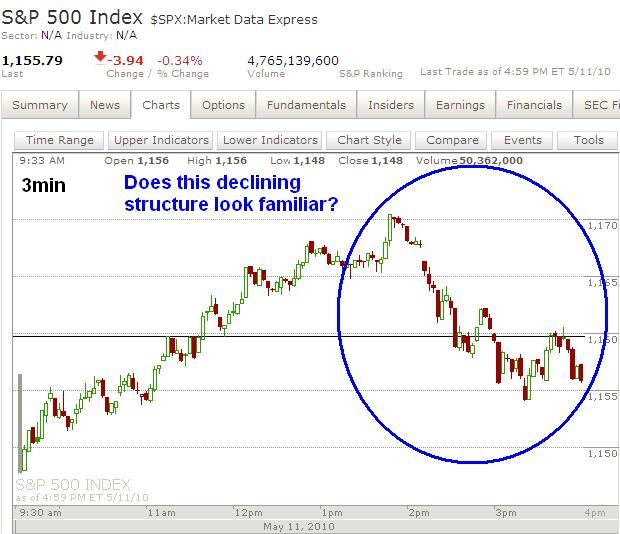
One note today that may put some doubt in the immediate bearish case. Looking at the above S&P structure on the 3min chart today bothered me. On the one hand we had Goldman Sachs, the market leader lately, declining in a beautiful impulsive manner, and on the other hand the major indices declined in this funky-looking structure. I recognized this pattern and knew I didn't like it. Then I looked back at the daily charts of the S&P and pulled up the last time most elliott wavers, including myself, thought the big wave 3 was underway back in January/February of this year. Notice that the structure of the decline then (see above daily chart blue circle), is very similar to the structure of the decline today on the 3min chart above. In both instances, you get this sharp decline that leads to a large bump and cluster at the bottom. The reason this concerns me is because this may be some type of corrective structure today on the 3min chart since back in January/February we saw the market bottom and rally to new highs after it occurred. Even though this may be true, and the market may make new highs above today's soon, I will still be watching Goldman Sachs closely to see if it also makes a new high or not. Goldman appears to be key right now for short term clarity.


PLEASE NOTE: THIS IS JUST AN ANALYSIS BLOG AND IN NO WAY GUARANTEES OR IMPLIES ANY PROFIT OR GAIN. THE DATA HERE IS MERELY AN EXPRESSED OPINION. TRADE AT YOUR OWN RISK.

Monday, May 10, 2010

Triple Whammy Fueling Rally; What is the Wave Structure?


The rally today was mildly unexpected, more due to its size than just the fact that it rallied. The S&P easily broke the 4th wave triangle interpretation I laid out last week as it blasted through 1138 first thing this morning. As you can see from the above screenshot of the internals of this market, the move up is very strong, and the bulls are in full control. The internals, sharpness and strength of the rally suggests it's a 3rd or C wave at some degree. I discuss the possibilities below.

I think there are 3 things (triple whammy) at the core of today's action:

1) Greece got a bail out

2) Shorts are covering on the news of Greece

3) The typical Monday fund manager buying spree is in effect again.

So the combination of the 3 above factors has lead to this monster rally today, in my opinion. Let's look at the possible wave counts:


Correction Closeup (chart added late)


Primary Wave Count


This is my primary count because the rally from the lows is quite steep and long, and most other bearish counts put this as a 4th wave. It just seems too big for that. The strength and depth fits more of a wave 2 rally. But there is a slight flaw in this count anyway. If you look at wave 1 and compare it to wave (i), you'll notice that the larger degree wave 1 is much smaller than wave (i), so it doesn't have EWP's "right look". But it's still a possibility, and this may simply be due to the major battle of bulls and bears that occurred to form the top in place which throws the perfect wave count structure off a bit. But it violates no rules, so its still well in play. Regardless, the magnitude of the selling prior to this rally, along with this rally on the heals of a Greece bailout everyone knew would happen, leave me believing that this count is the most likely of the choices we have.


First Alternate Count


The above count is also a possibility but the size of wave (iv) compared to wave (ii) makes this count more unlikely than my primary count. Normally wave 2s are sharp and deep affairs and wave 4s are flat muted affairs. This count suggests the opposite, so it raises a red flag with me. The good thing about this count is that if it's correct, the S&P cash index cannot enter any of the price territory of wave (i) which starts at 1181.70. So a break above 1181.70 invalidates this count; making it easy to trade around.

Second Alternate (bullish)


Lastly, it's possible the market is still in a bull run, and this recent selloff was just an ABC declube as charted above. This suggests new highs on the year soon, but the strength and depth of this ABC decline does suggests that the entire bull run from March 2009 is probably weakening and very near an end anyway.


So there it is, two top bearish counts and one bullish possibility. I do see opportunities for the bears at current levels, and even more opportunities if the market continues higher from here. Risk is also easily defined at the wave (i) low at 1181.70 or 1219.80 for the bears.


PLEASE NOTE: THIS IS JUST AN ANALYSIS BLOG AND IN NO WAY GUARANTEES OR IMPLIES ANY PROFIT OR GAIN. THE DATA HERE IS MERELY AN EXPRESSED OPINION. TRADE AT YOUR OWN RISK.

Friday, May 7, 2010

Triangle Most Likley Finishing Up, Then Big Thrust Down

Daily S&P Cash Index


So the market ignored the news of a "glitch" yesterday and continued selling today. If it was all or mostly just a technical glitch causing the big selloff midday yesterday, I would expect a nice bounce back today, especially after a good jobs report for the most part. But that's not what happened, and us elliott wavers knew better, and were skeptical of the whole glitch from the beginning since we've been waiting for massive selling in a wave [3] or C. Today the market continued lower, taking back a lot of yesterday's supposed "glitch" territory. Yesterday I wasn't sure about the whole "glitch" scenario being fed to us by the media, but thought that today or Monday would tell us for sure. The fact that we didn't go flat or rally big today and in fact had a triple digit Dow decline most of the day tells me that there was probably no substantial glitch at all yesterday and that in fact, the market wants to go lower to those levels established then. And the wave count I labeled in the second to last chart shows the perfect setup for yesterday's lows to be taken out too.

With that said, just look at the above daily S&P chart. Doesn't it look ugly? If I were a bull, I'd be nervous this weekend.


Russell 2000


Just to add to what I said earlier regarding the supposed "glitch" I wanted to post the Russell 2000 chart as well. You can see that this chart is even more ugly and worrisome to the bulls than the blue chip indices. This index wants to go lower, and fast. This thing isn't messing around at all. And you can see the long candlestick wick left from yesterday's supposed "glitch" movement that has more than half of it reclaimed by the index today. So again, if it was just a glitch and all the big shots believed it, why is the market going back down to those levels that the supposed glitch caused? After seeing today's action, I don't think there was a glitch at all, I just think the market tanked. But that's just my opinion.

One more thing; you may have noticed that the financial news is reporting that the Nasdaq is now officially in "correction territory" because it's declined more than 10% from the highs. The reason they only mention the Nasdaq is because it's the only one of the Dow and S&P that has reached the 10% mark. In fact, the small cap Russell 2000 index has also reached that territory, down about 12% from its highs. The fact that the high risk Nasdaq and small cap indices are leading the market lower is another sign that a large top is probably in since these indices lead on the way up, and lead on the way down.

So, is wave [3] or C underway? It sure looks like it. But in order to have confirmed that today I'd like to have seen the market get down to yesterday's intraday lows. It got somewhat close, but closed way up off of them. I'd say it's highly likely that a significant top is in, but only a break below 1045 and thus solidly breaking the uptrend of higher lows would confirm that wave [3] or C was in fact underway. A meltdown Monday that takes the S&P below today's lows, and especially below Thursday's will create a 5 wave down pattern from the highs, either on a closing basis and/or on an intraday basis. So if that happens Monday then I'd jump the gun a bit and state that it's highly likely wave [3] or C is underway whether or not 1045 is broken or not.


S&P 4th Wave Triangle


Above is an updated chart of my proposed 4th wave triangle I put out midday today. It's possible the triangle has already completed and the wave (v) thrust is now underway. But the choppiness of the decline leads me to believe it might just have been a wave 'd' of the triangle, which means another modest wave 'e' rally to complete the wave (iv) triangle. What this means is that when the wave (iv) triangle is complete, the market will thrust sharply lower beneath Thursday 1066 low. So there's a good opportunity for the bears to get aggressive for a short term move with tightly controlled risk. I'd like to see the wave 'c' high of 1129 remain intact for this particular triangle scenario to remain probable, but ultimately only a break above 1138 would negate this triangle as a 4th wave.


Alternate Wave B Triangle


One more note: even if 1138 is broken, I still think it's possible that wave [3] or C is underway. If 1138 is broken then we can just flip the triangle and make it a 'B' wave of an ABC correction; probably a fairly large wave 2. Now this is less likely since the triangle is getting quite long for wave 'c' and 'd' already, and making it into a wave 'B' triangle would make it even longer. But I just wanted to throw this out there as a less likely alternate count if 1138 is broken in Monday's trading.


PLEASE NOTE: THIS IS JUST AN ANALYSIS BLOG AND IN NO WAY GUARANTEES OR IMPLIES ANY PROFIT OR GAIN. THE DATA HERE IS MERELY AN EXPRESSED OPINION. TRADE AT YOUR OWN RISK.

Possible 4th Wave Triangle


Just a quick midday note: if you look at my count in yesterday's post you'll see we should be in a wave (iv) today and so far it appears a triangle might be forming as you can see above. If correct, when the triangle completes wave 'e', then it will thrust sharply lower in wave (v) to beneath yesterday's lows of 1066. To keep this triangle count a possibility, 1138 cannot be broken, but preferably the 1129 level will remain intact.


PLEASE NOTE: THIS IS JUST AN ANALYSIS BLOG AND IN NO WAY GUARANTEES OR IMPLIES ANY PROFIT OR GAIN. THE DATA HERE IS MERELY AN EXPRESSED OPINION. TRADE AT YOUR OWN RISK.

Thursday, May 6, 2010

Financial Thunderdome Back on


Quite a crazy day in the markets and there's a lot to go over even though the possibile explanations and theories about today are endless, and all that matters is tomorrow and Monday's price action anyway. Above are hourly charts of the S&P cash index with the candlestick chart charting the complete intraday moves in the market, and the line chart just printing the index on a closing basis to ignore the wild swing in the middle of the day. You can that under both counts we had a big selloff today with it obviously composing some type of wave 3. So "glitch" or not, today's action was very bearish and fits into the current wave count, which I labeled in the simplist and easiest way possible for now. I can easily see wave (iii) extending further down on the line chart tomorrow and/or Monday to complete better looking subdivisions for the wave though. We'll see.

So what the heck happened today? Well the selloff had 2998 stocks on the NYSE close down with only 173 close up. So that's over 17 stocks closing down for every 1 closing up. Volume was also huge at 2.5 billion shares when we've been seeing about just above 1 billion shares traded a day prior. Of that total volume, 95.6% was to the downside. So it was "crazytown thunderdome" on steroids today.


THE "GLITCH"


So the chatter on the financial news is that it was a "maching glitch" or a "fat finger" that made a mistake on a trade which triggered a domino effect across the markets for the 1000 point Dow selloff today. This is possible, but I'm not fully buying into that just yet. Ultimately, tomorrow and Monday will let us know what the market really wants to do: if the market takes back today's losses and rallies higher and higher, then it was probably just a glitch or trading error that caused today's steep selloff. But if the market charges lower and especially if it breaks beneath today's lows, then I highly doubt any error was made at all. I wouldn't doubt if a big fund(s) or bank bailed out of large positions because they see the wave [3] or C coming and the public is being told this "glitch" story to prevent public panic and Congressional and/or SEC scrutiny. But I have no evidence of that, it's only the conspiracy theory part of my brain thinking that. Tomorrow or Monday we should know the answer to this great mystery.

But if you're like me, then tomorrow is an eternity away, and you want to think about what happened and come up with your own conclusion beforehand. So let's logically run through this. The reason I have doubts about a glitch or fat finger causing the ENTIRE problem today is because of the following reasons:

1) The market was already under a lot of pressure from Greece and China and other European drama (PIIGS - Portugal, Italy, Ireland, Greece, Spain) before the selloff. It's not like this happened just out of the blue on a normal trading day.

2) I've heard mixed data in CNBC articles stating originally it was a Proctor and Gamble (PG) trade through Citigroup that caused this, and I've also heard that Citigroup made an error selling S&P futures contracts. But other articles state that Citi cites no trading errors, NYSE cites no errors either, and the volume numbers from Citi don't match up right with the selloff in question. So what's the real story here? And with all the technology and tracking we have today, how is such a huge trade that would cause a 1000 point selloff so hard to track down? It shook the financial world there for a while, don't you think they'd be able to track that down? So why is it all such a mystery even hours after the fact? Very suspicious.

3) It's a little too much of a coincidence that this "glitch" occurs at the same time Greece is in turmoil, China is struggling, Portugal, Italy and Spain are next in the debt monsters crosshairs, and the European Union is imploding? I mean of all times for a "glitch" selloff to occur it occurs now? Possible, but a bit too convenient perhaps.

4) If this was just a glitch then why wasn't it identified by the market and prices bid up to "pre-glitch" levels. Let's not forget the Dow still closed down 350 points, and the futures are still down. If it was a glitch, wouldn't this be a great buying opportunity? But so far, the big shots and smart money aren't participating. Why not? If it's just a clitch and it's now all but confirmed to be, why isn't the market skyrocketing higher?

5) Notice the below charts of some of the currency majors. They too fell with the stock market. Why did they fall with the "glitch", and more importantly, why haven't they fully recovered to pre-glitch levels now that everyone knows it's an error. The currency market should be much more resilient to a glitch than any stock market due to the massive size and liquidity. So what's going on here with currencies?


I'm not an expert on how the minute details of market functioning, so please tell me where I'm wrong on any of the points above. These are merely things that raise doubt in my head as to this whole "glitch" thing we're being told. It may be true, sure, but the markets will give us the answer soon enough. I'm sure Prechter already has his answer. I remain short and cannot confirm that wave [3] or C is underway since the market did recover substantially into the close. However, if we revisit and exceed today's levels in the coming days, and especially if we break 1045 soon, then I'd be comfortable stating that it is highly likely that wave [3] or C is underway and I'd be looking to get aggressively short at that point. So let's see what tomorrow and Monday bring us.

I welcome anyone's thoughts, opinions, criticisms, and data on my post today as well as on today's market action. Thank you!


Why did currencies fall victim to the "glitch" too, and more importantly, why haven't they recovered to pre-glitch levels?


PLEASE NOTE: THIS IS JUST AN ANALYSIS BLOG AND IN NO WAY GUARANTEES OR IMPLIES ANY PROFIT OR GAIN. THE DATA HERE IS MERELY AN EXPRESSED OPINION. TRADE AT YOUR OWN RISK.

Wow!


Wow, Dow down over 700 and S&P down over 100. I've said in previous posts that 1045 in the S&P was where we'd be able to strongly say that wave [3] or C was underway, but with the intense selling pressure today I'm going to pull that statement and put in a new one: as long as the market stays "heavy" and around current levels without a monster rally into the close, I'd say that it's highly probable that wave [3] or C has already started right now. It may be tough to get short now with a 700 point selloff, but just look at the steep decline from September 19, 2008 to October 10, 2008 and see how many entry opportunities there were; very few. I think over time it's quite possible for there to be good opportunities to enter anyway, but I just wanted to let you all know what I feel about today's selloff and that I've adjusted my entry point to get more aggressively short. So, barring a monster rally into the close, I think it's quite likely that wave [3] or C is currently underway.


PLEASE NOTE: THIS IS JUST AN ANALYSIS BLOG AND IN NO WAY GUARANTEES OR IMPLIES ANY PROFIT OR GAIN. THE DATA HERE IS MERELY AN EXPRESSED OPINION. TRADE AT YOUR OWN RISK.

StatCounter