Friday, February 4, 2011

Stock Rally Shows no Signs of Reversing; But Euro Appears to have Topped


Internals today were flat, usual for a Friday, although I expected a little more volatility on a jobs report day.  Currencies certainly moved big this morning, and the euro declined in five waves, but it seems like most market participants went home early for Superbowl weekend because after the morning action, the markets were fairly flat.  Volume supports this theory since only 919 million shares were traded on the NYSE.  The market's rally has lost enthusiasm but that doesn't eliminate the possibility of another upward shot Monday, but it does mean that the risk is to the downside and the next big sustained move will probably be down from here, not up.  With no evidence of a top in place, I cannot get short yet.  I can only wait for evidence to surface.


Closing below the trendline I drew here would be a good start to calling a top and trying the short side.  The trendline hovers around 1275 early next week, so we'll see what the bears can do.  Momentum is still diverging from price during the S&P's 5th wave as seen by the RSI.  So the wave count and momentum suggest this rally is ready to turn.  A close beneath the trendline and/or a nice impulsive 5 wave drop with solid volume would also be nice for a bearish trade to be executed with confidence.

Enjoy the Superbowl!  I like both teams and believe both equally deserve the victory this year.  But if I had to pick a side I'd have to go with the Packers since I think they are playing superior defense right now, and they'll get to Roethlisberger all night making it very difficult for Pitt to get anything done on offense.  Cheers!

Learn Elliott Wave Principle


PLEASE NOTE: THIS IS JUST AN ANALYSIS BLOG AND IN NO WAY GUARANTEES OR IMPLIES ANY PROFIT OR GAIN. THE DATA HERE IS MERELY AN EXPRESSED OPINION. TRADE AT YOUR OWN RISK.

Euro Declined in Five


The euro declined in 5 waves and broke below the key level of 1.3569 in the process.  I mentioned the 1.3569 level as a key level yesterday.  A close beneath 1.3569 today would be very bearish in my view and any resultant rally next week would get me to pound the short side of this currency.  The rest of the majors look bullish the dollar as well, other than the AUD/USD which I think is in an ending diagonal and should drop in a dollar rally against it soon.  With a clear 5 down and breaking to a new low in the process, the euro is worth the risk/reward to short on rallies in my view.

More on stocks later if anything develops.


PLEASE NOTE: THIS IS JUST AN ANALYSIS BLOG AND IN NO WAY GUARANTEES OR IMPLIES ANY PROFIT OR GAIN. THE DATA HERE IS MERELY AN EXPRESSED OPINION. TRADE AT YOUR OWN RISK.

Thursday, February 3, 2011

Waiting for Unemployment Data Reaction; Euro Decline Shows Bears Still Have Life


Not much to report on a “do-nothing” day. Market participants appear to be waiting for the big unemployment number coming out tomorrow morning. So expect some volatility heading into tomorrow’s US market session. The internals today show a flat market on low volume and basically tell us we need to wait for tomorrow’s jobs report to get a better idea of short term direction. With the market so overbought and outstretched in price, optimism, the wave count, and momentum, the odds favor that volatility tomorrow will result in a downward move. However that’s just an educated guess at this point since there are no signs of the uptrend being broken in stocks just yet.


The wave count remains the same in that the S&P is in a Minor wave 5 that should be in its final stages. This is supported by the diverging momentum as shown by the RSI trailing downward while price continues higher, and the weaker internals on each rally with light volume mixed in, all suggesting the rally is tired. Now we’ve seen tired rallies before continue on and on and on upward for days/weeks, so jumping in short here is a risky move. I’ll leave that to the high risk speculators and day traders. But for swing traders like me, I’d like to see some evidence of a top with a clear and close stop loss level to control risk. I don’t have that yet, so I have to continue to wait. Perhaps tomorrow’s jobs report will give that to me.

Learn Elliott Wave Principle


Amazingly, the Nasdaq Composite still has not yet made new highs like the Dow and S&P. Normally I would consider this a very bearish development for the overall market. But as it sits right now, if the Composite were to decline from current levels it would mean a triple top was in place, and triple tops are extremely rare and shouldn’t be counted on at all in my view. So I’m not counting on that happening. This suggests at least one more upward pop before a top and reversal can occur. A failure to make that new high and then declining below 2677 would be extremely bearish in my view and suggest there is so much weakness in the Composite that it couldn’t even resolve the triple top affect properly before topping.

So in summary, it’s a waiting game until signs of a top enter the market and we can control risk with a high confidence short trade. I’m going to wait for the market to come to me and play into my setups, not try to impose my will and impatience on the market and get in too early. So I’m waiting.

Trendlines: How a Straight Line on a Chart Helps You Identify the Trend


The euro did exactly what it needed to do if the remaining bearish potential were to remain alive by declining hard today and closing near the lows on the day. The decline looks impulsive, but needs a few more new lows to make it more of a certainty. A daily close beneath 1.3569 would be extremely bearish in my view and get me to pound the short side Sunday night.

Let’s see what action follows the employment report tomorrow and see if there’s a play to be made…

PLEASE NOTE: THIS IS JUST AN ANALYSIS BLOG AND IN NO WAY GUARANTEES OR IMPLIES ANY PROFIT OR GAIN. THE DATA HERE IS MERELY AN EXPRESSED OPINION. TRADE AT YOUR OWN RISK.

Wednesday, February 2, 2011

Markets Took the Day Off

New posting schedule:Monday, Wednesday and Friday - Brief summary posts
Tuesday and Thursday - In-depth posts


Stocks took the day off today and just flip-flopped sideways on very low volume (934 billion shares NYSE), although the bias internally was bearish since more declining volume hit the tables than advancing volume, and especialy in the S&P there were a lot more declining issues than advancing issues.  When you add it all together it fits well as a 4th wave at some small degree.  The Nasdaq Composite still has not made a new high along with the Dow and S&P which I mentioned yesterday, and it has been lagging the two big indices the past couple weeks.  I'm doubtful that divergence will hold though, and if the S&P is in a 4th wave then it all adds up to at least one more push higher to new highs for the market before we can even think about a top again.  Yesterday's big up day on solid volume and internals leaves me very cautious of being too aggressive too soon on the bearish side.  Oftentimes those types of days act as launching pads for the next week or so unless the bears come in and push the market down convincingly in price and internally.

Once the market tops and reverses we should see at least a 100 point S&P decline so trying to catch the absolute top seems unnecessary and foolish to me.  Once I see a evidence of a top, and especially confirmation of a top, I can again try getting short.  Until then, I wait.

As for the euro, the rally haulted today but has not made a convincing decline to suggest a top is in place.  Although a top can happen anytime, until there's evidence to suggest it's in, I'm staying on the sidelines for now.

Full post tomorrow....

Learn Elliott Wave Principle

PLEASE NOTE: THIS IS JUST AN ANALYSIS BLOG AND IN NO WAY GUARANTEES OR IMPLIES ANY PROFIT OR GAIN. THE DATA HERE IS MERELY AN EXPRESSED OPINION. TRADE AT YOUR OWN RISK.

Tuesday, February 1, 2011

Dow and S&P to New Highs Means it's "Scotch Night"

It’s days like today that I end up curled up in a ball, underneath a blanket, on the cold linoleum kitchen floor sobbing next to a half empty bottle of scotch as my dog looks on at me like I need some serious counseling.  But I’m able to pull myself together and crawl out from under the kitchen sink and face the music.  Today’s new high in the S&P was very discouraging.  The evidence was quite overwhelming and promising that a significant top was in.  I’m not saying the Primary wave ((2)) top was called, but at a minimum a 100+ point S&P pullback looked good.  But no dice!  At least not yet.
I’m down, but not defeated.  Let’s get hookin’ and jabbin’ again.


The internals today were extremely bullish and basically matched the intensity of Friday’s selloff.  Although volume was very high at 1.09 billion shares traded, of those shares 87.2% traded to the upside and there were a whopping 1,943 more advancers than decliners on the NYSE today.  It seems quite obvious now that Friday’s selloff was probably mostly profit taking after a large and long rally to round number resistance (12,000 Dow and 1300 S&P) on the back of the Egyptian unrest.  Since the bears went back into hibernation, the bulls were able to come back to take control of the market again.  With internals like this it’s hard to call a top here with any evidence to support it.  Doing so would be a guess, and I don’t put my money on guesses outside of Las Vegas.  Barring an immediate, and just as strong, reversal to the downside tomorrow, today’s push suggests further upside in the coming days.  There are several possible scenarios for the next few days, and sharp ups and downs with little upside progress is definitely a possibility as it would represent  an ending diagonal which is quite common at the end of overstretched trends.  So today’s rally doesn’t eliminate the bigger bearish case, it just puts it on hold and hits the “reset” button to make us wait until the evidence suggests the bears might come in again.

The S&P count remains the same; it’s in the final stages of Minor wave 5 which, when complete, will lead to at least a 100 point S&P selloff.  I’m not going to try and pick a top in the heart of the rally, I’m simply going to wait for another sign of weakness for an opportunity to short when the evidence supports it. 
Learn Elliott Wave Principle


Despite the strength in the Dow and S&P, and even the Nasdaq 100 that pushed them to new highs, the Nasdaq Composite has still failed to do so.  Now I doubt this will hold since it would mean a triple top is in place and as I’ve said many times triple tops are extremely rare.  But the lagging in the higher risk tech stocks supports the lagging RSI indicator, which all still supports the 5th and final wave scenario. 

Interestingly enough, a VIX buy signal executed yesterday since it closed above the upper Bollinger band Friday, and then closed below it yesterday.  Stocks wasted no time at all getting their resultant rally underway telling me that the trend is still firmly higher.  Barring a sharp and just as strong reversal tomorrow, I’d stay out of this rally’s way for the time being.


The euro’s 3 wave looking drop has come back to haunt me.  The weak recent rally, the Australian dollar’s impulsive decline, and diverging momentum, all suggested the pairs would fall and the dollar would rise.  But that 3 wave drop in the euro on the daily chart always nagged at me and it looks to be the one signal I should have focused on.  After making a new high and taking out most viable resistance areas, the 1.4281 level looks vulnerable here.  As in stocks, I’m stepping aside and waiting for weakness to resurface before I make a move on the euro.
Trendlines: How a Straight Line on a Chart Helps You Identify the Trend


PLEASE NOTE: THIS IS JUST AN ANALYSIS BLOG AND IN NO WAY GUARANTEES OR IMPLIES ANY PROFIT OR GAIN. THE DATA HERE IS MERELY AN EXPRESSED OPINION. TRADE AT YOUR OWN RISK.

Monday, January 31, 2011

Wave 2

New posting schedule:

Monday, Wednesday and Friday - Brief summary posts
Tuesday and Thursday - In-depth posts


Stocks should be in a wave 2, correcting the initial 5 wave decline I labeled in Friday's post.  I cited 1290 as a good resistance area and that still holds true.  I expect the rally to continue to at least tomorrow, but as long as it holds underneath 1302.67 I'd be shorting this rally regardless of how long it lasts.  In Friday's post I mentioned that it would be likely we get a rally today and perhaps tomorrow so the market is moving as planned.

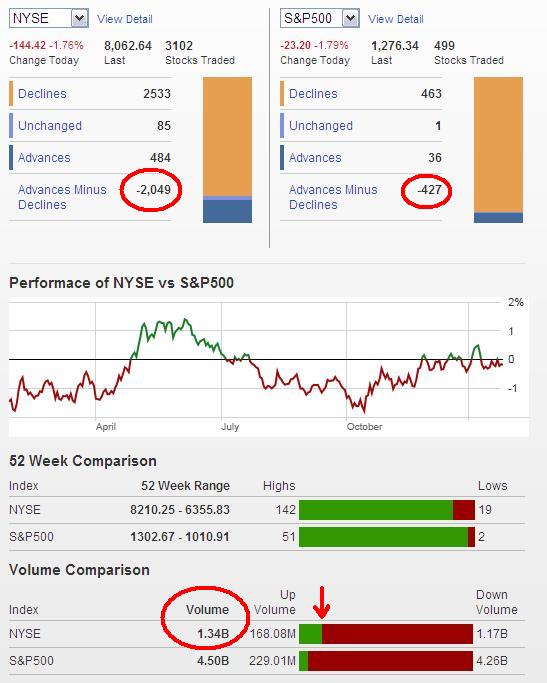
Looking at the internals we see strong action backing today's move higher, but it doesn't match the ferocity of the bears' move downward last Friday.  For instance, there were 2049 more decliners than advancers Friday while today there were only 1139 more advancers than decliners, giving the bears an advantage of 910 NYSE shares.  Down volume was 87.3% of total volume while today up volume was only 67.6% of total volume today, an almost 20% bear advantage.  Total volume Friday was 1.34 billion (big for a Friday especially) versus only 1.19 billion shares traded today.  So the internal composition of today's rally is far weaker than the internal composition of the decline Friday, suggesting that today's move was merely correcting Friday's decline.  Look for new lows to come soon.

As for the euro, it snapped back sharply today but did not make a new high, neither did the Aussie, although the British pound did make a new high.  I'm very bearish the euro as long as new highs aren't established so the risk/reward is phenomenal here since I believe the euro is headed to parity with the US dollar eventually.

Learn Elliott Wave Principle


PLEASE NOTE: THIS IS JUST AN ANALYSIS BLOG AND IN NO WAY GUARANTEES OR IMPLIES ANY PROFIT OR GAIN. THE DATA HERE IS MERELY AN EXPRESSED OPINION. TRADE AT YOUR OWN RISK.

Friday, January 28, 2011

Bears Show Teeth, Top Looks Good Here; Euro Uptrend Broken

 I'm going to cut back my postings and saturate a few postings per week with the core elements to focus on. Since EWI's Short Term Update comes out Monday, Wednesday and Friday, I will post my core thoughts and charts Tuesday and Thursday to help fill in the gaps that many wavers might feel they have. On Monday, Wednesay, Friday and sometimes Sunday I will post internals data and brief comments on the day's action.


Internals were very weak today as you can see above.  There were 2049 more decliners than advancers on the NYSE, down volume was 87.3% of total volume, 463 S&P 500 stocks closed down, and total volume on the day was 1.34 billion NYSE shares, which is quite high for a Friday.  All-in-all, it was a very bearish day today and a lot of profit taking, and fear, entered the market today.  A solid bear victory no doubt, and it now leaves the doors open for some significant and sustained follow-through.  Whether this is just a mild pullback after hitting the round numbers yesterday (Dow 12,000 and S&P 1300), or whether it's the start of the monster Primary wave ((3)) many wavers have been waiting for will take a while to confirm.  But the odds are high right now that at least a significant top is in place and another 50-100 S&P points should be taken out in the coming weeks.

Basic Wave Patterns: How a Zigzag Differs from a Flat


Above is my intraday count of what might be transpiring.  After Subminuette wave i completed there has been little rallying from the low, and in fact, the market pretty much closed on its lows, another bearish behavior on the day.  However, if my count above is correct, then Micro wave ((C)) will give us a sharp rally to around 1290 on Monday-Tuesday before the next selling phase ensues.  If so, it would be a great shorting opportunity in my opinion.  The other scenario leaves Subminuette wave ii already complete at the Micro wave ((A)) high I have labeled, and Monday will bring about even sharper and deeper selling.  I doubt that though.  Mondays are usually strong and the buy-the-dip crowd should be back in force after thinking about all the "great values" they can get over the weekend after the declines today.  The one thing the bears don't want is a slow choppy grind lower we've called the "wolf wave" in the past.  Those are usually corrective and quickly lead to a monsterous rally as a result. 

So there's your setup for next week; the trend should be down at least for the short term, and if we're lucky enough to get a solid bounce on Monday then I'd be shorting into it.  I expect at least another 50-100 S&P points to be shaved off in quick order if a top is in place right now.

Learn Elliott Wave Principle


The evidence for a top in the euro is strong (bottom in the US dollar).  The choppy grind higher clearly looks corrective and is a weak structure suggesting a sharp pullback is at hand.  The uptrend has been broken now and I expect the trend for the euro to be down against the dollar in the coming days/weeks.  That means I'm bullish the US dollar now.  I feel the euro is headed to parity with the USD eventually, so this would represent a great risk/reward opportunity for who feel the same way.

PLEASE NOTE: THIS IS JUST AN ANALYSIS BLOG AND IN NO WAY GUARANTEES OR IMPLIES ANY PROFIT OR GAIN. THE DATA HERE IS MERELY AN EXPRESSED OPINION. TRADE AT YOUR OWN RISK.

Thursday, January 27, 2011

Stock Bulls Remain in Control; Euro Looking Shakey

I'm going to cut back my postings and saturate a few postings per week with the core elements to focus on. Since EWI's Short Term Update comes out Monday, Wednesday and Friday, I will post my core thoughts and charts Tuesday and Thursday to help fill in the gaps that many wavers might feel they have. On Monday, Wednesay, Friday and sometimes Sunday I will post internals data and brief comments on the day's action.


Internals today show a boring and lethargic market. Yet, with no bears in sight, the exhausted and overstretched bulls can still chop the market higher like a heavyweight boxer trying to get through the 12th round. Volume was very light today as not even 1 billion shares traded on the NYSE. Up volume exceeded down volume but did so with a 59.5% advantage and yesterday it practically did the same on Fed day with 59% more advancing volume than declining. Yet yesterday at 1.12 billion shares traded yesterday, much more than today, and had 1169 more advancers to decliners while today had only 364 more advancers. So the ratio of bullish to bearish volume mirrored yesterday’s, but the ferociousness dissipated quite a bit today since total volume was much lighter and there were much less advancers today. Tomorrow is a Friday and should bring about even less enthusiasm internally, and three days in a row of flat-to-down internal strength would be a nice supplement to a 4th or final 5th wave. So we’ll see.

What Most People Don't Realize About The Fed's Superpowers


The wave count is in line with the internals data the past couple days, and another declining day internally tomorrow would put this thesis on solid ground in my view. Notice that Minor wave 5 has diverging momentum (red lines) as seen through the RSI, and that even the latest push higher is also diverging so far (blue lines). This is typical 5th wave-like behavior. I’ve adjusted my long term count to a more probable scenario, leaving the entire rally from the March 2009 lows as a simple (A)(B)(C) correction instead of a (W)(X)(Y) combination correction. The reason I liked the combination correction is because there aren’t clear 3rd waves in the heart of the initial large move off the March 2009 lows, and dividing up the move as much as possible made it more likely I thought. But at this point, leaving the combination correction in place is getting too complicated and unlikely with a big flat correction in the middle of it which is now exceeding its likelihood of occurring with the long rally we’ve been having the past several weeks. And now we can see two clear 5 wave rallies off the March 2009 lows. So an ABC seems like the easiest and most likely scenario.

Needless to say, if the above count is correct, the next selling phase will be quite a sight to see. But we wavers have been waiting for this for what seems like an eternity, so I’ll wait for the market to prove to me it wants to tank hard instead of trying to pick an exact top of Primary wave ((2)) every day. But even if it’s not Primary wave ((2)), a 100-150 point pullback in the S&P to correct the 5 wave rally off the 1010 level would not be out of the question anyway. So the next big move should down, whether it’s 1000 points, or 100, it’s still a bearish opportunity.

Learn Elliott Wave Principle


The above chart shows a wave relationship that is typical of impulse waves where wave 1 will equal wave 5 in price. Wave 5 actually equals wave 1 at 1290 and perhaps the modest push higher to the nice round number of 1300 is just simply to get the index to a nice round psychologically desirable number before topping. Keep in mind the Dow is also at a key psychological round number at 12,000. Will it top and reverse here? Probably not, it’s too obvious. Perhaps a flat market tomorrow and then another rally early next week will top this thing off. Those who took profits at 1300 hundred will not see a big pullback and then jump in to target 1400 with impatience. That will probably mark a top since most of those types of traders get fooled. But until we get signs of a significant top being in place, we need to be prepared, and expect, higher levels.


Lastly I wanted to show the MACD data above. I know that these basic momentum indicators are horrible for timing and don’t do us much good until it’s too late, but it’s worth noting in the larger scheme of things that the moving averages in the MACD are diverging from price in the S&P also in Minor wave 5, and they are hovering at levels that have marked where some significant tops have formed in the past year. Just look at the red circles on the MACD and their corresponding tops on the chart above. But as you can see, the moving averages remained at these levels for quite some time and they didn’t really tell us when the market had topped and reversed until it was basically too late. So this doesn’t tell us the market will top tomorrow. But this indicator, along with the wave count and RSI, tell me that the market is more likely to top and decline than it is to shoot to the moon higher from here in a long sustained rally. Once we get a break down of the uptrend, I’ll announce it here and the bears can look to attack again. Until then, I’m waiting.

Basic Wave Patterns: How a Zigzag Differs from a Flat


The AUD/USD is still posting the best waves for us to count and continues to show more weakness compared to the euro against the US dollar suggesting that it's leading the majors.  The euro may not be sporting a clear wave structure, but the choppy and sloppy rally with diverging momentum as shown in the stochastics and RSI tell us that this rally is probably coming to an end soon.  Now there is no evidence to suggest that a top is occurring right now, so the bears should still be patient.  I'm also concerned at the 3 wave-looking decline from 1.4281 that suggests the euro needs to rally above it before establishing a major top.  But with the AUD/USD sporting a good wave structure and excessive bearishness compared to the other majors against the USD, I remain a bear, which means I'm bullish the US dollar.  I'm not ready to get short the euro just yet though.  Still need to see a break of the uptrend.


PLEASE NOTE: THIS IS JUST AN ANALYSIS BLOG AND IN NO WAY GUARANTEES OR IMPLIES ANY PROFIT OR GAIN. THE DATA HERE IS MERELY AN EXPRESSED OPINION. TRADE AT YOUR OWN RISK.

Wednesday, January 26, 2011

Fed Out of the Way, Bears Ready to Roar? (Note: new posting schedule)

The past few months I've found it more and more difficult to convey a thesis of the market that's different than the day before.  Well this is the nature of a bull market I suppose, slow and boring.  So instead of gettting to the point where I feel I'm just creating stories where there aren't any, I'm going to cut back my postings and saturate a few postings per week with the core elements to focus on.  Since EWI's Short Term Update comes out Monday, Wednesday and Friday, I will post my core thoughts and charts Tuesday and Thursday to help fill in the gaps that many wavers might feel they have.  On Monday, Wednesay, Friday and sometimes Sunday I will post internals data and brief comments on the day's action.  I'll also take requests to post things or discuss things from readers during that time as well.  Just email me at waver2011-1@yahoo.com


Today was another wild day with little changed at the end as far as price is concerned.  However Tech managed the best, and the internals were quite bullish at the close.  We had decent volume at 1.12 billion shares traded on the NYSE, but up volume was quite higher than down volume, and there were a whopping 1169 more advancers than decliners on the day which is quite high considering the modest gains in the indices.  Again, the bulls are showing that they are still in control. 

It may seem likely that a top is at hand since this market is well outstretched, but there are no signs of the bears coming in to take control at the moment so we should expect higher levels.  One piece of bearish evidence we had was the lagging behavior in the S&P compared to the Dow, but today the S&P made a new high, erasing the bearish divergence in the indices I've been discussing lately.  The Nasdaqs are still lagging, but nothing supports a decline from here that would be needed to confirm that divergence, and the Nasdaqs well exceeded the Dow today making up some solid ground.

So although the wave count, sentiment and momentum measures suggest a top is near, there is no confirmation or evidence that a top is at hand.  So again, we wait for Minute wave ((v)) to complete. 

Learn Elliott Wave Principle

THE EURO

As for the euro, the rally lately has been relentless, but has gotten more and more choppy lately.  The RSI is diverging now from price up to the 4 hour charts.  Both suggest this rally is getting tired and stretched.  Once something occurs to suggest a top is in I will announce it here and we can try and catch a big wave down toward parity.


PLEASE NOTE: THIS IS JUST AN ANALYSIS BLOG AND IN NO WAY GUARANTEES OR IMPLIES ANY PROFIT OR GAIN. THE DATA HERE IS MERELY AN EXPRESSED OPINION. TRADE AT YOUR OWN RISK.

Tuesday, January 25, 2011

Stock Bulls Still in Control; Euro Bulls as Well


A lot of volatility today, but in the end nothing really happened as the market closed about flat on the day.  The weakness in the morning looked like a nice start to some bearish control and perhaps solidifying the call for a top.  But obviously the bears lost their footing and gave up to a big rally into the close.  Internals don't tell me much as it's all pretty normal and in line with the closing prices in the indices.  So as far as the internals go, it tells us nothing as to what the short term trend may be.  However, price action does lend itself to the bullish side at the moment.

How a Simple Line can Improve your Trading Success


I've been showing this chart above comparing the Dow with the S&P and Nasdaq 100 the past few days to show the diverging behavior.  My thesis is that when investors flee higher risk assets in the S&P and Nasdaqs and go to safer assets that are in the Dow, it's often a warning sign of fear re-entering the market and that a selloff about to come.  So far the market has held up real well and it doesn't appear it's done rallying for the moment though.  So I don't know how much longer this chart will be worth showing.  But at the moment, the divergences are still in place, so this chart still has value. 

As for the wave count, today's rally in the S&P was strong and closed on the highs again today.  However it is still below last week's high of 1296.06, unlike the Dow, so as long as that divergence is in place we should keep an eye out for a top.  The wave count is unclear as a series of 3 waves have been flopping all over the place and last week's high is in shouting distance of being taken out, negating the call for a top already in place.  Aggressive traders might want to consider getting short now with a stop just above 1296.06, but I'd rather short on weakness here, so I'd put a sell stop just beneath today's low.

I know this post may seem confusing when looking for solid direction of the market.  But I don't see it right now.  It's a mixed picture and I'm just calling it as I see it.  And the bottom line is that the stars were lined up for a top to be in place for the past week, and a couple times it appeared the bears were entering to take down this market.  But they have failed SO FAR.  At the moment, it feels like the market wants to go higher, despite the bearish evidence to the contrary.  We'll see if the volatility surrounding the Fed hype clears things up.

Learn Elliott Wave Principle


Nothing has changed with my outlook on the dollar.  It's still a mixed picture with the AUD looking very weak and declining impulsively on the 2 hour chart, but the euro seems indistructable and keeps surging higher.  The euro is not sporting a clear wave count in either direction, but the AUD is, so I'll focus on it.  If the wave count above is correct, the aussie should be headed much lower and real fast at any moment.  This should also result in a euro decline (US dollar rally). 

PLEASE NOTE: THIS IS JUST AN ANALYSIS BLOG AND IN NO WAY GUARANTEES OR IMPLIES ANY PROFIT OR GAIN. THE DATA HERE IS MERELY AN EXPRESSED OPINION. TRADE AT YOUR OWN RISK.

Monday, January 24, 2011

Stocks Surge, but Indices Still Diverging; Euro Still in Rally Mode


The bulls came in and surged the market higher, held it up all day, then pushed to close at the highs.  Advancers well exceeded decliners both on the NYSE and the S&P as you can see above.  Up volume was bullish, but not as impressive as I though it would be for such a big up day.  And total volume was sad at not even 1 billion shares traded today.  With the Fed announcement coming later this week, perhaps we'll get some volatility and volume entering the market, but for now the bulls have flexed their muscle and will try to control this market.  We'll see if they have anything left in the tank.

As for the wave count, the S&P looks like it may have topped, and the Nasdaqs look even better in that respect.  However there is little room left for this count to remain valid, and with today's strong surge and close on the highs, it's hard to think we'll selloff first thing in the morning.  But as long as 1296.06 remains intact, the count remains on the table.  We'll see what happens tomorrow and if the bears can push back these overconfident bulls.  The Nasdaqs still have a long way to go to confirm the Dow's new highs so even if the S&P does break above 1296.06, the Nasdaqs non-confirmation of those highs is still bearish as long as it's stays in place.

Learn Elliott Wave Principle


Above is a comparison of the Dow, S&P and Nasdaq 100 indices illustrating what I mentioned above.  You can see that the Dow, holding the safest stocks on the market, is well exceeding the S&P and Nasdaq 100 which hold higher risk stocks.  This is usually bearish behavior and shows a mild flight from risk that usually precedes tops.  As long as this lagging behavior remains in place, especially in the Nasdaqs, the more likely a significant top is at hand.  But as usual, these tops tend to take forever to occur.  So be patient, and stay solvent.

How a Simple Line can Improve your Trading Success


The US Dollar took a hit today and the euro benefited and rallied strong again today.  The rally appears quite choppy, like an ending diagonal, but the wave count is unclear at the moment.  There are a lot of 3 wave moves all over the place which means some type of corrective behavior occuring, yet the Australian dollar vs. the US dollar is unfolding in clear EWP waves, and adhering to fibonacci retracement levels.  As long as this continues in the AUD/USD, I'll remain bearish (so bullish on the US dollar).

Learn Elliott Wave Principle


PLEASE NOTE: THIS IS JUST AN ANALYSIS BLOG AND IN NO WAY GUARANTEES OR IMPLIES ANY PROFIT OR GAIN. THE DATA HERE IS MERELY AN EXPRESSED OPINION. TRADE AT YOUR OWN RISK.

Friday, January 21, 2011

Into the Weekend

Options expiration gave us some volatility in the morning but it has since faded.  I don't expect much action the rest of this Friday but so far only the Dow has made a new high.  As I said yesterday, a new high in the Dow would gives us a "restart" on trying to get an impulsive decline which it had yet to achieve while the Nasdaqs and S&P appeared to already be in impulsive declines.  We got that today and the S&P and Nasdaqs haven't followed.  So this divergence remains in place, and a turn down from near current levels could be extremely bearish.  But we'll probably have to wait until next week to see if that happens.

As for the euro, it has rallied again and it appears it may be entering a blow-off type top.  It's still overbought and a bit choppy, so I'm not bullish the euro, and the US dollar is looking strong against other currencies so I'm still not convinced the euro will soar much higher.  But until we get some bearish action in the euro. a charge toward 1.4300 cannot be ruled out since the decline from that level could be counted as a 3 wave move.  The AUD/USD however is still weak and sports a clear and full EWP structure and doesn't appear to be flipping bullish anytime soon.  So it's a mixed picture here and we need to wait to find out which one of these gives way and follows the other unison like they usually do.  So I'm still cautiously bullish the US dollar, bearish the Australian dollar, but the euro worries me a little.  Have a good weekend!

Learn Elliott Wave Principle


PLEASE NOTE: THIS IS JUST AN ANALYSIS BLOG AND IN NO WAY GUARANTEES OR IMPLIES ANY PROFIT OR GAIN. THE DATA HERE IS MERELY AN EXPRESSED OPINION. TRADE AT YOUR OWN RISK.

Thursday, January 20, 2011

Stocks Look Bearish but Dow Might Eek a New High; US Dollar Looks Strong


Internals today don't tell us much but that some extra volume hit the market today, probably explaining the volatility on the day.  Down vs up volume was slightly bearish but there were quite a few more decliners than advancers (721) on the NYSE.  Although the bears couldn't follow-through with more selling pressure this afternoon, the bulls were unable to get the main indices in the green despite the late day push.  The internals and price action still suggest a bearish market right now.


Again the higher risk tech stocks, as illustrated here through the Nasdaq 100, is outpacing the high caliber blue chip stocks in the Dow to the downside this week.  To me, this illustrates some fear in the market since folks are ditching their higher risk assets and moving into lower risk assets in the Dow.  The S&P, and pretty much all indices, are outpacing the Dow to the downside at the moment, suggesting at least a short term flight from risk.  That's bearish for the market moving forward through the next few days at least.

Learn Elliott Wave Principle


The one slightly bullish piece of evidence I see is the choppy decline in the Dow.  The Nasdaqs and S&P appear to be declining impulsively, although it's too early to get married to a count on them yet so I won't bother posting them yet.  But to see my longer term wave count I posted a few days ago, click here.  But the Dow's price action is clearly corrective.  That suggests that at least the Dow will make a new high before the overall market continues selling off.  This is not a requirement, in fact today's push higher in the Dow that failed to make a new high may be a truncated 5th wave.  However those are extremely rare, so don't count on it, just be mindful of it.  The best case scenario for the bears would be to see the Dow eek out a new high tomorrow without the S&P and Nasdaqs following along, then the market reverses to the downside with that divergence in place.  But regardless, without over-projecting the technical movements of future price action, the market looks bearish right now and any rally in the S&P that's capped at Tuesday's high would be a good shorting opportunity in my view.


The AUD/USD held up to yesterday's expections in that it topped out at the 61% fibonacci level and then sold off hard.  I'm unsure of the larger wave count so please don't hold me to the wave degrees at this moment.  The euro, on the other hand, also held up to yesterday's expectations by doing its own thing and not tracing out any clear patterns in the short term at all.  So if we go to basic technical analysis we see the euro having trouble getting through previous resistance at the 1.3460 area.  And the latest short push to a new high has not been confirmed by the stochastics and RSI.  When you add this together with the structure of the AUD/USD, it still has a bearish picture for the euro.

How a simple line can improve your trading success.

PLEASE NOTE: THIS IS JUST AN ANALYSIS BLOG AND IN NO WAY GUARANTEES OR IMPLIES ANY PROFIT OR GAIN. THE DATA HERE IS MERELY AN EXPRESSED OPINION. TRADE AT YOUR OWN RISK.

Wednesday, January 19, 2011

Risk is Peeling Back, Stocks May Have Topped; US Dollar Mixed


Internals today were very bearish as you can see.  Down volume dwarfed up volume, and decliners on the NYSE far exceeded advancers.  The bears roared today, but they did so in small numbers with just above 1 billion NYSE shares traded, it wasn't a jaw dropping day.  But it may just mean it wasn't a compitulation-type selloff that often is just a one day event and reversed immediately after.  I think today was a sign of more selling pressure ahead.  We need more market action to unfold for me to be more confident in stating that a top is in, but I know I'd try to start getting short with a tight stop ASAP.  The risk/reward here in combination with the bearish evidence is too good to completely pass up in my opinion.


The above charts illustrate what I mentioned yesterday in that we may be seeing an exit from risky assets and an entrance into more conservative assets.  This may be way the Nasdaq 100 has dipped out of the rally early and sharply while the Dow has held up quite well so far this week.  The S&P also took a big hit today, probably because there are still a lot of fairly high risk and speculative stock in the index, unlike the Dow.  So two days in a row we've had this behavior.  Will it continue?  The longer it does, the more likely a significant top is in place, and not just a minor two day lasting top.  Also note the 5 wave decline I mentioned in the Nasdaq 100 this morning here.

The bottom line is the market's recent rally is overextended in price, sentiment and momentum, and the 5 wave rally on the daily charts and now the small 5 wave decline on the intraday charts suggest at least a fairly large pullback is in the cards now; if not a total market collapse for Primary wave ((3)).  I would at least be nibbling on the bearish side right now.  The risk/reward is too good to pass up in my view.

Learn Elliott Wave Principle


The US dollar picture is mixed when looking at the euro and Australian dollars.  The euro is not sporting a clear impulsive decline and I see a big 3 wave drop on the daily chart staring right at me.  That suggests we need a new high at least above the 1.4200 level before thinking a major top is in place.  The euro broke above my key level of 1.3465 but did not sustain it, and the price action and momentum look weak.  In addition to that, the Australian dollar vs. the US dollar is sporting a textbook EWP structure with a 5 wave decline and a 3 wave rally stauling at the 61% fibonacci level.

My bias is to the short side here for the euro and Australian dollar, and therefore I'm bullish the US dollar.  But I'd still be cautious and make sure risk is managed tight here.

How a Simple Line Can Improve Your Trading Success

PLEASE NOTE: THIS IS JUST AN ANALYSIS BLOG AND IN NO WAY GUARANTEES OR IMPLIES ANY PROFIT OR GAIN. THE DATA HERE IS MERELY AN EXPRESSED OPINION. TRADE AT YOUR OWN RISK.

Brief Morning Update; Bears Can Start Nibbling


With the Nasdaqs being the higher risk of the major indices it's always important to watch what they're doing as part of the analysis process of the overall market.  Yesterday and today the Nasdaqs have been weak, and the internals are the same.  The strongest index which holds the bluist of the blue chip stocks is the Dow and it's fairing the best this week, suggesting people are moving out of risk and into "safety".  This behavior often acts as a precursor to a selloff phase.  Also, notice the amount of down volume relative to up volume on the NYSE as well.  Some fear and profit taking is coming into play here, another bearish sign for the upcoming days/weeks.  And when you take into account the high level of optimism, the overstretched rally, overbought momentum indicators, and the VIX sell signal that executed yesterday, it makes for a good setup for the bears on the short side here.


Another good piece of evidence for the bears is the 5 wave decline in the Nasdaq 100.  The evidence is strong that a top may be in place and it's worth it for the bears to at least start nibbling here, in my opinion.

Learn Elliott Wave Principle


PLEASE NOTE: THIS IS JUST AN ANALYSIS BLOG AND IN NO WAY GUARANTEES OR IMPLIES ANY PROFIT OR GAIN. THE DATA HERE IS MERELY AN EXPRESSED OPINION. TRADE AT YOUR OWN RISK.

StatCounter